OPTIMIZATION OF DRINKING WATER TREATMENT PROCESSES USING ARTIFICIAL NEURAL NETWORK. 17 ultrafiltration and after backwashing [11].
OPTIMIZATION OF DRINKING WATER TREATMENT PROCESSES USING ARTIFICIAL NEURAL NETWORK Ogwueleka, T.C. 1 and Ogwueleka, F.N. 2 1 Department of Civil Engineering, University of Abuja 2 Department of Mathematics, Statistics & Computer Science, University of Abuja. ABSTRACT Drinking water treatment is the process of removing microorganisms and solid from water through different methods such as coagulation and filtration. Artificial neural network (ANN) was developed for process and cost optimization of drinking water treatment processes. Results obtained from ANN model showed that ANN is a suitable tool for the improvement of overall process performance and cost effectiveness in drinking water treatment. There was cost reduction, process safety improvement, and high stability in ANN application of water treatment. Keywords: Water treatment, artificial neural network, cost optimization, filtration, sedimentation INTRODUCTION The main objective of drinking water treatment plant is to produce safe drinking water for consumption (without pathogenic micro-organisms and toxic compounds); to produce attractive drinking water (free from colour, taste and odour) and to avoid accumulation of solids, corrosion and aftergrowth of bacteria in the distribution and transport pipelines [1]. This must be done against the lowest costs with the lowest impact on the environment. Water treatment usually comprises water clarification and disinfection. The co n v ent i onal puri fi c a t i on s ys t em (coagulation/sedimentation and filtration) is mainly used to eliminate turbidity. Sedimentation is the solid liquid separation using gravity settling to remove suspended solids. Filtration is the process of passing water through a porous medium with the expectation that the filtrate has a better quality than the influent. The coagulation process utilizes what is known as a chemical coagulation (aluminum or
iron salt) to promote particle agglomeration. Chemical coagulation procedure includes chemical dosing, rapid mixing and slow mixing (forming coarse floc). Any abnormal or high turbidity in raw water quality will result in adjustment of amount of chemical coagulant and pH. This may result in under or overdosing of the coagulant and extra chemical costs. Due to complex nature of drinking water treatment processes, ANN is gaining importance in process modeling. Many researchers have discussed the history, capability, kinds, structure and learning algorithm of neural networks [2], [3], [4]. ANNs as data driven empirical models have been successful applied in all field of water technology: metal bioleaching in municipal sludge [5], prediction of wastewater inflow rate [6], peak Cryptosporidium and Giardia concentrations [7], membrane technology modeling [8], prediction of breakthrough time in a fixed-bed adsorption system [9], modeling coagulant [10], influx during 16
OPTIMIZATION OF DRINKING WATER TREATMENT PROCESSES USING ARTIFICIAL NEURAL NETWORK
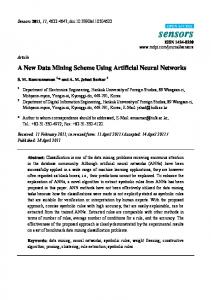
ultrafiltration and after backwashing [11] and to identify non-point sources of faecal contamination [12]. Haykin [13] defines neural network as “a massively parallel distributed processor that has a natural propensity for storing experiential knowledge and making it available for use. It resembles the brain in two respects - knowledge is acquired by the network through a learning process, and interneuron connection strengths known as synaptic weights are used to store the knowledge.” The neural network approach is a branch of artificial intelligence. The ANN is based on a model of the human neurological system that consists of basic computing elements (called neurons) interconnected together (Figure 1). The model used for all classification attempts was a standard, three layer, back propagation, neural network with N input nodes, L hidden nodes, and 1 output nodes. A layer of neurons is determined by its weight matrix, a bias vector and a transfer function. The actual number of hidden neurons has to be estimated by trial and error. The number of neurons in the output layer equals the number of desired outputs. Information propagates from the input layer to the out layer through the hidden layer. The objective of this study is to design and develop an ANN model for improvement of process performance and least cost use in drinking water treatment.
17
Fi g ur e 1: A n e ur al network (ANN is an interconnected group of nodes)
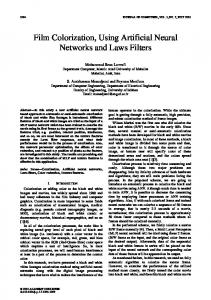
Methodology The ANN designed model include the ANN architecture, treatment of raw water by the microstrainer, through ozonation, flocculation, sedimentation and filtration process, training of the ANN, evaluating the results, validating and applying the ANN. Challawa water treatment plant, Kano was chosen. The flowchart of the ANN steps used is shown in Figure 2. Raw water was taken from Kano River. It was treated by microstrainer, ozonation, and coagulation/flocculation, milk of lime dosing, sedimentation, filtration and activated carbon filtration. The coagulation process using pH adjustment and coagulant dosage was controlled by observation of unprocessed water turbidity and electrical conductivity. The flocculant aid was not dosed. For filter backwashing, the three criteria used are turbidity in filter effluent which is less than 0.2 FNU, particles of greater than 1µm in filter effluent which is less than 320#/mll, and filter run time of greater than 65 h.
NIGERIAN JOURNAL OF TECHNOLOGY, VOL. 28 NO.1, MARCH 2009
18
OGWUELEKA, T.C. & OGWUELEKA, F.N.
Figure 2: Steps in
designing ANN architecture
The three decisive factors were conditioned with the value to avoid excess growth of microorganisms and for hygienic reasons. Observation made showed a slight increase during the filter runs due to pressure drop in the filters, although it did not limit the run time of the filter. The water from rapid filtration was collected with the sludge from sedimentation in the setting tank. The sludge was discharged to the sewer system and the effluent discharged to the reservoir effluent river. The network used was a feed forward network or multi-layer feed forward network. Feed forward networks are most commonly trained using a back-propagation algorithm. The three-layer, back propagation neural network can be expressed mathematically as
where N = input nodes, L = hidden nodes, K = output nodes Opk = output from the kth node of the output layer of the network xpi = inputs to the network for pth vector. Woj,k = connection weight between jth node of the hidden layer and kth node of the output layer. Whij = connection weight between ith node of the hidden layer and jth node of the output layer. f1(.) and f2(.) are activation functions. The commonly used activation function is a logistic sigmoidal function which has a
NIGERIAN JOURNAL OF TECHNOLOGY, VOL. 28 NO.1, MARCH 2009
OPTIMIZATION OF DRINKING WATER TREATMENT PROCESSES USING ARTIFICIAL NEURAL NETWORK
form given below:
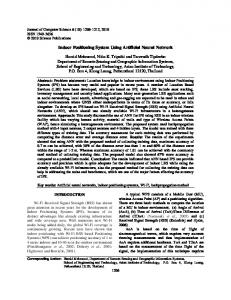
In designing this ANN model, the six procedural steps used are illustrated in Figure 3. The data to be used was first defined and presented to the ANN as a pattern of input data with the desired outcome. The data was then categorized to be either the training set or validation set. The ANN only uses the training set in its learning process in developing the model. The validation set is used to test the model for its predictive ability and when to stop the training of the ANN. Next, the ANN structure was defined by selecting the number of hidden layers to be constructed and the number of neurons for each hidden
19
layer. All the ANN parameters were set before the training process started. The (2) training process involves the computation of the output from the input data and the weights. The backpropagation algorithm was used to train the ANN by adjusting its weights to minimize the difference between the current ANN output and the desired output. Finally, an evaluation process was conducted to determine if the ANN has learnt to solve the task at hand. This evaluation process involved periodically halting of the training process and testing its performance until an acceptable result was obtained. When the acceptable result was obtained, the ANN was then considered to have been trained and ready to be used.
Fig Six
ure 3: proced ural steps used in designing ANN model
As there are no fixed rules in determining the ANN structure or its parameter values, a large number of ANNs were constructed with different structures and parameters before determining a suitable model. By performing periodic testing of the designed ANN on the test set and recording both the results of the training and test data set results, the number of iterations that produce the best model was obtained. All that was needed to reset the ANN and train the network up to that number of iterations. The procedure outlined in steps was developed into a computer program using a visual studio program.
Results The data points were used to determine the best possible values of the weighting factors and the best architecture for the network. For process optimization and cost reduction, the costs for chemicals, for the energy needed for pumps, filter backwashing and for the discharge of waste were considered. The costs are shown in Table 1. The sludge from the settling tank is discharged to the municipal sewer system and discharge fees paid in accordance with the sludge amount and solid content. The effluent from the settling tank is discharged to the river without cost. In filter
NIGERIAN JOURNAL OF TECHNOLOGY, VOL. 28 NO.1, MARCH 2009
20
OGWUELEKA, T.C. & OGWUELEKA, F.N.
backwashing, there is a considerable amount of cost during production and only treated water was used. It was observed that cost of milk of lime, was very small. Table 1: 2008 Selected costs for drinking water treatment Selected costs
Energy costs Costs for backwash water production Costs of chemicals Discharge costs for sludge and filter backwashing
Percentage costs (%)
48 18 24 10
Cost minimization will cover the whole process of coagulation, sedimentation and filtration. The cost function contains the costs for coagulant (CostsCoagulant), costs for energy (Costsenergy ), costs for sludge disposal (CostsSludge disposal) and costs for filter backwash water (CostsFilter backwash). Costs = Costscoagulant + Costsenergy + Costssludge disposal+CostsFilter backwash (3) The costs for coagulant in x/h are calculated by the addition of amount of coagulant of Fe3+ in kg/h, and the specific coagulant costs (spec. CostsFe3+ in x /kg Fe3+).
The costs for energy (Costsenergy) are calculated by addition of energy cost for stirrers and for pumping of water and air for filter backwashing. The cost was read from digital meter installed along the power source of the pumps and the stirrers. The cost for sludge disposal (CostsSludge disposal in x /h) are calculated by the added amount of coagulant (Fe3+ in kg/h) and the specific disposal costs ( spec. CostsSludge disposal in x/kg Fe3+). The costs for sludge disposal were paid at a flat rate as it
is dependent on the added coagulant.
The costs for filter backwash water (CostsFilter backwash in x /h) are calculated by the cost of one filter backwash (Cost of one filter backwash in x) divided by the filter run time and multiplied by the number of filters in operation ( n Filter in operation).
During the ANN training, accurate process optimization was derived by the variation method of the coagulant dosage and the minimum of the cost function. The coagulant dosage was calculated through turbidity of sedimentation effluent, calculation of costs and the ANN. This helped in obtaining the accurate minimum overall treatment costs as illustrated in the flowchart in Figure 4. From the graph of mean turbidity load in influent of rapid filters against the filer run time, it was noted that as mean load decreases, filter run times increases (Figure 5). The turbidity was equally (4) varying because of the sedimentation effluent turbidity and water flow filter changes. The mean load was obtained from the turbidity loads that occurred within a filter run. The relationship between the filter run time in hours and the mean turbidity load in the filter influent is described by the equation(7): Filter run time = 957.(Turbidity load) –0.72 (7) For n number of filters, the costs for filter backwash was calculated as
NIGERIAN JOURNAL OF TECHNOLOGY, VOL. 28 NO.1, MARCH 2009
OPTIMIZATION OF DRINKING WATER TREATMENT PROCESSES USING ARTIFICIAL NEURAL NETWORK
21
(8)
Figure 4: Flowchart for optimization
The parameter range of the coagulant dosage was monitored till the amount matched minimum treatment costs. The pH level was 7.2 as noted during the treatment part for time range. Figure 6 shows the measured and calculated turbidity in the effluent of the sedimentation. For the purpose of this study, performance evaluation results were obtained through the use of the proposed coagulant concentration to the measured
calculating process
likely savi ngs in coagulant dosage by the integrated process optimization with the ANN, and through the measured and calculated turbidity in the effluent of the sedimentation step after the ANN optimization of the coagulant dosage. Figure 7 shows the proposed coagulant dosage by costs optimization with ANN in r e l a t i o n t o m e a s u r e d c o a gu l a n t concentration. Figure 8 shows the observed and the calculated expected turbidity in the effluent of the sedimentation after
NIGERIAN JOURNAL OF TECHNOLOGY, VOL. 28 NO.1, MARCH 2009
22
op t i mi za tio n
OGWUELEKA, T.C. & OGWUELEKA, F.N.
o f coagul a n t do s ag e by ANN.
NIGERIAN JOURNAL OF TECHNOLOGY, VOL. 28 NO.1, MARCH 2009
OPTIMIZATION OF DRINKING WATER TREATMENT PROCESSES USING ARTIFICIAL NEURAL NETWORK
Discu ssion The first step was to design a specific
23
net wo rk architecture, that includes a specific
NIGERIAN JOURNAL OF TECHNOLOGY, VOL. 28 NO.1, MARCH 2009
24
OGWUELEKA, T.C. & OGWUELEKA, F.N.
number of layers each consisting of a certain number of neurons. The size and structure of the network needs to match the nature of the investigated phenomenon. The new network was then subjected to the “training” process. In that phase, neurons applied an iterative process to the number of inputs/variables to adjust the weights of the network in order to optimally sample data on which the training is performed. After the phase of learning from an existing data set, the new network is ready and it can then be used to generate predictions. The resulting network developed in the process of learning represents a pattern detected in the data. So, in this approach, the network is the functional equivalent of a model of relations between variables in the traditional model building approach. The ANN used is the multilayer perceptron network and was trained with the back-propagation algorithm. In training the ANN, the time ranged between 6/8/2007 and 22/2/2008. During the time range, raw water turbidity varied between 1 and 6 FNU. The electrical conductivity varied between 100 µS/cm and 230 µS/cm while the pH value ranged between 6.5 and 7.3. Temperature ranged between 25EC and 29EC and oxygen concentration ranged between 9 mg/l and 14 mg/l. The ANN output was the sedimentation effluent turbidity. The available data set was up to 20,000 and 5000 data sets were separated for model validation. The accuracy of the calculations was very high with mean absolute deviation of 1.3% with training data 1.4% and 1.2% for validation data. The process of weight calibration or training can take a significant amount of time, depending on the network
architecture and training algorithm. The network training took about 1hour 30 minutes while running on Intel Core Duo CPU T2600 @2.16GHz with 1GB RAM. Conclusion A neural network model for cost optimization of drinking water treatment process was successful developed using visual studio software. The model developed was able to improve the performance process and cost effectiveness in drinking water treatment using the available data. This study demonstrated that a neural network can be used to optimize drinking water treatment processes and that the technique can be automated. References [1] Van Dijk J. C. and Van der Kooij D. Water quality 21 research programmes for water supplies in the Netherlands. Water Sci. Technol. Water Supply 2004; 4(5–6), 181–188. [2] Gob S., Oliveros E., Bossmann S.H., Braun A.M., Nascimento C.A.O. and Guardani R. Optimal experimental design and artificial neural networks applied to the photochemically enhanced Fentom reaction. Water Science Technology 2001; 44 (5): 339-45. [3] Loke E., Warnaars E.A., Jacobsen P., Nelen F. and Ceu Almeida M. Artificial neural networks as a tool in urban storm drainage. Water Science Technology 1997; 36 98-9): 101-9. [4] Lek S., Guiresse M. and Giraudel J-L. Predicting stream nitrogen concentration from watershed features using neural networks. Water
NIGERIAN JOURNAL OF TECHNOLOGY, VOL. 28 NO.1, MARCH 2009
OPTIMIZATION OF DRINKING WATER TREATMENT PROCESSES USING ARTIFICIAL NEURAL NETWORK
[5]
[6]
[7]
[8]
Research 1999; 33 (16): 3469-78. Laberge C., Cluis D. and Mercier G. Metal bioleaching prediction in continuous processing of municipal sewage with Thiobacillus Ferrooxidans using neural networks. Water Research 2000; 34 (4): 114556. El-Din A.G. and Smith D.W. A neural network model to predict the wastewater inflow incopporating rainfall events. Water Research 2002; 36: 1115-26. Neelakantan T.R., Brion G.M. and Lingireddy S. Neural network modeling of Cryptosporidium and Giardia concentrations in the Delaware River, USA. Water Science Technology 2001; 43. Strugholtz S., Panglisch S., Gebhardt J. and Gimbel R. Neural networks and genetic algorithms in membrane technology modeling. J.Water Supply Res. Techno.-AQUA 2008; 57 (1), 2334.
25
[9] Basheer I.A. and Najjar Y.M. Designing and analyzing fixed bed adsorption systems with artificial neural networks. J Environ Syst. 1995; 23(3):291–312. [10] Maier H.R., Morgan N. and Chow C.W.K. Use of artificial neural networks for predicting optimal alum doses and treated water quality parameters. Environ. Model. Software 2004; 19 (5), 485-494. [11] Teodosiu C., Pastravanu O. and Macoveanu M. Neural network models for ultra-filtration and backwashing. Water Research 2000; 43 (12): 125-32. [12] Brion G.M. and Lingireddy S. A neural net work approach to identifying non-point sources of microbial contamination. Water Research 1999; 33 (14): 3099-106. [13] Haykin, S. Neural Networks: A Comprehensive Foundation, Prentice Hall. New York. 1999.
NIGERIAN JOURNAL OF TECHNOLOGY, VOL. 28 NO.1, MARCH 2009