Sep 4, 1989 - after a lag phase to adult levels during the second and ..... This work was supported in part by research grants from the Ministry of Education, Science and ... Chirgwin,J.M., Przybyla,A.E., MacDonald,R.J. and Rutter,W.J. (1979).
The EMBO Journal vol.8 no. 12 pp.3611 -3616, 1989
Differential regulation of three sodium channel messenger RNAs in the rat central nervous system during development Synnove Beckh" 2'3, Masaharu Noda1, Hermann Lubbert2 and Shosaku Numa' 'Departments of Medical Chemistry and Molecular Genetics, Kyoto University Faculty of Medicine, Kyoto 606, Japan and 2Department of Preclinical Research, Central Nervous System Group, Sandoz Ltd, CH-4002 Basel, Switzerland 3Present address: Max-Planck-Institut fur Biophysikalische Chemie, D-3400 Gottingen, FRG Communicated by S.Numa
The levels of the mRNAs encoding sodium channels I, II and III in various regions of the developing rat central nervous system (from embryonal day 10 to postnatal day 90) have been examined by blot hybridization analysis with specific probes. The three sodium channel mRNAs exhibit different temporal and regional expression patterns. The expression of sodium channel I mRNA rises after a lag phase to adult levels during the second and third postnatal weeks with stronger increases in caudal regions of the brain and in spinal cord. Sodium channel II mRNA increases steadily until the first postnatal week, keeping high adult levels in rostral regions of the brain or reaching low adult levels after the second postnatal week in most caudal regions of the brain and in spinal cord; cerebellum shows low levels during the first two postnatal weeks but high adult levels. In all regions, sodium channel HI mRNA attains maxinum levels around birth and decreases during the first and second postnatal weeks to reach variable low adult levels. These results suggest that sodium channel Ill is expressed predominantly at fetal and early postnatal stages and sodium channel I predominantly at late postnatal stages, whereas sodium channel II is expressed throughout the developmental stages studied with greater regional variability. Key words: brain/mRNA expression/Na+ channel/RNA blot hybridization analysis/spinal cord
functional channels in Xenopus oocytes (Noda et al., 1986b; Stiihmer et al., 1987, 1989; Auld et al., 1988; Suzuki et al., 1988). Whole cell current measurements of sodium channels II and III thus expressed show no significant difference in functional properties (Noda et al., 1986b; Suzuki et al., 1988); the expression of sodium channel I in Xenopus oocytes is too low for detailed analysis (Noda et al., 1986b). The ontogenesis of sodium channels in the central nervous system (CNS) has previously been studied by means of action potential recordings (Huguenard et al., 1988), neurotoxinbinding assays (Berwald-Netter et al., 1981; Lombet et al., 1983; Boudier et al., 1985; Martin-Moutot et al., 1987; Mourre et al., 1987), sodium flux measurements (Couraud et al., 1986) and protein analyses using antibodies (Schmidt et al., 1985; Gordon et al., 1987). Only limited information on the developmental occurrence of sodium channels can be gathered from these studies, each of which dealt with a different aspect of sodium channels and covered only certain stages of development and/or limited regions of the CNS. Moreover, most of these studies did not distinguish between the individual sodium channel types. In the present investigation, the ontogenetic and regional changes in the levels of sodium channel I, II and III mRNAs in the rat CNS have been assessed by means of blot hybridization analysis using specific probes. The results obtained show temporal and regional differences in the expression patterns of the three sodium channel mRNAs. Two inverted gradients, a caudal-to-rostral decrease of sodium channel I mRNA and a rostral-to-caudal decrease of sodium channel II mRNA with the exception of cerebellum, exist in the adult rat CNS. Furthermore, timedependent switches occur between the levels of sodium channel Ill and I mRNAs in all regions studied and between the levels of sodium channels II and I mRNAs in medullapons and spinal cord. Physiological implications of these findings are discussed.
Results Introduction Voltage-gated sodium channels are essential for the generation and propagation of action potentials and have been characterized in many different cell populations (Hille, 1984). More recently, the application of recombinant DNA methods has revealed a diversity of rat brain sodium channel types. The primary structures of four different rat brain sodium channels, designated as sodium channels I, II (Noda et al., 1986a), HA (Auld et al., 1988) and Ill (Kayano et al., 1988), have been deduced by cloning and sequencing the respective cDNAs; there are only six amino acid differences between sodium channels II and IIA. mRNAs specific for the individual sodium channels, synthesized by transcription in vitro of the cloned cDNAs, direct the formation of @IRL Press
Total RNA was extracted from various regions of the rat CNS at a wide range of developmental stages and was subjected to blot hybridization analysis with RNA probes specific for sodium channel I, II and III mRNAs. Figure 1 exemplifies an experiment with RNA samples from total brain at the stages of embryonic day 10 (EIO) to postnatal day 90 (P90), using the sodium channel II-specific probe. The presence of equivalent amounts of RNA on each lane of the blot was assured by staining RNAs with methylene blue (Figure IA). The autoradiogram obtained after hybridization of the blot with the probe is shown in Figure lB. Figure 2A and B displays the results obtained on sets of separate but identically prepared blots of RNA samples from various regions that were hybridized to probes specific for the individual sodium channel mRNAs or to a coding region probe capable of recognizing all the three sodium channel
3611
S.Beckh et a!..
brain of rats of indicated ages: lane 1, EIO; lane 2; E12; lane 3, E15; lane 4, E18; lane 5, PI; lane 6, P4; lane 7, P7; lane 8, PIO; lane 9, P12; lane 10, P15; lane 11, P20; lane 12, P30; lane 13, P60; lane 14, P90; and lane M, size markers in kb (not shown in B). The sodium channel 12specific probe was used for hybridization. The duration of autoradiography was 18 h. An RNA ladder (Bethesda Research Laboratories) was used as size markers. The rRNAs (18S and 28S) and the major hybridizing band (-9500 nucleotides) are indicated by arrowheads in A and B respectively.
mRNAs (common probe). The different CNS regions examined are presented in a rostral-to-caudal order and the time points of RNA isolation from the respective regions are indicated. It can be seen that each probe reveals a specific temporal and regional pattern of mRNA expression during development, as described below in detail. Autoradiograms were densitometrically scanned to evaluate the temporal and regional changes in the levels of the individual sodium channel mRNAs and the results obtained for total brain and spinal cord are shown in Figure 3A and B. Expression of sodium channel I mRNA Sodium channel I mRNA is hardly detectable at EIO. The rmRNA level increases slowly but continuously until birth in spinal cord and medulla-pons or until about P7 in all other brain regions. Then it further increases steeply during the first and second or the second and third postnatal weeks in the former and in the latter regions of the CNS respectively, and remains almost constant thereafter. The mRNA is most abundant in caudal regions of the brain (midbrain, superior and inferior colliculus, cerebellum, and medulla-pons) and in spinal cord between postnatal days P15 and P90. In contrast, retina, olfactory bulb, cerebral cortex, hippocampus and corpus striatum show low mRNA levels. This can be described as a caudal-to-rostral gradient manifested in adulthood. Expression of sodium channel 11 mRNA Sodium channel II mRNA is detectable as early as at ElO in total brain and spinal cord (after longer exposure of autoradiograms) and is present throughout the subsequent developmental stages studied. The mRNA level increases steadily until the first postnatal week. After reaching maximum levels the time course is variable in different regions. In cerebral cortex, hippocampus and corpus striatum the high levels are maintained throughout development. In other areas, such as midbrain, colliculi, medulla-pons and spinal cord, a moderate or pronounced decline to lower adult levels occurs during the second postnatal week. This phenomenon can be described as a rostral-to-caudal gradient in adulthood. Cerebellum shows, in contrast, a lag phase of 2-3 weeks with a low initial level which increases rapidly during the second postnatal week to the high adult level. This, together with the size of cerebellum, contributes substantially to the postnatal high and almost constant level of expression in total brain.
3612
Expression of sodium channel Ill mRNA Expression of sodium channel III mRNA probably starts during early embryogenesis since significant levels in total brain and spinal cord are observed as early as at EIO. Maximum levels are attained around birth and followed by a rapid decline during the first and second postnatal weeks to very low adult levels, although the latter levels are variable in different regions. Relatively high adult levels are found in cerebral cortex, hippocampus, corpus striatum, midbrain, colliculi and medulla-pons, whereas the adult levels in retina, cerebellum and spinal cord are very low. After P15 these low levels still decrease in colliculi and medulla-pons and become undetectable in cerebellum. Relative abundance of the three sodium channel mRNAs Assuming similar hybridization efficiencies for the three specific probes and correcting for differences in their sp. acts, sodium channel II mRNA is generally the predominant type in the rat CNS throughout the developmental stages studied; the duration of autoradiography was mostly 12 h for sodium channel II mRNA and 36 h for sodium channel I and III mRNAs (see Figure 2 legend). There are a few exceptions to this general pattern. For example, sodium channel Ill mRNA prevails over sodium channel II at embryonic stages ElO-E12 in total brain and spinal cord. Especially in midbrain, inferior colliculus and cerebellum the predominance of sodium channel III mRNA lasts until about P4. Comparing the sodium channel mRNA levels in the different regions of the CNS we can find two gradients that develop during the second and third postnatal weeks: i) a caudal-to-rostral decrease of sodium channel I mRNA and ii) a rostral-to-caudal decrease of sodium channel II mRNA with the exception of cerebellum. These two inverted gradients are reflected in the predominance of sodium channel I mRNA in medulla-pons and spinal cord of rats older than 2 weeks. Sodium channel I and II protein levels in synaptosomes from rat brain measured with sequencespecific antibodies (Gordon et al., 1987) generally parallel the described mRNA levels. The decline of sodium channel II protein at P90 can probably be accounted for by omitting cerebellum from the total brain preparations (see above). A comparison between mRNA and protein levels of sodium channels I and II in spinal cord is difficult since Gordon et al. (1987) have presented their data as protein ratios. However, the switching of sodium channel II and I mRNA levels is
Developmental regulation of sodium channel mRNAs
A NaCh I
- 0fn
'S.
NaCh 11 uvw
I
fo
*w 9,
.nttt "fi"t9tl ilil
NaCh III
NaChI t
I i
i
v To I
NaCh
9I, -
#t
vi
* P*,'
-'9I9
' o
B NaCh
t'1
'I
NahI NaCh 11
NaCh 111
*.te9
e
so
0 fl¶9
699
S
*
-~~~~~ 4**^: .lt Na"WiCh too
&
-
Tn
NaCh
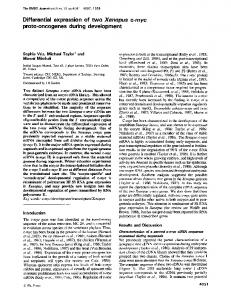
Fig. 2. Autoradiograms of blot hybridization analysis of total RNA from rat CNS regions. The results are presented in matrix form, showing from top to bottom autoradiograms of blots hybridized to the probes specific for sodium channel I (NaCh I), II (NaCh H) and III (NaCh HI) mRNAs and to the common probe (NaCh), and from left to right, data for different regions at different developmental stages: (A) rostral part of the brain and retina; (B) caudal part of the brain and spinal cord. Autoradiographic exposure times were usually 36 h for NaCh I and NaCh III, 12 h for NaCh II and 6 h for NaCh in all regions with the following exceptions: 36 h for NaCh II and NaCh in retina at all stages and for NaCh in spinal cord at E12; and 12 h for NaCh in total brain at all stages and in spinal cord at the other stages. For size markers see Figure 1. The major hybridizing band for each probe is indicated by a closed arrowhead, and an additional band present in spinal cord by an open arrowhead (for sizes of the RNAs see Materials and methods). Cerebral cortex represents the hemispheres devoid of hippocampus and corpus striatum, and midbrain represents the brain stem region devoid of colliculi and medulla-pons.
3613
S.Beckh et al.
reflected in the predominance of sodium channel II and I proteins in newborn and adult spinal cord respectively. The sodium channel II- and IH-specific probes both recognize two mRNA species, which may be attributable to two different polyadenylation sites found in the 3' noncoding region of the respective cDNAs (Noda et al., 1986a; Suzuki et al., 1988). The ratios of the signal intensities of the main sodium channel II- and Imi-specific bands to the respective minor bands are invariable throughout development and in all CNS regions studied. The bottom row of Figure 2 shows hybridization signals obained with the common probe. In some regions of the CNS, including midbrain, colliculi and spinal cord, the sum of the signal intensities resulting from hybridization with the three specific probes is lower than the signal intensities that are obtained with the common probe in the same size range as the three main sodium channel mRNA bands ( - 9000-9500 nucleotides). This observation may suggest the presence of other sodium channel mRNA species. Such additional RNA(s) seem to comprise the majority of sodium channel mRNAs in retina, where the signal intensities can be directly compared for all the four probes (36 h exposure). The high level of additional sodium channel mRNA(s) in retina may correspond to the high proportion of additional sodium channel proteins (76%) reported by Gordon et al. (1987), and our results indicate that sodium channel HI alone is not likely to account for the additional proteins. The time course observed for retina with the common probe is in general agreement with the results described by Wollner et al. (1988) using a different coding region probe. The presence of significant amounts of additional sodium channel mRNA(s) is also suggested for colliculi and spinal cord. It is to be noted that spinal cord at ElO (not shown) to E15 shows a novel RNA species of 10 000 nucleotides (Figure 2B, spinal cord E12; open arrowhead), which may represent a distinct sodium channel mRNA. This coincides in size with an mRNA species detected with the common probe in rat peripheral nerves and sympathetic ganglia at postnatal stages (our unpublished data). The spinal cord preparations at developmental stages EIO-E15 are very likely to be contaminated by dorsal root ganglia which could account for this extra RNA species. -
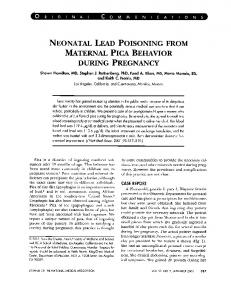
Temporal expression patterns of the three sodium channel mRNAs The time course of expression of sodium channel I mRNA is characterized by a sloping lag phase, followed by a linear increase to steady-state levels. The transition from the lag phase to the rising phase of sodium channel I mRNA expression temporally coincides with maximal expression of sodium channel II mRNA attained during the first postnatal week. Sodium channel HI mRNA increases rapidly to maximum levels which are maintained for -1 week, starts to decrease during the first postnatal week and reaches low steady-state levels after the second postnatal week. The observed temporal expression patterns of sodium channel I and III mRNAs do not essentially differ between total brain and spinal cord, whereas sodium channel II mRNA shows distinct expression patterns (see Figure 3A and B). In brain the time course of expression of sodium channel II mRNA resembles that of sodium channel I mRNA except for the lag phase of the latter, but in spinal cord the time course
3614
of expression of the former resembles that of sodium channel III mRNA. The initial increase of all three sodium channel mRNAs occurs several days earlier in spinal cord than in brain. Taken together, these results reveal two timedependent switches in sodium channel mRNA expression in the CNS: i) a switch in expression of sodium channel III and I mRNAs is observed in all the regions studied at a time when both mRNA levels are about half-maximal and ii) a second switch in expression of sodium channel II and I mRNAs is observed in spinal cord and medulla-pons. These differential mRNA expression patterns suggest that sodium channel Ill is expressed predominantly at fetal and early postnatal stages, whereas sodium channel I is expressed predominantly at late postnatal stages. The expression of sodium channel II is suggested to occur throughout the developmental stages studied, being subject to greater
regional variability. Discussion The results of the present study reveal that the expression of sodium channel I, II and III mRNAs in the CNS exhibits distinct temporal and regional patterns, suggesting specific developmental regulation of the expression of the individual genes. Neurogenesis in rat CNS starts at E9 -EO0 (Altman and Bayer, 1981; Koulakoff et al., 1982; Altman and Bayer, 1984), and gliogenesis begins slowly before birth and peaks around the third postnatal week (Zeller et al., 1984; Holmes et al., 1988). We have detected all three sodium channel mRNAs as early as at E1O-E12. The subsequent rapid prenatal rise of sodium channel mRNAs correlates well with measured increases of neurotoxin-sensitive sodium flux and sodium channel-specific toxin binding on freshly dissociated fetal mouse brain cells (Berwald-Netter et al., 1981; Couraud et al., 1986), although these studies did not distinguish between the different sodium channel types. Furthermore, microscopic studies of scorpion toxin-binding sites on these fetal cells have shown increases in both the number of sodium channel-bearing cells and the number of sodium channels per cell during embryonic development (Martin-Moutot et al., 1987). They have also indicated that these sodium channels are localized predominantly on neurites (Boudier et al., 1985). Glial cells have been shown to exhibit functional sodium channels, although at much lower density than neurons (Nowak et al., 1987; Barres et al., 1989). The changes in sodium channel mRNA levels we have observed could reflect the appearance and disappearance of cells with or without sodium channels during neurogenesis and gliogenesis. The increases of sodium channel III, II and I mRNAs in all regions could be related to early and late postmitotic neuronal subpopulations. The following decrease of sodium channel III mRNA in all regions and sodium channel II mRNA in most caudal regions of the brain and in spinal cord could then be interpreted as a dilution effect due to the generation of new neuronal or glial subpopulations or to cell death (Cowan et al., 1984). In addition, the sodium channel mRNA expression patterns observed could reflect cellular maturation events, such, as the growth of sodium channel-bearing processes during neuritogenesis and the formation of synapses and neural networks during synaptogenesis. One possibility of
Developmental regulation of sodium channel mRNAs 1.0-
A
_
_ TOTAL BRAIN
OL5
EO E10 P1 P10
P30 Age (days)
P60
P90
1.0- B .c
SPINAL CORD
0.5-
E0 ElO
P1 P10
P30 Age (days)
P60
P90
Fig. 3. Temporal expression patterns of sodium channel I, II and III mRNAs in total brain (A) and spinal cord (B). Diamonds, triangles and circles represent the relative abundance of sodium channel I, II and III mRNAs respectively; similar hybridization efficiencies for the three specific probes are assumed. The densitometric values have been corrected for differences in autoradiographic exposure times and in sp. acts of the probes. Averaged data comprising 2-5 independent RNA samples (deviation from the means being within 10%) are shown for total brain at E12, P4, P7, P15, P30, P60 and P90 and for spinal cord at E12, P7, P30, P60 and P90.
interpreting our results would be to attribute the expression of sodium channel III mRNA principally to somatic sodium channels, which generate single action potentials, and the expression of sodium channel I and II mRNAs mainly to axonal and dendritic sodium channels, which may be involved in the generation of complex firing patterns. In accordance with this idea are the high sodium channel IH mRNA levels observed in all regions of the CNS at times when most neurons are still immature and exhibit mainly somatic sodium currents and simple spike patterns (Gruol and Franklin, 1987). These high levels are followed by low persistent adult levels. Immunohistochemical studies have shown that sodium channels of mature neurons are sparsely distributed on cell somata and concentrated on axon hillocks and neuritic terminals (Angelides et al., 1988). Of interest in this context is the observation that a slowly inactivating sodium current component becomes distinguishable -1 week after birth in rat neocortical neurons (Huguenard et al., 1988). This current, characteristic of mature neurons, is found in pyramidal and nonpyramidal neurons and is thought to facilitate repetitive firing. Furthermore, persistent sodium conductances which may regulate excitability patterns have been described for a variety of neurons from different regions of the CNS (Llinas, 1988; Gahwiler and Llano, 1989). In view of the fact that sodium channel I mRNA increases late and that sodium channels II and III, expressed in Xenopus oocytes, inactivate rapidly (Noda et al., 1986b; Stiihmer et al., 1987, 1989; Suzuki et al., 1988), sodium channel I or a yet unidentified sodium channel type is a possible candidate for such a slowly inactivating current. In addition, since the progression of myelination (Peters and Vaughn, 1970; Zeller et al., 1984) temporally coincides with the increase of
sodium channel I mRNA and since myelination alters the distribution of ion channels (Hille, 1984), sodium channel I could be involved in such an event. The high expression levels of sodium channel I mRNA in white matter (caudal regions of the brain and spinal cord) support this idea. The late postnatal increase of sodium channel II mRNA in cerebellum coincides with increasing synapse and network formation which starts around P8 (Altman, 1982; Koulakoff et al., 1982). Neurotoxin-binding studies on postnatal brain slices have also shown late increases in binding sites during cerebellar development (Lombet et al., 1983; Mourre et al., 1987), although no distinction between the three sodium channel types was possible. Further support for the idea that sodium channel II is related to neuritogenesis and synaptogenesis is provided by the high persistent sodium channel II mRNA levels in brain regions with high synaptic plasticity, such as cerebral cortex and hippocampus, and by the only transiently high levels around birth observed for spinal cord where most synaptic connections are established 2 weeks after birth (Altman and Bayer, 1984). Thus, the switching of different sodium channel mRNAs could be related with the change from somatic to axonal and dendritic excitability, with the acquisition of complex firing patterns and/or with the progression of myelination. -
Materials and methods RNA preparation Wistar rats (strain: Wistar ST) of ages ranging from embryonic day 10 (EIO) to postnatal day 90 (P90) were sacrificed and the CNS was dissected in sterile phosphate-buffered saline (Gibco) under a stereo microscope. Samples were immediately frozen on dry ice or in liquid nitrogen, pooled and stored at -80°C. Equal numbers of male and female animals were used for each time point except for embryonic tissues. The variations in age were ± 12 h for embryonic and postnatal tissues up to P12 and 1 day for postnatal tissues from animals older than P15. Tissues referred to as P90 were taken from animals of day P90 or older. Total brain tissues at EIO-E12 contained the brain and part of the skull excluding the facial portion of the head and spinal cord tissue at E0-E15 contained the whole spine. Total RNA was isolated by the guanidinium isothiocyanate method (Chirgwin et al., 1979). Each RNA sample was adjusted to a concentration of 2.5yg/IL and 7.5 og of RNA was applied to each lane.
RNA blot hybridization analysis The procedure used was essentially the same as described previously (Suzuki et al., 1988). The presence of equivalent amounts of rRNAs (18S and 28S) on each lane was confirmed by ethidium bromide staining of the gels, and their transfer to the membrane (Biodyne nylon membrane, Pall) was ensured by methylene blue staining (Maniatis et al., 1982) of some filters. Sets of four separate but identically prepared RNA blots were pooled after baking and stored at room temperature before they were hybridized under identical conditions with RNA probes which were simultaneously prepared using [ca-32PGTP. The RNA probes, derived from 3' noncoding sequences of the sodium channels I, Handm cDNAs (specific probes) and from a protein coding sequence of the sodium channel II cDNA (common probe) have been described previously (Suzuki et al., 1988). The sp. acts of the four probes used for hybridization were 4.1-5.5 x I09 d.p.m./4g. The lengths of the sodium channel I-,II- and III-specific probes and the common probe are 423, 475, 479 and 307 nucleotides (excluding vector sequences) respectively. Dehybridization and rehybridization experiments with a different probe were carried out for some blots in order to verify the uniformity of the four blots. Autoradiography was performed at -80°C with an intensifying screen. Densitometric analysis Autoradiograms were densitometrically scanned using a light boxphotomultiplier system connected with a personal computer (IBM) and analyzed using image analysis software from Imaging Research Inc. (St Catarines, Canada). The linear range of hybridization signals was defined for each probe by separate experiments. The signals obtained for superior
3615
S.Beckh et al. colliculus at P1 -P7 with the sodium channel II- and HI-specific probes were above the linear range. Only the major hybridizing band was evaluated from signals obtained with the sodium channel II- and III-specific probes. The sizes of hyridizing RNAs are: sodium channel I, - 9000 nucleotides; sodium channel H, - 9500 (major) and - 8600 nucleotides; sodium channel III, - 9000 (major) and - 7500 nucleotides (see also Suzuki et al., 1988). The sizes of RNAs hybridizing with the common probe are - 9000-9500 nuleotides in all regions and additionally - 10 000 nucleotides in spinal cord at EIO-EI5.
Schmidt,J., Rossie,S. and Catterall,W.A. (1985) Proc. Natl. Acad. Sci. USA, 82, 4847-4851. Stuihmer,W., Methfessel,C., Sakmann,B., Noda,M. and Numa,S. (1987) Eur. Biophys. J., 14, 131-138. Stuihmer,W., Conti,F., Suzuki,H., Wang,X., Noda,M., Yahagi,N., Kubo,H. and Numa,S. (1989) Nature, 339, 597-603. Suzuki,H., Beckh,S., Kubo,H., Yahagi,N., Ishida,H., Kayano,T., Noda,M. and Numa,S. (1988) FEBS Lett., 228, 195-200. Wollner,D.A., Scheinman,R. and Catterall,W.A. (1988) Neuron, 1,
Acknowledaements
Zeller,N.K., Hunkeller,M.J., Campagnoni,A.T., Sprague,J. and Lazzarini,R.A. (1984) Proc. Natl. Acad. Sci. USA, 81, 18-22.
The help of Drs Hiroyuki Ishida and Toshiaki Kayano is gratefully acknowledged. We thank Drs Yoheved Berwald-Netter, Frances Edwards and George Augustine for reading the manuscript and Drs Erwin Neher and Bert Sakmann for generous support during the later phase of this investigation. This work was supported in part by research grants from the Ministry of Education, Science and Culture and the Science and Technology Agency of Japan and by fellowships from the Japan Society for the Promotion of Science and the Feodor Lynen Program of the Alexander von Humboldt Foundation (S.B.).
Received on July 25, 1989; revised on September 4, 1989
727-737.
References Altman,J. (1982) Exp. Brain Res. Suppl., 6, 8-49. Altman,J. and Bayer,S.A. (1981) J. Comp. Neurol., 198, 677-716. Altman,J. and Bayer,S.A. (1984) Adv. Anat. Embryol. Cell Biol., 85, 1-164. Angelides,K.J., Elmer,L.W., Loftus,D. and Elson,E. (1988) J. Cell Biol., 106, 1911-1925. Auld,V.J., Goldin,A.L., Krafte,D.S., Marshall,J., Dunn,J.M., Catterall,W.A., Lester,H.A., Davidson,N. and Dunn,R.J. (1988) Neuron, 1, 449-461. Barres,B.A., Chun,L.L.Y. and Corey,D.P. (1989) Neuron, 2, 1375-1388. Berwald-Netter,Y., Martin-Moutot,N., Koulakoff,A. and Couraud,F. (1981) Proc. Natl. Acad. Sci. USA, 78, 1245-1249. Boudier,J.A., Berwald-Netter,Y., Dellmann,H.D., Boudier,J.L., Couraud,F., Koulakoff,A. and Cau,P. (1985) Dev. Brain Res., 20, 137-142. Chirgwin,J.M., Przybyla,A.E., MacDonald,R.J. and Rutter,W.J. (1979) Biochemistry, 18, 5294-5299. Couraud,F., Martin-Moutot,N., Koulakoff,A. and Berwald-Netter,Y. (1986) J. Neurosci., 6, 192-198. Cowan,W.M., Fawcett,J.W., O'Leary,D.D.M. and Stanfield,B.B. (1984) Science, 225, 1258-1265. Gahwiler,B.H. and Llano,I. (1989) J. Physiol., 417, 105-122. Gordon,D., Merrick,D., Auld,V., Dunn,R. Goldin,A.L., Davidson,N. and Catterall,W.A. (1987) Proc. Natl. Acad. Sci. USA, 84, 8682-8686. Gruol,D.L. and Franklin,C.L. (1987) J. Neurosci., 7, 1271-1293. Hille,B. (1984) Ionic Channels of Excitable Membranes. Sinauer, Sunderland, Massachusetts. Holmes,E., Hermanson,G., Cole,R. and de Vellis,J. (1988) J. Neurosci. Res., 19, 389-396. Huguenard,J.R., Hamill,O.P., and Prince,D.A. (1988) J. Neurophysiol., 59, 778-795. Kayano,T., Noda,M., Flockerzi,V., Takahashi,H. and Numa,S. (1988) FEBS Lett., 228, 187-194. Koulakoff,A., Bizzini,B. and Berwald-Netter,Y. (1982) Dev. Brain Res., 5, 139-147. Llinas,R.R. (1988) Science, 242, 1654-1664. Lombet,A., Kazazoglou,T., Delpont,E., Renaud,J.F. and Lazdunski,M. (1983) Biochem. Biophys. Res. Commun., 110, 894-901. Maniatis,T. Fritsch,E.F. and Sambrook,J. (1982) Molecular Cloning. A Laboratory Manual. Cold Spring Harbor Laboratory Press, Cold Spring Harbor, NY, p. 206. Martin-Moutot,N., Cau,P., Berwald-Netter,Y. and Couraud,F. (1987) Dev. Brain Res., 32, 43-51. Mourre,C. Cervera,P. and Lazdunski,M. (1987) Brain Res., 417, 21-32. Noda,M., Ikeda,T., Kayano,T., Suzuki,H., Takeshima,H., Kurasaki,M., Takahashi,H. and Numa,S. (1986a) Nature, 320, 188-192. Noda,M., Ikeda,T., Suzuki,H., Takeshima,H., Takahashi,T., Kuno,M. and Numa,S. (1986b) Nature, 322, 826-828. Nowak,L., Ascher,P. and Berwald-Netter,Y. (1987) J. Neurosci., 7, 101-109. Peters,A. and Vaughn,J.E. (1970) In Davison,A.N. and Peters,A. (eds), Myelination. Thomas, Springfield, IL, pp. 2-79.
3616