is recovered automatically without new hardware overhead. Our simulation shows that dynamic value specialization in the trace cache achieves a 17% speedup ...
Dynamic Code Value Specialization Using the Trace Cache Fill Unit Weifeng Zhang
Steve Checkoway
Brad Calder
Dean M. Tullsen
Department of Computer Science and Engineering University of California, San Diego
Abstract— Value specialization is a technique which can improve a program’s performance when its code frequently takes the same values. In this paper, speculative value specialization is applied dynamically by utilizing the trace cache hardware. We implement a small, efficient hardware profiler to identify loads that have semi-invariant runtime values. A specialization engine off the program’s critical path generates highly optimized traces using these values, which reside in the trace cache. Specialized traces are dynamically verified during execution, and mis-specialization is recovered automatically without new hardware overhead. Our simulation shows that dynamic value specialization in the trace cache achieves a 17% speedup, even over a system with support for hardware value prediction. When combined with other techniques aimed at tolerating memory latencies, this technique still performs well – this technique combined with an aggressive hardware prefetcher achieves 24% better performance than prefetching alone.
I. I NTRODUCTION Value prediction breaks true data dependence chains by directly predicting load values [1], [2], [3], [4], taking advantage of value locality. The benefit of value prediction comes from reducing the program’s critical dependence path of execution, particularly when loads that miss in the cache are part of the dependence chain. However, hardware value prediction requires extensive hardware support. Additionally, a missed opportunity for value prediction techniques is that they immediately lose the knowledge of a known value as soon as the targeted instruction is predicted, even if that knowledge could lead to further optimization or simplification. Another optimization that exploits value locality is static software value specialization. In this case, the code is specialized to particular values, often allowing the code to be simplified and accelerated significantly. However, static value specialization does not handle values that are only known at runtime, or which change slowly over time. This paper presents a technique that dynamically specializes the code for semi-invariant load values detected at runtime. The specialized code exists only in the trace cache [5], [6], [7], [8], [9], with traces constructed and specialized by the trace cache fill unit. The trace cache is an existing mechanism to store a program’s dynamic instruction sequences, called execution traces. Since each trace may contain multiple non-contiguous basic blocks, speculative value specialization allows compiler-like optimizations to be applied to semiinvariant runtime values beyond basic blocks.
This technique significantly outperforms hardware value prediction, because the assumption that a register takes a constant value can be propagated through the trace, often resulting in dead code elimination or strength reduction. It outperforms static specialization because it is a hardwarebased dynamic technique, which can adapt quickly to runtime values, and even infrequent changes in those runtime values. We rely on hardware support to detect semi-invariant loads, but we track very few loads at a time, so the hardware overhead is relatively small. This technique can also recover quickly from mispredictions with minimal changes to existing hardware support for mis-speculation recovery. Our study uses a hardware value profiler to dynamically capture the load instruction’s invariant or semi-invariant values during a program’s execution. Traces are then optimized with candidate load values, by performing constant propagation, copy propagation, and dead move (code) elimination. We implement a trace cache in which both a non-specialized trace and a value specialized trace for the same path may co-exist. We use a trace confidence scheme to determine whether to use the specialized trace or the non-specialized trace during fetch. For a specialized trace, we store with it the predicted values used to perform the specialization. There are two primary benefits to incorporating the value prediction and the specialization of traces in the trace cache. First, it simplifies the implementation of value prediction in several ways: (1) prediction decisions are made much less frequently and are performed in the back end of the pipeline, and (2) the latency requirements for tracking and acting on load value locality are severely relaxed. The other primary benefit of applying this optimization in the trace cache is that it allows further optimization through propagating these values through the trace. Many of the specific specializations we perform will provide a benefit anywhere value locality is detected. For this study, however, we only predict loads, which provides the greatest benefits, and limits the size and complexity of the structures needed to collect the profiles. The main contributions of this paper are: • We proposes a speculative value specialization architecture, which explores new opportunities (semi-invariant values) for continuous optimization in the backend of the pipeline. • We proposes a two-level confidence scheme to improve the value specialization accuracy. It allows the non-
specialized trace to co-exist with its corresponding specialized trace. This enables us to quickly switch back to the non-specialized trace, when there are specialized traces whose specialized values later change during execution. • We demonstrate that speculative value specialization is beneficial, even for the short traces stored in the trace cache. The rest of the paper is organized as follows. Section II describes prior related research. Section III describes the value specialization architecture. Section IV gives details of the simulation. Section V shows the value specialization results. Section VI summarizes this paper. II. R ELATED W ORK This section summarizes prior research on trace cache optimization and value specialization. A. Trace Cache Optimizations Friendly, et al. [10] are the first to perform trace optimizations via the trace cache fill unit. Their basic optimizations include constant propagation, register re-association, and scaled addition. They also propose to mark the register move instruction as an explicit move so that it can be eliminated during register renaming without further execution. Jacobson and Smith [11] propose three specific optimization techniques based on the trace processor. One of these optimizations is to collapse a small chain of dependent instructions into a single operation using a new instruction not available to the external ISA. Our work extends the fill-unit optimization architecture by identifying new optimization opportunities – specialization to semi-invariant load values. By specializing traces with semiinvariant load values, we are able to hide the load latency and break the instruction dependence chain at the same time. The recent rePlay [12], [13], [14] and PARROT [15], [16] frameworks enable very aggressive hardware optimizations, by using a dynamically configurable optimization engine running in parallel with a high performance execution core. The key idea in these frameworks is the atomic execution of traces. Control dependencies are speculatively converted to form long atomic traces upon which very aggressive code elimination can be applied. These architectures have potential to specialize traces based on their live-in values, but have not exploited this. Continuous hardware optimization, recently proposed by Fahs, et al [17], augments the renaming stage of the processor pipeline with a dataflow optimizer. The in-pipeline optimizer uses simple, table-based hardware to reduce the instruction dataflow height by performing basic optimizations. By exploiting execution results fed back from the execution stage, the optimizer can potentially evaluate instructions without further executing them in the later pipeline stages. Our optimization architecture performs optimizations offline, thus having less impact on the microarchitectural timing. We also exploit semiinvariant runtime constants, which are not handled in their architecture.
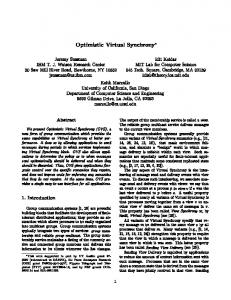
B. Value Specialization Value specialization [18], [19], [20] is typically done by the compiler in a very conservative manner. Specialization is mainly applied at the procedural level. Mock, et al. [21] develop a selective dynamic compilation system (DyC) to optimize the code at run-time. A small portion of code is selected and annotated by the compiler so that it can be optimized according to runtime values. Wu, et al. [22] exploit runtime value locality to reuse computation within statically-identified code regions. Fu, et al. [20] examine code specialization by statically scheduling load-dependent instructions ahead of loads. These instructions can then be executed based on hardware speculated values. Zhang, et al. [23] designed a dynamic value specialization framework, called Trident, on a multithreaded architecture. Execution traces are collected and optimized (using speculative load values) by the optimizer, which runs as a helper thread, and are stored in a memory buffer. Trident explicitly inserts software checks in the trace to verify load values and recover from mis-specialization. Shankar, et al. [24] explore runtime specialization under the Jikes RVM. Runtime constants are identified by profiling heap object locations. However, software value specialization systems often suffer the overhead of dynamic value verification (extra instructions inserted in the trace) and the overhead of dispatching the specialized traces (branching in and out of the value specialized code). They also need to invalidate cache lines when the mis-specialized code is invalidated. Our technique avoids the above overhead as well as the cache side effects. In addition, our research focuses on the challenges and the potential of speculative value specialization on the short traces found in the hardware trace cache. Value profiling has been studied to guide static and dynamic optimization. Calder, et al. [18] use Top-N-Value tables (TNV) for fast and low overhead instruction profiling. Muth, et al. [19] generalize the notion of value profiles to expression profiles, which profile the runtime values of arbitrary expressions. The expression profiles allow more aggressive optimizations, which may not be possible from simple value profiles. The hardware value profiler used in this study is based on [18], [23]. The value confidence scheme is used to select and replace values from the profiler. III. VALUE S PECIALIZATION A RCHITECTURE This section describes our value specialization architecture, which includes a backend value profiler to detect value biases, a specialization engine to optimize traces, and a trace cache to store execution traces. Our design models a Pentium 4-like architecture, in which the conventional instruction cache is absent; however, optimizations we demonstrate would apply similarly if there was a traditional instruction cache backing the trace cache. The architecture is shown in Figure 1. The following sections describe these components in more details.
unified L2
trace cache fetch
D-cache L1
fill unit trace specialization engine
line buffer
value profiler
Execution Engine Fig. 1.
commit
The Value Specialization Architecture
A. Load Value Profiling This architecture uses a hardware value profiler to identify loads with semi-invariant behavior and their common values. The profiler sits on the backend of the pipeline, and can identify the top N values of each load instruction. We adapt the software value profiler from [18] for an efficient hardware implementation. The profiler is organized as a set-associative cache, which has the following format in each of its entries: tag
usage counter
pairs (e.g. six pairs)
Here, the usage counter and confidence counters are up and down saturating counters. The confidence scheme used in this paper is represented by a tuple . When a load is committed, the confidence counter whose associated value is the same as the load’s committed value is increased by the bonus (e.g., 1), and all other confidence counters are decremented by the penalty (e.g., 7). If the incoming value is new, the existing value that has the lowest confidence is replaced. When a value’s confidence counter saturates, it is confident, and can be used for specialization. Once a load starts being used for value specialization within a trace, its usage counter is incremented if the specialization is correct. Otherwise, it is decremented. When a new load is profiled, the profiler entry with the lowest usage counter is replaced by the new load. Thus, usage counters are used to keep good loads in the profiler. This is an improvement over a similar profiler implementation [23], in which LRU replacement is used. During profiling, all committed loads are buffered into a small FIFO (e.g. size 8) before inserting them into the profiler. When the queue is full, the oldest loads are replaced if they haven’t been consumed by the profiler. We found the performance is not very sensitive to the queue size. This is reasonable since recurring loads will have the opportunity to be profiled eventually. B. Trace Cache In this architecture, instructions are primarily fetched from the trace cache. On a trace cache hit, the whole trace line is fetched in one cycle. Otherwise, a slow fetch takes place. That is, instructions are fetched from the L2 cache, up to the maximum number allowed by the fetch bandwidth or up to a
taken branch. The trace cache miss triggers the linefill buffer to start collecting the committed instructions to form a new trace at the missing address. A trace may contain up to 16 instructions or three basic blocks [10]. 1) Trace Specialization in the Trace Cache: Each trace has a trace ID to identify the next trace to be fetched from the trace cache [6], [7]. In order to store value specialized traces without introducing additional storage (and complexity), we augment the trace cache so that each cache entry has the following format: Trace ID
s-flag
confidence (e.g. 2-bit)
instructions (up to 16)
N predicted values
Here, the 1-bit s-flag indicates if the trace is value specialized (s-trace) or non-specialized (n-trace). The 2-bit trace confidence is explained in the next section. We also store the predicted values for the specialized loads. For the results in this paper, we allow up to N specialized values (s-values) per trace, and we find N=4 is sufficient. To identify which load a s-value belongs to, each instruction in the trace is augmented with a single bit to indicate if it is a load that is used during specialization. Thus, s-values are stored in the same order as their load instructions occur in the trace. Alternatively, s-values can be stored in an auxiliary structure matching the mapping of the trace cache. For each n-trace, there exists at most one corresponding strace. A newly created s-trace always overwrites the old one. Since we also store s-traces in the trace cache, the trace cache can hold both the s-trace and the n-trace for the same block (as long as both traces are used often enough to avoid eviction). Both traces share the same trace ID. When the trace cache gets a hit for two valid blocks in its set with the same ID, we will use the trace confidence scheme to decide which trace to execute, as discussed in the next section. After an s-trace is fetched for execution, the s-values from the trace are copied to the physical registers allocated at the renaming stage. This allows any dependencies on this register to be speculatively executed, just as in value prediction. When a specialized load reaches the writeback stage, it has to wait until its true load value comes back from the lower memory hierarchy. Upon the arrival of the true load value, the s-value is verified against the true value. If the s-value is correct, the speculative load is ready to commit. If instead the s-value is found to be incorrect, misspecialization is triggered. All instructions after the specialized load are squashed, and execution starts right after the s-load instruction that was value mispredicted. 2) Trace Confidence: The trace cache uses the same replacement policy to manage s-traces and n-traces. However, an s-trace can also be invalidated if its confidence is too low. We use a confidence mechanism to decide if an s-trace or n-trace is to be used when finding both in the trace cache, and to avoid s-trace blocks with poor confidence. There are two reasons that trace-level confidence is necessary, even though all specialized loads are highly confident at trace creation. First, the cumulative effect of multiple stable loads may still
Original Trace 1 LDQU 2 EXTQH 3 SRA 4 S4ADDQ 5 LDL 6 ...
R4, R4, R0, R0, R0,
0(R9) R0, R0 56, R0 R5, R0 0(R0)
Specialized Trace 1 LDQU R4, 0(R9) ; ; ; 5 LDL R0, 0(R5) 6 ...
TABLE I A
VALUE SPECIALIZATION EXAMPLE FROM
parser.
create a trace with low confidence. Second, trace accuracy can degrade over time as value biases change. The confidence counter is a saturating up and down counter, incrementing the value when all speculated values are correct, and decrementing the counter if there is at least one incorrectly speculated load value. An s-trace is set to the maximum value upon insertion into the trace cache. When the confidence counter drops below the confidence threshold, then the s-trace is marked as invalid and will be used next for replacement. C. Fill Unit Value Specialization We now describe how we extend the trace cache fill unit to create specialized value traces, starting with a real code example. 1) A Value Specialization Example: We show a value specialization example from parser in Table I. The left side of the table is a portion of the instruction trace from the function match in parse.c. The value specialized trace is shown in the right side of the table. The load in line 1 produces zero with very high accuracy. Constant propagation is performed with the constant zero, followed by copy propagation and then dead move elimination. Dead move elimination is only performed if the register is redefined (we can prove that it is dead) in the same trace we are forming. Therefore, instructions 2 - 4 can then be eliminated because their destination register R0 is redefined in the same basic block. After the specialization, the serial dependencies in the original instructions 1 - 5 are removed. In fact, we’ve decreased instruction overhead, increased ILP, and increased memory level parallelism (load 5 can now be executed in parallel with the load in line 1). 2) Trace specialization implementation: When a new trace is being constructed in the fill unit, it is initially created as an n-trace, with no specialization. Later, when a trace line is fetched to the core execution engine, it may also be forwarded to a trace specialization engine for potential optimization if it has not yet been specialized. The optimization engine takes the following steps to construct a specialized trace (s-trace): (1) Scan the instructions in the trace to identify any load whose confidence counter is above a given predictability threshold. This indicates that the load has a semi-invariant, predictable value. If none of the loads do, the trace is not specialized. (2) If one or more semi-invariant loads exist, the engine constructs a def-use chain on the trace. Values from these loads are then propagated using the dependence chain. Instructions are strength reduced, if possible, and any new constants generated
during the propagation are further propagated. (3) After the copy propagation is done, a MOV instruction may be removed if its destination register is redefined inside the same basic block of the trace. (4) After the specialization is finished, all counters and flags are set properly inside the s-trace. Then the trace is inserted into the trace cache. The trace specialization steps above are similar to [23], except our approach does not have to insert software checks to verify predicted values. Since trace specialization only performs linear scanning and optimization on the short trace (16 instructions or less), we expect the implementation of the value specialization engine to be relatively simple, e.g., with patternmatching state machines. The engine can be implemented using hardwired logic or even slow programmable logic, since we found that the performance is not very sensitive to the trace specialization delay, as in [10]. In this study, we assume a conservative delay of 1000 cycles from the specialization engine. At the same time, we found that adding a queue to the specialization engine to buffer any incoming traces has very little performance improvement. Therefore, we only allow one trace to be specialized at any time. A non-specialized trace will not be forwarded to the specialization engine unless it is idle. IV. M ETHODOLOGY We model the baseline architecture as a 20-stage Pentium 4like superscalar architecture with no L1 instruction cache. We heavily modified the SimpleScalar 3.0 tool set [25] to include memory hierarchy timing and add the value specialization support. We implement the baseline trace cache fill unit with optimizations proposed in [10]: constant propagation, reassociation, and MOVE elimination at the renaming stage. A trace can hold up to 16 instructions or three basic blocks. The trace specialization engine is modeled with the conservative assumption that it takes 1000 cycles to finish the specialization, and the fill unit is unavailable for other optimization during this time. More careful modeling of this unit was found to be unnecessary, because even this very conservative assumption was found to have little impact on performance. Table II (top portion) shows the configuration of our baseline architecture. We also implement an efficient hardware value profiler whose base configuration is shown in the bottom portion of table II. The profiler is indexed by the load PC. The replacement policy is described in section III-A. Loads are continuously profiled throughout the program’s execution. Our architecture is evaluated using SPEC2000 integer benchmarks. Each program is simulated for 100 million instructions starting at the early single simulation points from SimPoint [26]. V. R ESULTS In this section, we evaluate the performance of the value specialization architecture, and compare the results with related techniques, conventional value prediction, and data prefetching. All performances are compared against the baseline Trace Cache architecture (which includes a trace cache,
256-set,4-way associative; latency 1 cyc; Confidence 2-bit; s-flag 1-bit; 4 predicted values 256-set,4-way associative,32KB;latency 1 cyc 2 MBytes, latency 15 cyc latency 300 cyc ROB size 64, load queue size 16 fetch, decode, issue bandwidth 4 2-level, 2K entry meta-chooser; RAS size 16 BTB 512 entry 4-way associative 256-set,4-way associative; Per entry: usage 6-bit, 6 pairs(confidence 5-bit)
L1 D-cache Unified L2 Memory Processor core Branch predictor Value profiler
percent speedups
Trace cache
Fig. 3. Performance of value specialization with different trace and value confidence thresholds
TABLE II
2.5 2 1.5 1 0.5
vp r
tw ol f vo rte x
pe rl
m cf pa rs er
gz ip
gc c
ga p
eo n
cr
af ty
0 bz ip
instructions per cycle
V-confidence 7 V-confidence 15 V-confidence 31
T-confidence 0 T-confidence 1 T-confidence 2 T-confidence 3
T HE BASELINE ARCHITECTURE CONFIGURATION
Fig. 2.
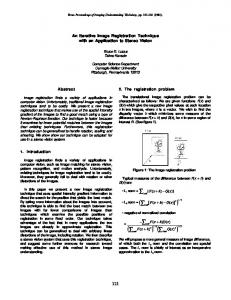
30% 25% 20% 15% 10% 5% 0%
The performance of the baseline architecture
and several previously proposed trace cache fill unit optimizations), as shown in Figure 2. To gauge the performance potential from our value specialization architecture, we first assume that the size of the value profiler is unlimited. This allows us to profile all load instructions. From section V-C onward we will evaluate how the size of the profiler affects the specialization performance.
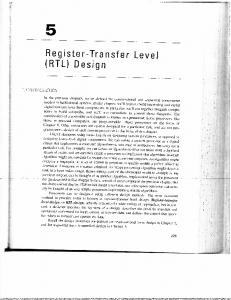
in this figure, higher value confidence thresholds are important if the same specialized trace is fetched over and over again. Significant performance degradation may occur because the mis-specialized traces could be fetched many times. We could improve the average performance from 2% to 12% if we increase the value confidence threshold from 7 to 31. However, as we increase the trace confidence threshold, high value confidences still boost performance, but become less critical. As we reach the highest trace confidence threshold of 3, the value confidence is completely shadowed. As a matter of fact, value confidence 7 achieves slightly higher performance than 31. This is because, (1) at this trace confidence level, a mis-specialized trace will never be used. So only correctly specialized traces will be fetched many times, and trace specialization accuracy is dramatically improved. (2) lower value confidence thresholds may expose more loads to be predictable, even if the values are semi-invariant during a short period of time. We will use the trace confidence threshold of 3 and the value confidence threshold of 7 for the remaining performance evaluations.
A. Value Confidence and Trace Confidence We evaluate the performance of value specialization with a two-level confidence scheme: value confidence and trace confidence. Value confidence is used in the creation of specialized traces, and trace confidence is used to select traces for execution. We evaluate the value confidence tuple in section III-A with these three configurations: , , and . The first number is both the maximum value of the confidence counter and the confidence threshold to be considered as predictable for that value entry. A value’s confidence is incremented (decremented) by the bonus (penalty) if the same (different) value occurs during profiling. Only loads with a confidence counter equal to the threshold are candidates for value specialization. The trace confidence is a 2-bit saturating counter with initial value of 3. It is decremented if the trace is specialized incorrectly. Otherwise, it is incremented. A specialized trace with a confidence below the threshold is not selected for fetch. In fact, it is also marked as invalid in the trace cache for future replacement. Figure 3 shows the average speedups for different value and trace confidence thresholds, over a system with the baseline trace cache, but no value specialization. In the first bar group, we use trace confidence 0 to indicate that a specialized trace will never be invalidated due to miss-peculation. As we can see
B. Comparison of Value Prediction with Value Specialization The techniques proposed in this paper benefit from two factors – value prediction and value specialization. In the following experiment, we attempt to separate these two effects by comparing our solution with value prediction alone. Figure 4 shows these results. The value predictor we implemented in this study is the hybrid model [2]. The predictor has a value history table (VHT) of 4K entries, a pattern history table (PHT) of 32K entries. PHT counters saturate at 32 with the threshold of 12. The first bar shows the speedups if we only apply hardware value prediction – the code dependent on the load is decoupled from the load, but the value is not propagated further into the trace. The second bar gives the performance gain using our full value specialization, which includes our hardwareprofiler-based value prediction, constant propagation, register re-association, and code elimination. Our value specialization significantly outperforms the value predictor by 17% on average. The performance improvement is most significant with bzip, gap, gzip, parser, and vpr. This is mainly due to two reasons. First, our two-level confidence scheme tends to improve the overall trace quality by replacing traces/loads which do not behave well. Second, our value specialization allows the propagation of know values, to enable further optimizations. In this case, we end up benefiting from what amounts to
40%
to increase the size of the data cache or trace cache. If we do this, experiments show that we would only experience a performance improvement of 2.8% (large data cache) or 1.7% (large trace cache). Thus, our dynamic value specialization architecture is a more effective use of this hardware for these benchmarks.
20%
D. Value Specialization and Hardware Prefetching
H/W value prediction
100%
percent speedups
Value specialization 80%
60%
0% bzip
Fig. 4.
crafty
eon
gap
gcc
gzip
mcf parser perl
vpr
avg
Performance of value prediction and value specialization Profiler 64 X 2 Profiler 256 X 2 Profiler - unlimited
100% percent speedups
twolf vortex
80% 60% 40% 20%
vp r av g
af ty eo n ga p gc c gz ip m c pa f rs er pe rl tw ol f vo rte x
cr
bz ip
0%
Fig. 5. the performance of profiler sizes 128-entry, 512-entry, and unlimited
a very conservative use of predicted values, with resulting high accuracy. Thus, any time value locality has enough evidence to make value prediction useful, value specialization significantly enhances its effectiveness. A similar effect is also noted in [23], where we do a different form of dynamic value specialization under very different architectural assumptions. C. Sensitivity to Value Profiler Size Results up to this point have assumed unlimited resources to track load values. The following results examine more realistic profiler configurations. In our simulations, crafty, vortex, parser, perl, and gcc have a relatively large number of static loads. With the limited profiler size, a profiler replacement policy is needed to reclaim space used by loads that may have not exhibited significant locality. We use the replacement policy via the load’s usage counter as described in Section IIIA. Figure 5 compares the value specialization performance with different profiler sizes: 64-set 2-way associative (64X2), 256-set 2-way associative (256X2), and the unlimited size. We do see some performance drop with the smaller predictor sizes however, for the most part, performance improvements are relatively insensitive to the size of the predictor, within these ranges. This is because our replacement policy attempts to keep good loads, which most often result in correct value specialization, in the profiler. In this study, the value profiler (256X2 configuration) uses total hardware resource of about 32KB. This calculation also includes the resources used to augment the trace cache. Instead of using these resources for our proposed architecture, we could instead dedicate these resources elsewhere; for example,
This research focuses on loads, as performance in modern systems is often dominated by memory latencies. However, these techniques represent just one approach to hide or remove the latency of long-latency loads. Thus, we would like to know whether these gains are complementary to, or subsumed by, existing memory latency optimizations. Most modern processors now include some form of hardware data prefetching; this section compares our technique with an aggressive memory prefetcher, and demonstrates that for most programs they are actually complementary techniques. Prefetching speedup depends on how accurately the prefetching addresses are predicted, and how far the prefetching can be done ahead of the main execution thread. However, prefetching does have the potential to increase the memory bus contention. In this section, we implement an aggressive predictorbased stream prefetching scheme [27]. The stream buffers are configured with a predictor table of 256 entries, and the Markov predictor of 2048 entries. There are a total of 8 stream buffers, each of which can hold 8 blocks. Figure 6 shows the performance of value specialization with and without hardware prefetching. The first bar gives the performance of hardware prefetching alone. Our value specialization alone (the second bar) outperforms hardware prefetching by 13%. However, when combining value specialization with hardware prefetching, we might expect some of the value specialization benefits will disappear. This is because if the load used for specialization now hits in the cache due to prefetching, there is less to be gained from specialization, and more potentially lost when there is a misspeculation. This seems to be true for perl, twolf, and vpr. But for all other benchmarks, the combination seems to be constructive. Overall, the combination achieves 24% better performance than hardware prefetching alone. In particular, the combination consistently outperforms the prefetching alone. This demonstrates that our value specialization technique is still effective even in the presence of hardware prefetching. VI. C ONCLUSION This paper demonstrates a dynamic code specialization technique, which exploits value locality in the trace cache. Value locality is detected with an efficient backend profiler that identifies invariant or semi-invariant runtime behavior. This information is used to drive a value specialization engine, which constructs optimized traces to be placed in the trace cache. We examine a trace cache architecture that allows the storing of a trace block in both a non-specialized and value specialized form. These specialized traces not only identify opportunities for value prediction, but also specializes
Stream prefetching Value specialization VS + Stream prefetching
percent speedups
150% 120% 90% 60% 30%
Fig. 6.
vp r av g
gc c gz ip m c pa f rs er pe rl tw ol f vo rte x
af ty eo n ga p
cr
bz ip
0%
Performance of value specialization with hardware prefetching
based on the particular values profiled. We show significant additional speedup from the specialization over the value prediction alone, particularly in those cases where prediction itself is effective. This gain over prediction alone is because we can propagate the information about the assumed load value throughout the trace cache line. The specialization optimizations examined include constant propagation, value propagation, dead move elimination, and reduction of complex instructions. We restrict our focus to transformations identified through simple trace analysis, but other optimizations would be possible with more hardware devoted to the dynamic specializer. Overall, we show an average 29% speedup over a conventional trace cache architecture. Value specialization achieves 17% speedup relative to hardware value prediction. This gain comes from decoupling load uses from long-latency loads, covering cache misses with value specialization, and in general reducing the length of dependence chains. Speculative value specialization has been shown to be a promising technique for tolerating memory latencies and extending the benefit of value locality further down the dependence chain. It does so even in the presence of aggressive hardware prefetching. ACKNOWLEDGMENTS The authors would like to thank the anonymous reviewers for their helpful insights. This research was supported in part by NSF grant CCF-0541434, and grants from Microsoft and Intel. R EFERENCES [1] M. Lipasti, C. Wilkerson, and J. Shen, “Value locality and load value prediction,” in Eighth International Conference on Architectural Support for Programming Languages and Operating Systems, Oct. 1996. [2] K. Wang and M. Franklin, “Highly accurate data value prediction using hybrid predictors,” in 30th International Symposium on Microarchitecture, Dec. 1997. [3] H. Zhou, J. Flanagan, and T. Conte, “Detecting global stride locality in value stream,” in Annual International Symposium on Computer Architecture, 2003. [4] B. Calder, G. Reinman, and D. Tullsen, “Selective value prediction,” in 26th Annual International Symposium on Computer Architecture, May 1999. [5] A. Peleg and U. Weiser, “Dynamic flow instruction cache memory organized around trace segments independent of virtual address line,” in U.S. Patent 5,381,533, January 1995.
[6] E. Rotenberg, S. Bennett, and J. Smith, “Trace cache: a low latency approach to high bandwidth instruction fetching,” in 29th International Symposium on Microarchitecture, December 1996. [7] S. Patel, D. Friendly, and Y. Patt, “Critical issues regarding the trace cache fetch mechanism,” in University of Michigan Technical Report CSE–TR-335-97, May 1997. [8] R. Nair and M. Hopkins, “Exploring instruction level parallelism in processors by caching scheduled groups,” in 24th Annual International Symposium on Computer Architecture, 1997. [9] G. Hinton, D. Sager, M. Upton, D. Boggs, D. Carmean, A. Kyker, and P. Roussel, “The microarchitecture of the pentium(r) 4 processor,” in Intel Technology Journal, 2001. [10] D. Friendly, S. Patel, and Y. Patt, “Putting the fill unit to work: Dynamic optimizations for trace cache microprocessor,” in 31st International Symposium on Microarchitecture, 1998. [11] Q. Jacobson and J. Smith, “Instruction pre-processing in trace processors,” in Proceedings of the Fifth International Symposium on HighPerformance Computer Architecture, 1999. [12] S. Patel and S. Lumetta, “rePlay: A Hardware Framework for Dynamic Optimization,” in IEEE transactions on computers, Vol 50, No. 6, June 2001. [13] B. Fahs, S. Bose, M. Crum, B. Slechta, F. Spadini, T. Tung, S. Patel, and S. Lumetta, “Performance characterization of a hardware mechanism for dynamic optimization,” in 34th International Symposium on Microarchitecture, 2001. [14] B. Slechta, D. Crowe, B. Fahs, M. Fertig, G. Muthler, J. Quek, F. Spadini, S. Patel, and S. Lumetta, “Dynamic optimization of microoperations,” in Proceedings of the Nineth International Symposium on High-Performance Computer Architecture, Feb. 2003. [15] Y. Almog, R. Rosner, N. Schwartz, and A. Schmorak, “Specialized dynamic optimizations for high performance energy-efficient microarchitecture,” in International Symposium on Code Generation and Optimization, March 2004. [16] R. Rosner, Y. Almog, M. Moffie, N. Schwartz, and A. Mendelson, “Power awareness through selective dynamically optimized traces,” in 31th Annual International Symposium on Computer Architecture, June 2004. [17] B. Fahs, T. Rafacz, S. Patel, and S. Lumetta, “Continuous optimization,” in 32th Annual International Symposium on Computer Architecture, 2005. [18] B. Calder, P. Feller, and A. Eustace, “Value profiling and optimization,” Journal of Instruction Level Parallelism, vol. 1, Mar. 1999, (http://www.jilp.org/vol1). [19] R. Muth, S. A. Watterson, and S. K. Debray, “Code specialization based on value profiles,” in 7th International Static Analysis Symposium, June 2000. [20] C. Fu, M. Jennings, S. Larin, and T. Conte, “Value speculation scheduling for high performance processors,” in Eighth International Conference on Architectural Support for Programming Languages and Operating Systems, October 1998. [21] M. Mock, C. Chambers, and S. Eggers, “DyC: an expressive annotationdirected dynamic compiler for C,” in 33rd International Symposium on Microarchitecture, 2000. [22] Y. Wu, D. Chen, and J. Fang, “Better exploration of region-level value locality with integrated computation reuse and value prediction,” Annual International Symposium on Computer Architecture, 2001. [23] W. Zhang, B. Calder, and D. Tullsen, “An event-driven multithreaded dynamic optimization framework,” in International Conference on Parallel Architectures and Compilation Techniques, September 2005. [24] A. Shankar, S. Sastry, R. Bodik, and J. E. Smith, “Runtime specialization with optimistic heap analysis,” in Proceedings of the ACM Conference on Object-Oriented Programming Systems, Languages and Applications, October 2005. [25] D. C. Burger and T. M. Austin, “The simplescalar tool set, version 2.0,” University of Wisconsin, Madison, Technical Report CS-TR-97-1342, June 1997. [26] T. Sherwood, E. Perelman, and B. Calder, “Basic block distribution analysis to find periodic behavior and simulation points in applications.” in International Conference on Parallel Architectures and Compilation Techniques, Sept. 2001. [27] T. Sherwood, S. Sair, and B. Calder, “Predictor-directed stream buffers,” in 33rd International Symposium on Microarchitecture, 2000.


![ModelSim Tutorial - UCSD CSE [PDF]](https://m.moam.info/img/260x300/modelsim-tutorial-ucsd-cse-pdf_64799306098a9e495b8b45ed.jpg)