Dynamic Coupling between Atrio-ventricular Duration and RR-interval Histogram Phase-rectification Analysis in Chronic Chagas Disease Paulo R Benchimol-Barbosa1,2, Olivasse Nasario-Junior1, Jurandir Nadal1, Roberto Coury Pedrosa1 Iprograma de Engenharia Biomedica, COPPE, Universidade Federal do Rio de Janeiro, RJ, Brasil 2Hospital UniversiUtrio Pedro Emesto, Universidade do Estado do Rio de Janeiro, RJ, Brasil
Abstract
stages of the disease [2]. Atrio-ventricular duration (AVD) tends to adapt to changes in heart rate (HR) directly [3]. Dynamic coupling between AVD and RR-interval relates to AV conduction facilitation, particularly influenced by the strength of the autonomic input [4]. Thus, the relationship between AVD and cardiac cycle length may be a valuable tool to assess adaptation to autonomic input. Recently, isolation of distinct autonomic contribution on HR has been feasible by assessing the capability of RR-intervals to accelerate (AC) or decelerate (DC), parasympathetic representing and sympathetic contributions, respectively [5, 6]. Additionally, separation of RR-intervals by histogram classes has demonstrated to be useful to compare different populations [7]. m a recent study, assessment of RR-interval in AC and DC in ChD groups added insights into the dependence of autonomic modulation on HR [8]. The objectives of the study were: i) To investigate dynamic AVD to RR interval coupling, stratified by RR histogram classes, in healthy and chronic ChD, and ii) To analyse AC and DC phases of RR-interval series, discriminating sympathetic and parasympathetic effects on AYD.
This study investigated dynamic atrio-ventricular duration (AVD) and phase-rectification-driven RR interval coupling to assess AV conduction facilitation in healthy and chronic Chagas disease (ChD) subjects. All subjects were in sinus rhythm and underwent 60 min head-up tilt table test under ECG recording. ChD group underwent MIBG scintigraphy and confirmed sympathetic denervation. Histogram of RR-interval series was calculated, with 100 ms class, ranging from 600 ms to 1200 ms. For each class, mean of normal RR-intervals (MRR) and mean of the peak-to-peak P-to-R wave interval (MPR), representing AVD, were analyzed in RR intervals pairs of acceleration (AC) and deceleration (DC) phases, reflecting sympathetic and parasympathetic influences on heart rate, respectively. Regression lines of MPR vs. MRR were computed in the whole series, and in DC and AC phases, and respective slopes calculated (sMPRT, sMPRDc and sMPRAc). Student t-test compared groups. MRR and MPR were larger in ChD group. In healthy subjects, sMPRT, sMPRDc and sMPRAc significantly increased as a function of MRR in all phases. In subjects with Chagas disease, however, PR interval increases only in DC phase, confirming loss of sympathetic driven RR-interval variation.
1.
Introduction
Materials and methods
2.1.
Study population
ECG signals were extracted from an eXlstmg high resolution ECG database [10]. The study protocol was approved by Ethics Committee and informed consent was obtained. A group of age and gender-adjusted 11 healthy sedentary participants [Control group, (mean age ± SD) 58.3 ± 13.l years] and 11 subjects with chronic ChD (Chagas group, 59.4 ± 12.3 years) were studied. Chronic ChD subjects were emolled to the study based on spontaneous demand and all underwent MIBG scintigraphy to assess cardiac sympathetic innervation. Due to the exploratory nature of the study, the number of participants was arbitrarily defmed and equally distributed between groups. The following criteria were met: (i) no intake of
Chagas disease (ChD) is a major cause of cardiomyopathy in Latin America. It has been estimated that that Trypanosoma Cruzi worldwide currently infects 8-11 million people, becoming a significant worldwide healthcare related problem due to migration [1]. Since myocardial damage is scattered throughout the heart in abnormalities electrocardiogram (ECG) ChD, (arrhythmias, conduction disturbances) reflects a widespread cardiac involvement [2]. A relevant pathophysiological aspect of chronic ChD is the abnormal atrio-ventricular (AV) conduction [9], commonly related to sustained supraventricular arrhythmia in different
ISSN 2325-8861
2.
513
Computing in Cardiology 2015; 42:513-516.
ranging from 600 ms to 1200 ms. For each histogram class, and respective to each RR-interval series, it was calculated mean (MRR) and standard deviation (SDRR) of consecutive normal RR-intervals, and mean (MPR) and standard deviation (SDPR) of consecutive normal PR intervals. Only pairs of consecutive normal RR and PR intervals for individual series that lied inside a particular class of the RR histogram were analysed together. For a particular histogram class (class) of the i'h series, containing N" class RR-intervals, the calculus of the mean (MXi, class) , standard deviation (SDx" class) of the normal RR and PR-intervals was performed as follows:
nutritional supplements or potential ergogenic aids of any type; (ii) non-smokers; (iii) normal blood pressure; (iv) non-diabetic; (v) no history of alcohol addiction; (vi) no history of thyroid dysfunction; and (vii) not taking medications that affect cardiac electrical properties and/or autonomic function. 2.2.
Signal
acquisition,
processing
and
wave detection
All subjects underwent 60 min head-up tilt test (HUTT) under modified Westminster protocol [11] at 70° and continuous high-resolution ECG recording in an acclimatized (27°C) and quiet room. Subjects were oriented to withhold exercise for 48 h before the exam, fast for at least 4 h, and avoid taking caffeine-containing beverages on the day of the exam. Before ECG recording, subjects remained in the supine position for 5 min [12]. ECG signal acquisition periods were characterized by 10 min of supine rest followed by 40 min HUTT and another 10 min supine rest. Accordingly, HR variability (HRV) was expected to be influenced by parasympathetic during supine rest, and sympathetic during tilt [13]. High-resolution ECG signals were acquired using modified bipolar Frank XYZ orthogonal leads and digital data were processed with custom-made pattern recognition software [6]. The wave detection was carried out with the signal low-pass filtered at 15 Hz (Butterworth, 4th order). The analysis of the RR-interval length was carried out after detection of the QRS complex. Artefacts and ectopic beats were excluded by correlation, precocity and visual inspection, and confirmed by one expert. [6]. The AVD interval comprehended the distance between the apex of the P-wave and the peak of the R-wave in normal beats, defining PR-interval (Figure 1), which was employed in a sole purpose of analysing AVD adaptation over instantaneous cardiac cycle [14]. The RR- and PR intervals were analysed on X lead.
SDX"class
MXclass
=
SDxclass
L..k =1
Ni,class
-1
(2)
,,20 L..,= I MXi,class . ('7i,class 20 L,=, ('7i,class + 1)
=
+
1)
,,20 2 L..i=! (SDXi,class) . '7i,class ,,20 L..i=1 '7i,class
(3)
(4)
where x represents either RR- or PR-interval. The variables MPR were plotted and correlated with MRR class. 2.4.
QRScomplex
Instantaneous AC and DC analysis
RR-interval histograms in AC and in DC phases were also built, following the rules described above. RR intervals in AC (RR Ac) and in DC (RR Dc) phases were classified accordingly. To further accomplish this task, it was initially isolated the data points as either acceleration (AC) or deceleration (DC) phases. If a particular RR interval increased relatively to the previous one, a DC interval occurred. As the instantaneous RR-interval increased, it characterized parasympathetic input (DC; lozenge symbols in Figure 2). Conversely, a sympathetic effect on the cardiac cycle length was represented
Figure 1. Identification of the apex (point) on P- and R waves, which allowed precise identification of the atrio ventricular duration by PR-interval. Instantaneous RR
=
2 (XK -Mxi,class )
where x represents either RR or PR interval. For each histogram, classes with 20 or less intervals were excluded of analysis to avoid bias due to lack of statistical precision. The values of the variables Mx, class and SDXi, class were aggregated to the respective histogram class. The pooled mean (Mx class) and standard deviation (SDxclass) of RR and PR-intervals for each histogram class, weighted by respective degree-of-freedom ('7/, class) , were calculated according to:
Twave
2.3.
�Ni.class
and PR interval
analysis
The histogram was constructed for individual RR interval series, and divided into classes of 100 ms width,
514
whenever the RR-interval decreased relatively to the previous one, and AC interval was defmed (AC; circle symbols in Figure 2). After RR-intervals classification, PR-intervals histograms were built, respectively, following the correspondent RR-intervals phases: PR AC derived from RR AC and PR DC from RR DC intervals.
(a) 200
180 160
100
600
.E
600 Ir-=��=-=..,'rl-
�
5 0
20
E:
200
C
180
0
L.b.-----:-��L-__----!.l_____l
:;=;
25
CO
':::l "0
�
Statistical analysis
160
806±72
131±9
ChD
906±52
140±1
MRRX MPR DC Slope
___0
600
700
800
a
900
1000
1100
1200
MRRxMPRAC
(C)
Slope
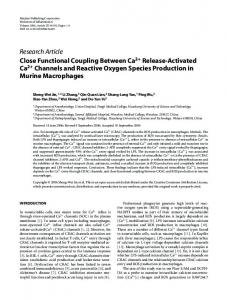
o Chagas: 0.006 " o Control 0.104
140
0
-
100 600
700
800
900
1000
1100
1200
Mean RR-interva/ (ms)
Figure 3. Pooled MPR group analyses (0 Control and 0 Athletes) as a function of mean RR-intervals for (a) whole series - T, (b) acceleration phase - AC and (c) deceleration phase - DC. * P < 0.05. 4.
Discussion
The relation between AVD and cardiac cycle length were studied in chronic ChD and healthy sedentary controls. The use of PR-interval (P-peak to R-peak) as a measure of AVD instead of the conventional PR segment has been proved to be feasible and has several advantages [14]. The conventional PR interval requires accurate identification of P-wave and Q-wave onsets, which is subject to controversies [14]. In fact, other studies indicate that AVD assessed by the peak of the P- and R wave show high correlation with the AVD measured at standard PR segment [14, 15]. By measuring the "PR segment" from the apex of the P wave to the peak of the R wave, the pure AV conduction time has not been accurately measured, which includes effects of variation on P wave morphology, bundle of His and early ventricular depolarization. Nevertheless, AV conduction is considered to be the most important determinant of the PR-interval [16]. PR-interval undergoes dynamic variations depending on age, HR, autonomic status, medications, posture,
Table 1. MRR and MPR duration per group (mean±SD) Control
1200
o Chagas: 0.031" o Control: 0.132'
120
The pooled RR- and PR-intervals duration, MRR and MPR respectively, were presented in Table 1.
MPR (ms)
1100
100
160
Results
MRR (ms)
1000
120
180
Group
900
140
200
The MPR and MRR of each subject were pooled and averaged on a class-by-class basis in the control and ChD groups. MPR was analysed in the whole series (T) as well as in the AC and DC phases, and respective MRR vs MPR slopes calculated (sMPRT, sMPRDc and sMPRAc). Regression lines were analysed and angular coefficient was compared between ChD and control groups using non paired Student's t-test. Correlation coefficients (r) were tested before each test. All tests were considered significant at a level < 0.05.
800
(b)
CI)
Figure 2. Acceleration (0 - RR Ac) and Deceleration ( RR DC) pairs of RR-intervals are represented in RR series signal. RR-interval histogram is represented on the right.
3.
700
..-
lii c: 700 -
2.5.
o Chagas: 0100 o Control: 0.002"
140
-;; 800
0
T
120
(j) 900 E
Q)
MRRX MPR
Slope
Linear correlation coefficient (r) and respective angular coefficient (slope) of regression lines between MRR and MPR variables computed in the whole series (T), and in DC and AC phases are presented in Figure 3. The sMPRT, sMPRDC and sMPRAC slope values significantly increased as a function of MRR in Control (Figure 3) in all phases. In ChD, slope of MPR was significant only in DC phase (p < 0.05). The MPRT, MPRDC and MPRAC were compared between groups, as a function of MRR. The values showed no significant difference between AC and DC phases for classes below 1000 ms.
515
respiratory frequency etc. [15], and abnormal AV conduction are often associated with life-threatening arrhythmia [2, 9]. In a previous study, the behavior of HRV time domain parameters that expresses energy was analyzed by grouping RR-intervals at different histogram classes [8]. Additionally, assessment of the capability to accelerate or decelerate enabled approximate isolation of sympathetic (AC) and parasympathetic (DC) phases contribution on RR-interval duration, respectively. Thus, by comparing control and ChD groups, the study introduced novel information that brought insights into the dependence of autonomic modulation on HR in a population of chronic ChD. Chagas heart disease is an arrhythmogenic cardiomyopathy. Bradyarrhythmias are also prevalent and, among them, sick sinus syndrome and diverse AV blocks degrees are common. Not infrequently, ventricular tachyarrhythmia and AV conduction abnormalities coexist in the same patient [17]. In the present study, it can be assumed that sympathetic denervation, confirmed by MIBG scintigraphy, contributed to average RR- and RTA-interval prolongation in ChD subjects (Table 1). In control group, PR-interval duration (MPRr, MRPDC and MPRAc) showed significant dependence on the corresponding cardiac cycle length (Figure 3). AVD and RR-interval relationship showed strong linear dependence (r> 0.93). On the other hand, in ChD group, significant MPR to cardiac cycle length dependence was confirmed only on DC phase (MRPDc). The MPR values comparison between groups showed no significant differences between AC and DC phases for classes below 1000 ms, in both controls and ChD. Thus, a vagal-driven influence on AVD adaptations may predominate in the RR-interval range analyzed. This study has additional limitations, including a relatively small sample size and application of the method using two physiologically well-defined groups. 5.
References [1] Guerri-Guttenberg RA, Grana DR. Chagas cardiomyopathy: Europe is not spared! Eur Heart J. 2008;29:2587-91. [2] Elizari MV, Chiale PA. Cardiac arrhythmias in Chagas' heart disease. J Cardiovasc Electrophysiol 1993;4:596-608. [3] Mohajer MP, Sahota DS. Cumulative changes in the fetal electrocardiogram and biochemical indices of fetal hypoxia. Eur J Obstet Gynecol Reprod Bioi 1994;55:63-70. [4] Westgate JA, Gunn AJ. Do fetal electrocardiogram PR-RR changes reflect progressive asphyxia after repeated umbilical cord occlusion in fetal sheep? Pediatr Res 1998;44:297-303. [5] Bauer A, Kantelhardt JW. Deceleration capacity of heart rate as a predictor of mortality after myocardial infarction: cohort study. Lancet 2006;367:1674-81. [6] Nasario-Junior 0, Benchimol-Barbosa PR. Refining the deceleration capacity index in phase-rectified signal averaging to assess physical conditioning level. J Electrocardiol 2014;47:306-10. [7] Benchimol-Barbosa PR, Barbosa-Filho J. The effect of the instantaneous RR interval on the dynamic properties of the heart rate and the ventricular repolarization duration variability. Computers in Cardiology 2000;27:821-4. [8] Nasario-Junior 0, Benchimol-Barbosa PR. Assessment of Autonomic Function by Phase Rectification of RRlnterval Histogram Analysis in Chagas Disease. Arq Bras Cardiol 2015;104:450-5. [9] Pimenta J, Miranda M. Abnormal atrioventricular nodal response patterns in patients with long-term Chagas' disease. Chest 1980;78:310-5. [10] Medeiros AS. Avaliayao auton6mica cardiaca em individuos com doenya de Chagas sem disfunyao ventricular empregando 0 teste de inclinayao (Tilt-Test). [Thesis]. Rio de Janeiro: Universidade Federal do Rio de Janeiro; 2008. (in portuguese) [II] Bomfim AS, Benchimol-Barbosa PR. Teste de inclinayao: fundamentos e aplicayao clinica. Rev SOCERJ 2004;17:243-50. [12] Lipsitz LA, Mietus J. Spectral characteristics of heart rate variability before and during postural tilt: relations to aging and risk of syncope. Circulation 1990;81:1803-10. [13] Heart rate variability. Standards of measurement, physiological interpretation, and clinical use. Task Force of the ESC and the NASPE. Eur Heart J 1996;17:354-81. [14] Sarma JS, Singh N. Circadian and power spectral changes of RR and QT intervals during treatment of patients with angina pectoris with nadolol providing evidence of differential autonomic modulation of heart rate and ventricular repolarization. Am J Cardiol 1994;74:131-6. [15] Forester J, Bo H. Variability of R-R, P wave-to-R wave, and R wave-to-T wave intervals. Am J Physiol 1997;273:H2857-60. [16] Berne RM, Levy MN. Electrical activity of the heart. In: Cardiovascular Physiology (6th ed.), St. Louis, MO: Mosby Year Book,1992:40. [17] Rassi A Jr, Rassi A. Chagas' heart disease. Clin Cardiol 2000;23:883-9.
Conclusion
In healthy subjects, PR-interval shows a direct RR interval dependence, under different autonomic-driven inputs. In subjects with Chagas disease showing sympathetic denervation, however, PR-interval increases only in DC phase, confirming loss of sympathetic driven RR-interval variation. Acknowledgements
This study received fInantial support from Brazilian agencies CAPES, CNPq and FINEP.
the
Address for correspondence: Jurandir Nadal
[email protected]) PO Box 68510; Zip code 21941-972; Rio de Janeiro,RJ,Brasil.
516