May 7, 2015 - Heuvel et al., 2006; Koning et al., 2006), finance (De Koning et al., 2008), service (George and ...... Hans Rämmal. Experimental Methods for ...
THESIS ON MECHANICAL ENGINEERING E92
Dynamic Management Framework for Continuous Improvement of Production Processes
JEVGENI SAHNO
PRESS
TALLINN UNIVERSITY OF TECHNOLOGY Faculty of Mechanical Engineering Department of Machinery The thesis was accepted for the defence of the degree of Doctor of Philosophy in Engineering Sciences at Tallinn University of Technology on: 07.05.2015. Supervisor: Eduard Shevtshenko, PhD, Senior Research Scientist, Faculty of Mechanical Engineering, Department of Machinery, Chair of Production Engineering, Tallinn University of Technology, Estonia. Opponents: Ph.D. Stipe Čelar, Assistant Professor, Department of Computer Architecture and Operating Systems, University of Split, Croatia. Double Dr.sc.ing. Aleksandrs Boiko, (“Railway Transport”, field “Transport and Traffic Engineering”, subfield “Land Transport and Infrastructure” and “Applied Mechanics”, field “Mechanics and Machine Science”); Lecturer, Riga Technical University, Institute of Railway Transport; Chief Technologist, LEkspresis Ltd, Latvia.
Defence of the thesis: 30.06.2015. Declaration: Hereby I declare that this doctoral thesis, my original investigation and achievement, submitted for the doctoral degree at Tallinn University of Technology, has not been submitted for any degree or examination.
Copyright: Jevgeni Sahno, 2015 ISSN 1406-4758 ISBN 978-9949-23-792-0 (publication) ISBN 978-9949-23-793-7 (PDF)
MEHHANOTEHNIKA E92
Tootmisprotsesside pideva parenduse dünaamiline juhtimisraamistik
JEVGENI SAHNO
CONTENTS INTRODUCTION ............................................................................................. 7 Background ...................................................................................................... 7 Research objectives and tasks .......................................................................... 8 LIST OF ABBREVIATIONS ......................................................................... 10 1. STATE OF THE ART ................................................................................. 11 1.1 Basic concepts applied in the research .................................................... 11 1.1.1 Key Performance Indicators ............................................................. 11 1.1.2 Analytic Hierarchy Process .............................................................. 13 1.2 Basic concepts applied in dynamic management framework .................. 15 1.2.1 Bill Of Materials ............................................................................... 15 1.2.2 Production Route Card ..................................................................... 15 1.2.3 Failure Classifier............................................................................... 16 1.2.4 Failure Mode and Effect Analysis Methodology .............................. 16 1.2.5 Theory Of Constraints ...................................................................... 21 1.3 Review of methodologies and tools for continuous improvement .......... 22 1.3.1 Total Quality Management ............................................................... 22 1.3.2 ISO 9000 Standards .......................................................................... 23 1.3.3 Six Sigma .......................................................................................... 24 1.3.4 Lean Six Sigma ................................................................................. 26 1.3.5 Six Sigma DMAIC ........................................................................... 26 1.4 Tools applied in the Information System framework .............................. 29 1.4.1 Product Data Management ............................................................... 29 1.4.2 Enterprise Resource Planning ........................................................... 29 1.4.3 Extraction-Transformation-Loading ................................................. 30 1.3.4 Data Warehouse and Data Mart ........................................................ 30 1.4.5 ISA-95 Standard ............................................................................... 32 1.5 Summary of the Literature Review .......................................................... 33 2. FRAMEWORK DEVELOPMENT FOR CONTINUOUS IMPROVEMENT OF PRODUCTION PROCESSES ................................. 36 2.1 Actions in Define step ............................................................................. 36 2.2 Actions in Measure step........................................................................... 38 2.2.1 Measure in FC .................................................................................. 38 2.2.2 Measure in FMEA ............................................................................ 38 2.2.3 Measure in FCC ................................................................................ 40 2.2.4 Measure in TOC ............................................................................... 42 2.2.5 Comparison of KPIs in AHP ............................................................ 42 2.2.6 Summary of Measure Step................................................................ 42 2.3 Actions in Analyse step ........................................................................... 43 2.3.1 Analyse in FMEA and FCC .............................................................. 43 2.3.2 Analyse in FMEA ............................................................................. 44 2.3.3 Analyse in FCC ................................................................................ 44 2.3.4 Analyse in TOC ................................................................................ 45
5
2.4 Actions in Improve step ........................................................................... 46 2.5 Actions in Control step ............................................................................ 46 2.6 Summary of the QCD framework ............................................................ 46 3. DEVELOPMENT OF DATA MART FOR THE NEW FRAMEWORK AND IDENTIFICATION OF NEEDED INFORMATION SYSTEM SOURCES ........................................................................................................ 48 3.1 Data Mart development and description .................................................. 48 3.2 Description of Information System environment for the Data Mart ........ 49 4. COMPUTATIONAL EXPERIMENT ....................................................... 54 4.1 Actions in Define step ............................................................................. 54 4.2 Actions in Measure step........................................................................... 55 4.2.1 Measure in FC .................................................................................. 55 4.2.2 Measure in FMEA ............................................................................ 55 4.2.3 Measure in FCC ................................................................................ 57 4.2.4 Measure in TOC ............................................................................... 58 4.2.5 Comparison of KPIs in AHP ............................................................ 59 4.3 Actions in Analyse step ........................................................................... 60 4.3.1 Analyse in FMEA and FCC .............................................................. 60 4.3.2 Analyse in FMEA ............................................................................. 63 4.3.3 Analyse in FCC ................................................................................ 66 4.3.4 Analyse in TOC ................................................................................ 66 4.4 Actions in Improve step ........................................................................... 67 4.5 Actions in Control step ............................................................................ 70 4.5.1 Validation of the improvements ....................................................... 70 4.5.2 KPIs re-calculation ........................................................................... 72 CONCLUSIONS .............................................................................................. 74 Scientific novelty of the research .............................................................. 75 Future work................................................................................................ 76 ABSTRACT...................................................................................................... 78 KOKKUVÕTE ................................................................................................. 79 ACKNOWLEDGEMENTS ............................................................................ 80 REFERENCES................................................................................................. 81 LIST OF PUBLICATIONS ............................................................................ 89 APPENDIX ....................................................................................................... 90 CURRICULUM VITAE.................................................................................. 91 ELULOOKIRJELDUS ................................................................................... 92
6
INTRODUCTION Background Internal issues that many manufacturing companies face today are often surrounded by the idea that companies are aware of the problems they have, for instance, unreliable production processes, low product quality, financial losses, delay in product delivery, but they do not often understand the root causes of these problems. The Pareto principle states that roughly 80% of the problems are arise from 20% of the causes (Koch et al., 2004). Problems in manufacturing start from various causes, e.g., low labour qualification, unbearable working conditions and old technologies applied that lead to low quality product. As a result, these causes may lead to the loss of customers’ expectations and consequently, to loss of the market position. To survive in the competitive market, companies should be expedient in technological resources, they should be able to demonstrate innovativeness, proof of their functional quality system and on time delivery of highly qualified products (Lõun et al., 2011; Riives et al., 2012). Customer Satisfaction (CS) is a superb feeling that emerges when a company meets expectations of a customer. There is a relationship between customer value and CS. The goal of a company is to provide the most competitive value to a customer. In order to provide value to a customer, a company should know what the value for the customer is. CS levels can be measured using survey techniques and questionnaires. The question is - what exactly is important for the customer: if it is product Quality, Cost or Delivery, which could indicate the Key Performance Indicators (KPIs). Quality products and services of a company are considered as the most important factor leading toward competitiveness and success (Hennig‐Thurau & Klee, 1997). A quality improvement effort will lead to a higher product and service quality, which will lead to improved CS (Torbica & Stroh, 2001). Achieving high levels of CS is important for a business because satisfied customers become loyal and can make repeat orders. A customer who is satisfied by the first buying experience needs to be satisfied again. Most customers care about quality, willing to pay more than an average market price and see “the extras” that are worth the additional expense (Matzler et al., 1998; Phillips et al., 1990; Deng et al., 2010). A company that succeeds on meeting and exceeding customers’ expectations is guaranteed to have substantial Return On Investment (ROI). Today’s companies are using various well-known methodologies like PDCA, 8D, Six Sigma DMAIC and 4Q (Sahno & Shevtshenko, 2014) for continuous improvement of their business processes and product quality, but these methodologies are intended to reduce variations and wastes in the processes rather than defect detection and prevention. Furthermore, companies utilize different lean tools like FMEA, Swimline process diagram, Pareto chart for waste detection and reduction. In addition, they use different Information System (IS) tools to facilitate and support business processes. All these 7
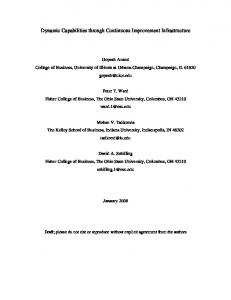
methodologies and tools are very successfully used to reach appointed goals and improve business success; but in most cases they are used independent of each other and bring no consolidated results. Therefore, the aim in this research is to present a framework that integrates various methodologies and tools into one general environment and shows what benefits a company can gain after its implementation. Figure A shows the structure of the thesis. Chapter – “Introduction” describes the background, objective and tasks of the research. Chapter 1 presents the literature review of the basic concepts, methodologies and tools applied in the research. The main contribution of this research is described in Chapter 2 where the new framework is created and in Chapter 3 where the Data Mart is developed for the new framework and connections with IS sources are presented. In Chapter 4 the computational experiment of the framework is demonstrated. Chapter – “Conclusions” presents the summary of the thesis. The new framework is applied in the structure of the problem solving methodology such as Six Sigma DMAIC but it can also be applied in the PDCA, 8D and 4Q methodology (Sahno & Shevtshenko, 2014).
Figure A. Structure of the thesis
Research objectives and tasks The objective of this research is to develop a framework for continuous improvement of the production processes that allows improvement of product quality, cost and delivery. This framework should integrate various quality improvement tools, methodologies, which are introduced into the Data Mart and connected with IS sources. The new framework will be applied in the rigorous Six Sigma DMAIC methodology that enables one to define, measure, analyse, improve and control the problematic production process. This framework will help engineers find out problematic operations and make decisions for elimination of the problems to improve product quality, cost and delivery. The framework should play the role of a “dashboard” like in a 8
cockpit, which allows monitor production process KPIs such as Process/Product Sigma Performance Level (PSPL), Cost Weighted Factor for RPN (CWFRPN) and Throughput (TH) (further in the text these notions will be expressed as follows: CWFRPN, PSPL, TH, not only as abbreviations but also as values) in an up-to-date way due to the constant renewal data from the production floor, for example, data from the Enterprise Resource Planning (ERP) system (Umble et al., 2003). These KPIs in turn influence product KPIs (KPIs that are measured based on feedback from a customer) such as Quality, Cost and Delivery. The framework is oriented on the improvement of production processes in the production floor; it is suitable for Small and Medium Enterprises (SMEs) and can be applied in large enterprises which have batch production. In addition, the current framework can be applied to various industries, where production process exists, such as machining, electronics, automotive etc. For this purpose, a company needs to develop own Failure Classifier (FC) and to adapt their production processes to current framework. The new framework enables: Detection of failures in the production process, which mostly influence product Quality, Cost and Delivery KPIs; Priority determination for product Quality, Cost and Delivery KPIs improvement; Access to data required for analysis and decision making.
9
LIST OF ABBREVIATIONS AHP BOM CM CO CS CT CTQ CWFRPN DBMS DPMO DMAIC DW ERP ETL FCC FC FMEA IS IT IO KPI PC PDCA PDM PR PSPL PY QCD ROI RPN or RPNReal RPNTheoretical SME TH TOC TQM WIP 4Q 8D
– Analytic Hierarchy Process – Bill Of Materials – Cost of Material – Cost of Operation – Customer Satisfaction – Cycle Time – Critical To Quality – Cost Weighted Factor for Risk Priority Number – Database Management System – Defects Per Million Opportunities – Define, Measure, Analyse, Improve, Control – Data Warehouse – Enterprise Resource Planning – Extraction Transformation Loading – Failure Cost Calculation – Failure Classifier – Failure Mode and Effect Analysis – Information System – Information Technology – Index of Occurrence – Key Performance Indicator – Process Constraint – Plan Do Check Act – Product Data Management – Production Route – Process/Product Sigma Performance Level – Process Yield – Quality-Cost-Delivery – Return On Investments – Risk Priority Number or Real RPN – Theoretical Risk Priority Number – Small and Medium Enterprise – Throughput – Theory Of Constraints – Total Quality Management – Work In Process – 4 Quadrants – 8 Disciplines
10
1. STATE OF THE ART This section provides the background of the basic concepts and the definitions used in this research.
1.1 Basic concepts applied in the research 1.1.1 Key Performance Indicators Measurement of any performance in business is an essential principle because it shows gaps between current and desired performance, it shows indication where it is necessary to move to close the unwanted gap. “Therefore, carefully selected Key Performance Indicators (KPIs) indicate precisely where to take action to improve performance” (Weber and Thomas, 2005). KPIs help an organization define and measure progress toward appointed goals. If an organization has defined its goals, then it is necessary to measure the progress toward appointed goals. A business organization may have its own KPIs that are based on customer’s feedback, for example product delivery on time (Reh, 2005). KPIs are used for evaluating of the company current status or for foreseeing the possible benefits after implementation of some modifications in the system. KPIs are quantifiable dimensions that are agreed on beforehand, they reflect the critical success factors of an organization and depend on the particular company where they should be evaluated. In addition, they vary depending on the organization (Barchetti et al., 2011). Nowadays KPIs are used in most business areas for monitoring of the performance of production, procurement and management of supply chains and in other areas. The importance of KPIs lies in presenting the company’s performance in terms of overall understanding how effectively a company competes in the marketplace. For that purpose, company needs to measure its own performance and compare it with competitors (Morphy, 1999). The KPI metrics can be categorized into the following sub-categories (Stéen, 2006): Quantitative – presented as a number Qualitative – presented as a number Leading – predict the outcome of a process Lagging – present the success or failure after the event Input – measure the amount of resources consumed during the generation of the output Process – represent the efficiency or the productivity of the process Output – show the results of the process Practical – interact with existing company processes Directional – show whether or not an organization is improving Actionable – show organizational changes Financial – used in performance measurement and when looking at an operating index
11
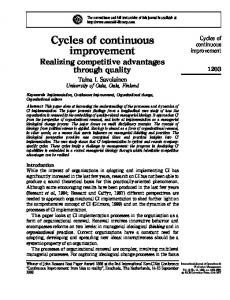
Based on the literature review, three important KPIs were found: Quality, Cost and Delivery (Stewart, 1995; Morphy, 1999; Jacoby, 2005), which will be considered in this research. Quality. A set of properties that determines its ability to meet the specific needs of a customer. If a product fulfils customer’s expectations, then it is considered that product is acceptable or even high quality. If a product does not fulfil customer’s expectations, then it is considered that product is not acceptable or low quality. Other words, product quality may be defined as “its ability to fulfil the customer’s needs and expectations”. Quality should be agreed beforehand in terms of what the customer wants and it can vary from product to product. (UNIDO, 2006). Cost. “The amount of money that a company spends on the creation or production of goods or services. It does not include the profit” (Cost definition, 2015). The cost has some definitions presented in Figure 1.1. In this research direct labour and direct materials costs called the prime cost or also the direct cost (costs that can be identified directly with a particular process, project or program) (Wild, 1995) will be discussed. In case the investments are required (purchase new equipment), the overhead cost should be considered and the period how soon the investment starts to pay off (when the break-even point starts) (Badiru, 2005).
Figure 1.1 Operations and total costs
Delivery. This notion is quite broad (it can be measured from order receiving until the physical order delivery to a customer), therefore this study considers only the manufacturing part of this notion, i.e., production lead time (e.g., the time from physical production start of the first sub-assembly/part until the finished product is ready for delivery) (Lead Time Terminology in Manufacturing, 2014). During this time, manufacturing line should release a specified amount of products and the ability of production line release needed for an amount of units is called Throughput (Pritsker et al., 1969; Johnson, 2003). The Throughput or Little’s Law (which shows the relationship between WIP, CT and TH) can be calculated using Equation (1.1). 12
TH
WIP CT
(1.1)
where: TH – Throughput – “the average output of a production process (machine, workstation, line, plant) per unit time”, WIP – Work In Process – “the inventory between the start and end points of a product routing”, CT – Cycle Time – “the average time from release of a job at the beginning of the routing until it reaches an inventory point at the end of the routing (i.e., the time the part spends as WIP)” (Little and Graves, 2008). Purpose of usage in this research: Continuously improve production process KPIs (PSPL, CWFRPN and TH) that influence the product KPIs (Quality, Cost and Delivery). 1.1.2 Analytic Hierarchy Process In our everyday life, people have to make various choices concerning which tasks and when to fulfil or not to fulfil, and whether to fulfil them at all. “There are many challenges, such as buying the most cost effective personal computer, a car, or a house, choosing a university or a job, investing money, deciding on a vacation place, or even voting for a political candidate, are common everyday problems in personal decision-making” (Saaty, 1988). In addition, local and national governmental decisions, such as where to build a road or a school, how to make funds within a country, are made. Similar challenges are met in business decisions, such as equipment purchasing, marketing a product, labour recruiting. All these problems are very essential and complex regarding choices. They need a logical decision. The human mind is incapable of considering all the factors and their effects simultaneously. Today people solve problems using mathematical models that draw conclusions which may not be clearly useful or even make decisions intuitively. Therefore, the Analytic Hierarchy Process (AHP) based on linear algebra was developed. Until recently, its connection to decision making has not been adequately studied. Today by help of personal computers, using the AHP software we can solve basic linear algebra problems. The difference of the AHP from conventional decision analysis techniques lies in the requirement that its numerical approach to priorities conforms to scientific measurement. If appropriate scientific experiments are carried out using the scale of the AHP for paired comparisons, the scale derived from these should yield relative values that are the same or close to what the physical law underlying the experiment dictates according to known measurements in that area. The AHP is of particular value when subjective, abstract or nonquantifiable criteria are involved in the decision (Saaty, 1988). “The AHP is a structured technique for organizing and analysing complex decisions developed by Thomas L. Saaty in the 1970s. The AHP breaks down a problem into a hierarchy in which each decision element is considered to be independent; thus, it cannot accommodate interrelationships among elements”
13
(Chung et al., 2005; De Ambroggi and Trucco, 2011; Tseng et al., 2009; Wu and Lee, 2007). “AHP approach consists of three major components and one of them, which is applied in this research, is “measurement methodology” used to establish priorities among the elements within each stratum of the hierarchy. This measurement is accomplished by asking the participants to evaluate each set of elements in a pairwise comparison with respect to each of the elements in a higher stratum. The task of the respondent is to evaluate each pair separately as to the degree to which one item of a pair dominates the other with respect to the elements from the next level in the hierarchy. In this case an illustrative instruction to the respondent would be: “which option is more important in helping achieve the corporate profit objectives and how important is it?”” (Wind and Saaty, 1980; Saaty, 1987). In order to provide numerical pairwise comparisons, a reliable and workable scale is needed. Table 1.1 presents the 9point scale. Table 1.1. The 9-point scales of the AHP (Wind and Saaty, 1980)
Importance 1 3 5 7 9 2, 4, 6, 8
Definition Equal importance Moderate importance Strong importance Very strong importance Absolute importance
Explanation Two elements contribute equally to the objective Experience and judgment slightly favour one element over another Experience and judgment strongly favour one element over another An activity is favoured very strongly over another The evidence favouring one activity over another is of the highest possible order of affirmation Used to express intermediate values
Using this scale, the participants assess the dominance of each element over the others with respect to each element of the higher levels of the hierarchy. The individual judgements are made in a group setting, involving the relevant decision maker, and serve as a basis for discussion on the reasons for specific judgements. Such discussions often result in agreement and in those cases in which agreement cannot be reached, a sensitivity analysis can be conducted to assess to what extent the divergent judgement leads to significantly different results (Wind and Saaty, 1980; Saaty, 1987). The basic premise of the AHP is that measurement evolves out of comparisons, particularly pairwise comparisons. Suppose that there are n objects A1, …, An whose vector of corresponding weights w = (w1, …, wn) is known. From here the Matrix/Equation (1.2) of pairwise comparisons of weights can be formed (Saaty, 1990).
14
⋯ ⋮
⋮
⋮
⋯ ⋮ ⋮ ⋯
⋮
= n
⋮
(1.2)
Purpose of usage in this research: Compare various KPIs and identify the most important one for improvement.
1.2 Basic concepts applied in dynamic management framework 1.2.1 Bill Of Materials Bill Of Materials (BOM) or product structure is a list of the assemblies, subassemblies, materials, components and the required quantities to manufacture a finished product. The content of the BOM may vary from company to company, depending on business needs and processes. In industries, the BOM is also known as the recipe or ingredients list, which usually contains the following information: BOM Level (the hierarchy of BOM level starts from level 0 – finished product and so on until the level 1, 2, 3 and N, which includes subassemblies and materials), Part Number, Part Name/Description, Quantity, Unit of Measure, Procurement Type, BOM Notes, Other information required for business needs. BOM can be specific to engineering (used in the design process), production (used in the manufacturing process), and to other areas. A production BOM is important in Materials Requirement Planning (MRP) and Enterprise Resource Planning (ERP) systems; it is used to calculate the direct cost of a product, as well as to order parts from suppliers (Bill Of Materials, 2015). Purpose of usage in this research: Direct product cost calculation and production route creation per BOM level. 1.2.2 Production Route Card Production Route (PR) card is a card that gives the details of an operation to be performed in a production line. It is used to instruct the workers to take up the production work. The content and formats of the PR card can vary from a company to a company. In general, it contains: an item and the number of quantities to be produced; production time; dimensions; any additional information that may be required by the worker. PR card traces the route to be taken by a job during a production process (Production Route Card, 2014).
15
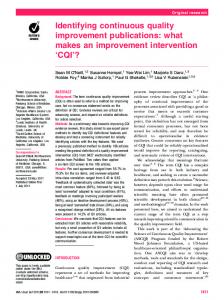
Purpose of usage in this research: Describe production process steps (product/component name, work centres, operation name, time, sequence). 1.2.3 Failure Classifier Reliability engineering deals with an analysis of the causes of the faults in factories. In this research, a Failure Classifier (FC) based on DOE-NE-STD1004-92 standard was developed for a machinery company presented in Figure 1.2. There are seven major cause categories, and each of them has its subcategories. The basic goal of using this standard is to define the problems or causes that can occur for each operation during the production process, in order to further correct them (DoE, U. S., 1992). This standard was adapted and modified for the machinery enterprises (Karaulova et al., 2012).
Figure 1.2. Failure Classifier for a machinery company
Purpose of usage in this research: Assign the failure group and the failure cause to the problem operation during the production process; then use assigned and measured failures for process analysis. 1.2.4 Failure Mode and Effect Analysis Methodology Failure Mode and Effect Analysis (FMEA) is a reliability procedure that provides an evaluation of potential failure modes for processes and their likely 16
effect on outcomes and/or product performance. “It determines by the failure mode analysis the effect of each failure on system operation and identifies single failure points that are critical to mission success or crew safety. FMEA is suitable especially when the effects of faults of basic materials, parts and equipment on the next functional level of higher order are examined, and which fault mechanism can be established at this level” (Stamatis, 2003). “FMEA can be applied to equipment and facilities and might be used to analyse a manufacturing operation and its effect on the product or process. The output/results of FMEA can be used as a basis for design or further analysis or to guide resource deployment” (ICH Q9 Quality Risk Management, 2006). Nowadays, companies are working to enhance the reliability of their products to open an opportunity for business development. Therefore, the FMEA was born. “It is a systematic method of identifying and preventing product and process problems before they occur. FMEA has focused on preventing defects, enhancing safety and increasing a customer’s satisfaction” (Johnson, 1998). All FMEAs are team based and the purpose of an FMEA team is to bring a variety of perspectives and experience to the project. A person is appointed responsible for making of an FMEA; however, collection of FMEA data should be performed within a team. The team should be made of five to nine members. All team members must have some knowledge of group behaviour, they must be cross-functional and multidiscipline to handle the problem to be discussed. The team should consist of experienced members, for instance of engineers from the design, quality, supply chain, production and testing (Stamatis, 2003). FMEA is presented in the form of a table (see Figure 1.3). Every row is a single failure mode described by a number of characteristics: how it must be, what can fail, effect and cause of this failure and current control.
Figure 1.3. An FMEA form
“Every potential failure mode and effect is rated in three factors by Severity (S), Occurrence (O) and Detection (D) on a scale ranging from 1 to 10 presented in Tables 1.2, 1.3, and 1.4. By multiplying the rating for the three 17
factors (S×O×D), a Risk Priority Number (RPN) will be determined for each potential failure mode and effect using Equation (1.3). The RPN will range from 1 to 1000 for each failure mode or operation. It is used to rank the need for corrective actions to eliminate or reduce the potential failures” (MacDermott et al., 1996). RPN = S × O × D (1.3) Severity (S) – “criticality of a failure, the consequence of the failure that should occur during the process. It is an estimation of how serious the effect can be if a failure occurs. In some situations it is clear because of past experience how serious the problem is. In other situations, the severity rating can be estimated based on the knowledge and expertise of the team members. Every failure may have several different effects and each effect can have a different level of severity. Therefore, for every effect, its own severity rating should be given, even if there are several effects for a single failure mode” (MacDermott et al., 1996). Occurrence (O) – “how often the failure happens, the probability or frequency of the failure occurring. The best method for determining the occurrence rating is to use actual data from the process. For example, the data from the production floor can be used. When actual failure data are not available, the team should estimate how often a failure occurs and at what frequency failures happen. Once the potential causes are identified for all of the failure modes, an occurrence rating can be assigned” (MacDermott et al., 1996). Detection (D) – “what kind of control is required in a process to detect the failure before the impact of the effect is realized. The detection rating looks at how likely a failure or the effect of a failure to be detected is. It is started by identifying current controls that may detect a failure or an effect of a failure. If there are no current controls, the likelihood of detection will be low, and the item would receive a high rating, such as 9 or 10. The current controls should be listed first for all of the failure modes, or the effects of the failures and the detection ratings assigned” (MacDermott et al., 1996). Advantages of the FMEA could be summarized as follows: Finds relations between reasons and cause effects, Shows previous unknown event reasons, Allows systematic analysis. Disadvantages of FMEA could be summarized as follows: Amount of data can be huge, Data analysis can be very complicated, Environment conditions, maintenance respects cannot be examined (Lendvay, 2004).
18
Table 1.2. Ranks for severity estimation (MacDermott et al., 1996)
Severity effect on product Rank Severity effect on process Potential failure mode affects safe 10 May endanger operator/machine item operation without warning without warning Potential failure mode affects safe 9 May endanger operator/machine item operation with some warning with warning Loss of primary function (item 8 100% of production may be inoperable, but does not affect safe scrap. Stop production or stop item operations) shipment Degradation of primary function 7 Portion of production run may (item still operates, but at a reduced be scrapped. Decreased line level of performance) speed or additional manpower required Loss of secondary function (item still 6 100% of production run may operable, but comfort functions do require off-line rework not work) Degradation of secondary function 5 Portion of production run may (item still operates, but comfort require off-line rework functions perform at reduced level) Appearance item or audible noise 4 100% of production run may (annoys more than 75% customers) require rework in-station before it can be processed Appearance item or audible noise 3 Portion of production run may (annoys 50% customers) require rework in-station before it can be processed Appearance item or audible noise 2 Slight inconvenience to process, (annoys less than 25% customers) operation or operator No discernible effect 1 No discernible effect Table 1.3. Ranks for occurrence estimation (MacDermott et al., 1996)
Likelihood of Failure Very High High Moderate Low Very Low
Occurrence of Causes >1 per 10 1 in 20 1 in 50 1 in 100 1 in 500 1 in 2000 1 in 10 000 1 in 100 000 1 in 1000 000 Failure eliminated by preventive control
19
Occurrence Index % > 10 5 2 1 0,2 0,05 0,01 0,001 0,0001
Occurrence Rank 10 9 8 7 6 5 4 3 2 1
Table 1.4. Ranks for detection estimation (MacDermott et al., 1996)
Detection by process control No current process control; cannot detect; is not analysed It is not easy to detect failures and errors (e.g. random audits) Post-processing failure mode detection by operator using visual, tactile or audible means In-station failure mode detection by operator using visual, tactile or audible means or by attribute gages Post-processing failure mode detection by operator via variable gages or in-station by operator using attribute gages In–station failure mode or cause detection by operator via variable gages, also gauging on set up; first piece inspection Post-processing failure mode detection by automated controls that detect nonconforming parts and prevent further processing In-station failure mode detection by automated controls that detect nonconforming parts and prevent further processing In-station cause detection by automated controls that detect an error and prevent bad parts from being made Error prevention via fixture design, machine or part design, bad parts cannot be made
Detection rank 10 9 8 7 6 5 4 3 2 1
FMEA is criticized for the RPN meaning used. Although it is a measure of the risk of a failure mode or fault, it is the product of three rankings, and as such, it has no meaning as a number: it is only useful in comparisons. Additionally, the number of products that are designed and/or produced with this RPN is not taken into account (Gilchrist, 1993). Furthermore, the FMEA process identifies a large number of failure modes and faults, providing insight in the way in which reliability can be improved. Although the FMEA is very successful and useful, as a tool it has most valuable as a management tool (rather than as a technical prediction tool), the effectiveness of which is dependent on the extent to which it is carried out. First of all, the composition of the team that has to identify all potential failure modes and effects determines very much the extent to which all potential failure modes and faults will be identified. Since the identification of the failure modes as well as their RPN is based on experience and imagination, it is important to obtain many different viewpoints in the first step of the FMEA process (hence, it is recommended to include many different participants in the FMEA process). Secondly, the identification of the RPN for the different faults is only one part of the FMEA process. At least as important as the identification of the RPNs, is defining and executing the actions that have to be taken in order to reduce the RPN of high-ranking faults (Houben, 2010). Reasons for use of the FMEA in the current research are as follows (Kostina, 2012):
20
FMEA is a relatively low-tech method, which can be understood and used by many practitioners. FMEA is a very widespread method; many enterprises are using it. FMEA shows relationship between the failure mode and the cause of this failure. During assessment of Severity and Detection ratings in the FMEA (Occurrence should be calculated more precisely based on data from the production floor), differences in opinions between experts can arise; therefore, when the expert opinions do not match, the assessment may be made using Kendall’s coefficient of concordance (Kendall and Babington, 1939), which was presented in the work of Kostina (Kostina, 2012). “Kendall’s coefficient of concordance is a measure of the agreement among several quantitative or semiquantitative variables assessing a set of objects of interest” (Legendre, 2005). “The coefficient of concordance varies in the range of: 0