Journal of Soil Science and Plant Nutrition 2012, 12 (4), 763-774
Dynamics of soil organic carbon and dissolved organic carbon in Robina pseudoacacia forests
H. Lv 1,3 and Z. Liang 1,2* Institute of Soil and Water Conservation, Chinese Academy of Science and Ministry of Water Resources,
1
Yangling, Shaanxi 712100, P.R. China. 2College of Life Science, Northwest A&F University, Yangling, Shaanxi 712100, P.R. China. 3Weinan Teachers University, Weinan, Shaanxi 714000, P.R. China. *Corresponding author:
[email protected]
Abstract We investigated the variation patterns of organic carbon in soil and soil solution of four selected Robinia pseudoacacia forests aged 10a, 25a, 31a, and 35a, as well as a contrastive tillage site in a similar topography condition in Loess Plateau, China. The purpose was to explore the dynamics of soil organic carbon (SOC) and dissolved organic carbon (DOC) in R. pseudoacacia forests. On average depths of 20, 40, and 60 cm, SOC, active organic carbon (AOC), and DOC gradually increase with increased forest age. After forest restoration, the AOC/SOC ratio and resistant organic carbon/SOC ratio increase, whereas the slow organic carbon/SOC ratio decreases. The soil solutions in the subsoil layer have low DOC:DON ratio and high UV absorption at 280 nm. At 40 and 60 cm, the depth distribution is indicated as special low values for DOC concentration in the C99 site (10a site), as well as for soil water content, SOC, and AOC in the 25a forest site. Our results provide evidence that during forest restoration, SOC does not consistently increase linearly. The change points of different SOC proportions and DOC concentrations at various depths are not same, i.e., asynchronous changes exist. Keywords: depth distribution, soil organic carbon dynamics, active organic carbon (AOC), UV absorption at 280 nm.
763
764
Lv and Liang
1. Introduction Soils have the potential for carbon (C) release or se-
need to be analyzed to explore highly inherent natural
questration. Hence, soil organic carbon (SOC) is re-
variability in worldwide soils and carbon loss rules
lated to atmospheric CO2 levels, which can be affec-
under different land cover types and change trajecto-
ted by vegetation cover and land management (Lal,
ries (Lal, 2009). The mechanism of SOC dynamics in
2004). When land is converted from one cover type
forest chronosequences needs to be determined.
to another, research on SOC dynamics is valuable
In forest, grass, and shrub vegetation restoration,
in improving our comprehension and increasing our
DOC leaching plays an important role in SOC at di-
predictive capability over both short- and long-term
fferent depths, which is a crucial function in the be-
scales (Post and Kwon, 2000). Land cover changes
lowground carbon cycle. The largest increase in the
affect litters, plant root, soil fauna, soil microorga-
flux of dissolved organic matter (DOM) occurs when
nisms, and soil condition, which can drastically alter
percolating water passes through the forest floor (Mi-
the soil carbon stock. Generally, the transformation of
chalzik et al., 2001). DOM leaching from organic la-
cultivated soil to forest ecosystem can realize addi-
yers to mineral soils and DOM sorption onto mineral
tional soil carbon sequestering. The concomitant de-
surfaces are very likely to be important mechanisms
velopment of soil carbon and vegetation in primary
in stabilizing soil organic matter (Kalbitz and Kaiser,
and secondary chronosequences was documented by
2008). Therefore, both SOC and DOC should be cal-
Bush et al. (2008), among others. SOC increases by
culated and measured in predicting ecosystem respon-
up to 52% after a change from crop to secondary fo-
se to global change, especially for depth distribution.
rest (Guo et al., 2002). Forests with nitrogen-fixing
The Loess Plateau in China covers approxima-
trees may also allocate a higher fraction of their net
tely 58 × 104 km2. In the 1970s, the Chinese gover-
primary production to soil (e.g., Bush, 2008; Kiser et
nment began an extensive tree plantation. Since then,
al., 2009). However, the results of soil carbon stock
the Zhifanggou drainage area of the Ansai country of
change in forest chronosequence are likely to be diffe-
Shaanxi province has undergone remarkable land use
rent. The increasing trend of soil carbon is not always
change. The conversion of degraded lands into fo-
represented in the entire forest chronosequence or at
rests and grasslands was essentially promoted by the
each depth. Zhou et al. (2006) found that pioneer and
state-funded project, Grain-for-Green, in 1999. The
transition forests had limited effects on SOC accumu-
eco-environment was improved under government
lation even if the aboveground biomass rapidly accu-
regulations of reforestation/planting grass (Fu et al.,
mulates and reaches a high level. In the hilly Loess
2010). The restored forest species included Platycla-
Plateau of China, Wang et al. (2010) indicated that
dus orientalis, Quercus variabilis, Robinia pseudoa-
SOC contents are significant for different land covers
cacia, and Pinus tabulaeformis, among others. In the
in a semi-arid climate only at 5 cm soil surface depth.
Zhifanggou drainage basin, one of the main restored
Cropland transformation to immature woodland has
species, R. pseudoacacia, was planted extensively as
no significant effect on SOC.
a kind of pioneer forest plant because of its high adap-
SOC is greatly susceptible to environment change,
tability. Restored R. pseudoacacia forests of different
especially to vegetation cover changes (Wang et al.,
ages were mixed with one another at patch scales in
2011). Large amounts of worldwide soil carbon data
the Zhifanggou drainage basin, enabling the selection
Journal of Soil Science and Plant Nutrition 2012, 12 (4), 763-774
Soil organic carbon dissolved organic carbon Robina pseudoacacia forests 765
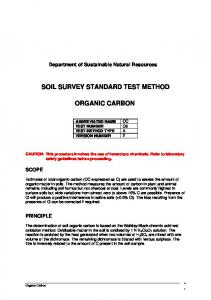
of suitable sites in a small field. The present study used
N), located in the middle part of the Loess plateau
a special comparison method to (1) estimate SOC dy-
in northern Shaanxi Province, P. R. China (Figure
namics in a period of 35 years for R. pseudoacacia
1). Due to significant topographic variations within
forest restoration in a similar topographic condition,
the Loess hills and gully landforms, only a small
(2) investigate the mechanism of SOC and DOC dy-
area of 275 m × 212.5 m is covered to ensure that all
namics during the development of forest vegetation,
selected sites had similar topographic conditions.
and (3) explore the depth distribution of SOC and its
Four R. pseudoacacia forest sites and one tillage
potential change mechanism in forest restoration.
site were selected (Table 1). The region mainly has a semi-arid climate of warm temperate zone, with
2. Materials and Methods
an annual accumulative radiation of 493 kJ cm-2. The average annual temperature is 8.8 °C and the
2.1 Field site and sampling regime
mean annual precipitation is 549.1 mm. The soil in the study area is fine silt to silt in texture and
The study area is the Zhifanggou drainage basin
weakly resistant to erosion.
(109°13′46″–109°16′03″ E , 36°46′42″–36°46′28″
Figure 1. Location of the study sites with a 2 m contour lines. Journal of Soil Science and Plant Nutrition 2012, 12 (4), 763-774
766
Lv and Liang
Table 1. Summary of land-use history, geographic condition, vegetation and plantling details of five study sites. Sample sites
Stand age (years)
Acreage (m2)
Old land use
Aspect
Slope (°)
Crown density
Total litters (g m-2)
Trunk diameter (cm)
Tree height (m)
Tillage
∞
1220
—
W
20.2
—
—
—
—
C99
10
1581
Tillage
SWW
27.3
0.9-0.95
348.3
11.4
11-12
C84
25
913
Tillage
SWW
21.4
0.5-0.6
262.4
12.8
15-20
C78
31
1344
Tillage
SWW
21.4
0.75-0.8
362.9
23.8
15-20
C74
35
486
Tillage
SWW
18.3
0.85-0.9
298.6
30.1
>20
In 1973, the Zhifanggou basin was selected as an ex-
enclosed these samples in a plastic bag and stored them
perimental site by the Key Technologies Research and
in the laboratory at 2 °C. Three 100 cm-deep holes were
Development Program on the comprehensive mana-
randomly selected and dug in each study site. Samples
gement of the Loess Plateau. Partial farmlands were
were collected from depths of 5–10, 30–35, 60–65, and
reverted into forests and grasslands in batches. Four
90–95 cm, and stored in 50 mL aluminum boxes to de-
kinds of R. pseudoacacia forests were respectively
termine the soil water content and soil bulk density.
planted in 1999 (10a or C99), 1984 (25a or C84), 1978 (31a or C78), and 1974 (35a or C74). The fo-
2.2 Sampling and analysis
rests herbs include Arundinella hirta, Roegneria kamoji, Viola yedoensis, Aneurolepidium dasystachys,
The moisture samples in aluminum boxes were weig-
Artemisia japonica, Carex rigescens, Agropyron
hed wet, dried at 105 °C for 48 h, and weighed again to
cristatum, etc. The tillage study site has existed sin-
determine the bulk density and gravimetric soil water
ce 1974 and is less affected by chemical fertilizer.
content. After air drying soil samples for 3 days, litters
When cropland in this area was gradually restored to
were carefully picked out, crushed to pass through a 1
forest, grassland, or shrub, the tillage site was kept
mm sieve, and stored at 2 °C until analysis.
but the corns, soybean, and millet were rotated. Four
In 1989, Parton (1989) divided SOC into active
forest sites and the tillage site locate in 200-500 m
(AOC), slow (LOC), and resistant C pool (ROC) ba-
east to Shiyaoxian village, where all restored forest
sed on the mean residence times. In the present stu-
fields were distributed to villagers in order to manage
dy, SOC was determined using the routine potassium
effectively. According to old villager’s introduction,
dichromate oxidation-outer heating method. The 333
in history the study area had been utilized as farmland
mM KMnO4 chemical oxidation method was used for
by serious food demand until 1973.
AOC determination (Conteh et al., 1997). ROC was
An average of nine sections was selected in each
determined by the acid hydrolysis method (Collins et
study site. Samples from depths of 20 ± 2, 40 ± 2, and
al., 2000). About 1 g of soil samples were hydroly-
60 ± 2 cm were obtained using a soil drill and evenly
zed with 20 mL of 6 M HCl in sealed Pyrex tubes at
mixed with three horizontal samples, respectively. We
105 °C for 18 h. The hydrolysate was then discarded.
Journal of Soil Science and Plant Nutrition 2012, 12 (4), 763-774
Soil organic carbon dissolved organic carbon Robina pseudoacacia forests 767
After washing unhydrolyzed residues with deionized
2.3 Data handling and statistics
water by repeated centrifugations and decantations, the samples were transferred to pre-weighed vials and
All figures and most data were made using Excel 2003
dried at 60 °C to constant weight. Subsequently, SOC
and SPSS 16.0 software. One-way ANOVA was used
was analyzed. LOC was calculated by difference bet-
to examine the effects of the vegetation restoration
ween SOC and ROC (LOC = SOC – ROC).
type on the concentrations and stocks of soil carbon. If
DOM was collected using a soil-to-solution (distilled water) ratio of 1:5, shaken for 1 h, and centrifu-
significant effects were observed by ANOVA, a least significant difference [LSD (0.05)] test was used.
ged (2000 rpm for 10 min). The solution was collected, filtered through 0.45 µm cellulose acetate filters,
3. Results
and stored in a frozen state until analysis. DOC was determined with a TOC Analyzer (Phoenix 8000).
3.1 Soil water content and bulk density
Total nitrogen (TN) in the solution was determined using a photometer after persulfate digestion. Inorga-
A comparison of the tillage and forest sites revealed
nic nitrogen was determined using a continuous flow
that their soil bulk density had big difference (p =
analyzer (AA3). Dissolved organic nitrogen (DON)
0.05) at 5–10 cm, but did not exhibit coherent diver-
was determined by the difference between TN and
sity in subsoil (Table 2). Soil water content was ob-
dissolved inorganic nitrogen (DIN), i.e., DON = TN
viously higher in the tillage site than in the forest sites.
– DIN. The UV absorbance at 280 nm was measured
With increased forest restoration age, the soil water
(adjustive solution of 10 mg L DOC, calculated by
content approximately increased. Soil water content
dividing measured UV absorption at 280 nm) to esti-
in the C84 site showed no obvious change from 60–95
mate aromaticity (Zsolnay et al., 1999). All samples
cm. Water content was lower in C78 than in C84. With
were determined with three replicates.
increased depth, the soil water contents in all study
-1
sites increased, except for C84. Table 2. Bulk density and water content of 100 cm soils from the five study sites. variables
Bulk density (g cm-3)
Water content (%)
sites
5-10cm
30-35cm
60-65cm
90-95cm
Tillage
1.24±0.16b
1.23±0.11b
1.22±0.20b
1.36±0.10a
C99
1.05±0.34c
1.16±0.20c
1.23±0.30b0154
1.17±0.15c.111
C84
1.43±0.29a
1.44±0.15a
1.29±0.21ab
1.16±0.20c
C78
1.38±0.54a
1.16±0.25c
1.34±0.17a
1.38±0.15a
C74
1.38±0.33
1.26±0.15
1.17±0.20
1.27±0.11b
Tillage
4.74±0.11a
6.98±0.36a
7.60±2.30a
8.33±2.01a2
C99
2.32±0.27b
3.36±0.21c
4.33±1.29c
4.86±0.56c
C84
2.81±1.22
3.12±0.36
d
3.18±0.64
2.98±1.00d
C78
2.55±0.75b
2.90±1.01d
3.36±0.99d
5.09±1.53bc
C74
4.07±0.65a
4.47±0.13b
5.33±1.64b
5.68±2.06b
a
b
b
cd
c
Values are means±standard errors of n=3. Significant differences between sites are indicated by superscript letters (LSD; p≤0.05). Journal of Soil Science and Plant Nutrition 2012, 12 (4), 763-774
768
Lv and Liang
3.2 Changes in SOC, AOC, and DOC For the three depths, the change scope of SOC was
(Table 3). The average SOC of the three depths in-
smaller in the tillage site than in the forest sites
creased with increased forest age.
Table 3. SOC, AOC and DOC quantity of five study sites. Variables SOC (g kg-1)
AOC (g kg-1)
DOC (mg kg-1)
Depths
Tillage
C99
C84
20cm
2.23±0.13
2.58±0.14
40cm
1.73±0.05b
1.68±0.07bc
60cm
1.86±0.04
average
C78
6.65±1.66a
1.37±0.07c
1.97±0.03b
3.31±0.12a
1.38±0.05
1.14±0.02
b
1.99±0.12
3.05±0.07a
1.92±0.03b
1.81±0.10b
1.82±0.65b
2.46±0.56ab
4.13±1.03a
20cm
0.09±0.01a
0.19±0.03a
0.23±0.05a
0.25±0.02a
0.49±0.16a
40cm
0.04±0.00
0.07±0.01
0.04±0.00
b
0.11±0.01
0.17±0.01a
60cm
0.03±0.00c
0.03±0.00c
0.02±0.01c
0.06±0.00b
0.11±0.00a
average
0.05±0.00b
0.09±0.01b
0.09±0.011b
0.13±0.01ab
0.24±0.02a
20cm
bc
14.57±2.32
16.50±5.36
12.80±6.11
a
20.86±1.40
25.47±7.56a
40cm
13.26±3.26c
2.76±0.54d
12.64±8.92c
18.50±0.20b
24.40±2.17a
60cm
16.01±1.03a
2.56±0.85b
13.82±0.32a
16.15±5.45a
14.32±3.16a
average
14.61±5.61b
7.27±1.23c
13.09±5.13bc
18.50±6.00ab
21.40±4.26a
b
d
3.32±0.40
C74 ab
b
ab
ab
c
c
c
cd
b
c
3.75±0.30
Values are means±standard errors, n=9 besides average. Averages are calculated with 27 data (n=27) of three depths in each site. Significant differences between sites are indicated by superscript letters (LSD test; p≤0.05).
Compared with tillage, the average SOC values in
higher than that in the tillage site (distinct diversity
the 10a and 25a forest sites decreased, increased to
degree, p = 0.05) in each depth.
the original level (value of the tillage site) in the 31st
With increased age, AOC increased at 20 cm in
year of restoration, and increased continually thereaf-
the four forest sites. However, the AOC values at 40
ter. SOC increased with increased age at 20 cm in
and 60 cm in C84 (25 a) were lower than that in the ti-
the C99, C84, C78, and C74 forest sites. However,
llage site. LOC in the forest sites obviously increased
SOC decreased at 40 and 60 cm in C99 and C84. On
compared with that in the tillage site. Given the low
average, the SOC at three depths and at 20 cm had
AOC value at 40 and 60 cm, AOC in C84 was lower
more remarkable diversity degrees between the forest
than that in C99, but still 84.0% higher than that in
and tillage sites. SOC in C74 (35a) was significantly
the tillage site.
Journal of Soil Science and Plant Nutrition 2012, 12 (4), 763-774
Soil organic carbon dissolved organic carbon Robina pseudoacacia forests 769
3.3 SOC proportion
The DOC values at 40 and 60 cm in C99 were lower, but those at 20 cm were higher than those in the tillage site. DOC at 20 cm gradually increased with increased
In all four forest sites, AOC/SOC and ROC/SOC were
-1
age, except for DOC in C84, which was 3.7.1 mg kg
higher but LOC/SOC was lower than those of the ti-
lower than that in C99. DOC values at 40 and 60 cm
llage site (Table 4). The AOC/SOC ratio in C84 (25a)
in C99 were lower than that in the tillage site. From
was lower than in C99 (10a) at the three depths, but
10 years to 25 years, the DOC values at 40 and 60 cm
showed no obvious difference between C74 (35a) and
increased gradually and approached that of the tillage
C78 (31a). With increased depth, the AOC/SOC ratio
site after 25 years.
decreased gradually. In all four forest sites, AOC/SOC at 60 cm was 44.9%–69.4% lower than that at 20 cm, compared with the 64.1% for the tillage site.
Table 4. Contrast of three SOC proportions in five study sites. Depths
Variables
Tillage
20cm
AOC/SOC
0.04±0.00
LOC/SOC 40cm
60cm
C99(10a)
C84(25a)
C78(31a)
C74(35a)
0.07±0.01
0.06±0.01
a
0.07±0.00
0.07±0.01a
0.68±0.01a
0.50±0.05a
0.49±0.05a
0.64±0.01a
0.50±0.04a
ROC/SOC
0.29±0.02
0.43±0.05
0.45±0.04
a
0.29±0.01
0.43±0.03a
AOC/SOC
0.02±0.00b
0.04±0.01ab
0.03±0.00b
0.05±0.00a
0.05±0.00a
LOC/SOC
0.70±0.01a
0.65±0.03ab
0.59±0.03ab
0.57±0.03b
0.606±0.03ab
ROC/SOC
0.28±0.01
0.31±0.03
0.38±0.03
a
0.38±0.03
0.35±0.03a
AOC/SOC
0.01±0.00c
0.02±0.00b
0.02±0.00bc
0.03±0.00ab
0.04±0.00a
LOC/SOC
0.74±0.03a
0.65±0.03ab
0.70±0.03ab
0.53±0.01b
0.62±0.02b
ROC/SOC
0.24±0.03
0.33±0.03
0.28±0.03
0.44±0.01
0.35±0.02ab
b
a
a
b
a
a
a
ab
a
a
a
b
a
Values are means±standard errors, n=9 besides average. Significant differences between sites are indicated by superscript letters (Tukey-Kramer test; p≤0.05).
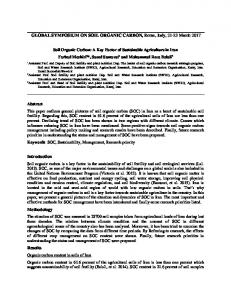
3.4 DOC/DON ratio and UV absorption at 280 nm of DOM
of the tillage site, whereas those of the other forest sites decreased to different extents. The lowest value appeared in C84, accounting for 29.9% of the
With increased depth, the DOC/DON ratio in all
tillage site. At 40 and 60 cm, the DOC/DON va-
study sites gradually increased (Figure 2). The
lues decreased. At 60 cm, DOC/DON decreased to
DOC/DON ratio at 20 cm of C78 was close to that
36.1%–58.3%.
Journal of Soil Science and Plant Nutrition 2012, 12 (4), 763-774
770
Lv and Liang
Figure 2. DOC quality changes in soil solution of three depths. Means and standard errors of nine replicates. UV absorbance decreased with increased depth in
4. Discussion
each site. At 20 cm, the UV absorbance of C78 accounts for 39.1% of that of C84. The UV absorbance
4.1 Soil water content
index at 20 and 40 cm was higher in each forest site than that in the tillage site, and increased with increa-
Soil water content is affected by both vegetation cover
sed restoration age. The UV absorbance index at 60
on the soil surface and plant roots in subsoil. Soils
cm in C99 and C78 approached that of the tillage site,
of forest vegetation in the Loess plateau have lower
but was higher in C84 and C74 than in the tillage site.
water content than those in tillage sites because of root
Journal of Soil Science and Plant Nutrition 2012, 12 (4), 763-774
Soil organic carbon dissolved organic carbon Robina pseudoacacia forests 771
absorption (Zhao, 2005). Vegetation restoration chan-
In general, the amount of SOC is greater in forests
ges the litter density, root quantity, and ultimately,
than in arable soils (Vesterdal et al., 2002). For exam-
soil conditions such as pH, temperature, moisture, mi-
ple, in tropical areas, SOC increases by 29% when
croorganisms, etc., which are indicated as significant
agricultural land is afforested (Axel et al., 2011).
factors affecting soil carbon turnover (Lal, 2005). The
However, a land-use change from arable to forest does
results of the evaporation and herbage root absorption
not always increase the sequestration of soil organic
at 20 cm, as well as the more powerful arbor root ab-
matter (Vesterdal et al., 2002). In our study, although
sorption at 40 and 60 cm show that the water content
the average SOC in the four forest sites increased gra-
at three depths did not exhibit the same change trend
dually, those in the C99 and C84 forest sites were less
with increased age. With the development of forest
than that in the in tillage site. SOC at 40 and 60 cm
vegetation, the soil water content decreases in subsoil
showed different changes compared with that at 20
and soil surface, but increases overall. The soil water
cm, suggesting the diversity of SOC turnover mecha-
content changes the conditions of the organic carbon
nisms between the soil surface and subsoil. Fontaine
pool and affects its turnover rate, deposited form, and
et al. (2007) found that adding fresh SOC can accele-
SOC proportion. In semi-arid areas, high soil water
rate old SOC decomposition. After forest restoration,
contents increase SOC concentration with high humi-
SOC in subsoil was changed by some factors, such
fication rates. Hence, the depth distribution of water
as litter fragmentation, SOC composition, and root
content can at least partly affect the SOC proportion
density, different from that on the surface soil, indica-
and concentration.
ting an asynchronous state. In the 25a forest site, soil water content, SOC, and AOC congruously displayed
4.2 SOC concentration and proportion changes during 35 years forest restoration
lower values at 40 and 60 cm. During forest restoration, SOC in subsoil initially increased due to litter fragmentation, which led to a slight increase in the
Litters are the most important sources of SOC in the
10a site, and then decreased due to old SOC decom-
forest ecosystem (Huang et al., 2011). However, the
position and root absorption. Our study proved that
carbon input on surface soil is higher than in deeper
the fluctuation of SOC was represented only in the
soil layers. When tillage was converted into forest,
first 25 years of forest restoration. The mechanism of
litters accumulated gradually on the soil surface and
the “decrease factor” such as old SOC decomposition
the depth distribution of SOC was enhanced. Compa-
in response to the “increase factor” such as litter frag-
red with tillage, the depth distribution of SOC in the
mentation still needs to be explored.
10a to 35a forests acutely increased at 20 cm due to
By the nitrogen fixation function of R. pseudoaca-
litter accumulation. Subsoil organic carbon is mainly
cia, litters on the soil surface with lower C/N ratios led
generated from root exudates, leaches DOC, fragmen-
to fast decomposition times, accounting for high AOC
tation, and particle SOC movement, which produce
quantity (MA et al., 2007). In all four forest sites, the
limited C input. However, subsoil layers in the tillage
AOC/SOC and ROC/SOC ratios were higher than tho-
site can intercept more organic carbon than those in
se in the tillage site. This finding suggested that after
the forest by ploughing and fertilization, which con-
forest restoration from tillage, AOC ratio and ROC
tribute to the decrease in subsoil organic carbon in
ratio increased, and LOC ratio was consumed. Hence,
young forest restoration.
forest vegetation may help restore carbon in soil. An
Journal of Soil Science and Plant Nutrition 2012, 12 (4), 763-774
772
Lv and Liang
asynchronous state was also suggested by the SOC
tity have low values, low root exudates, and microbial
proportions. In our study, AOC was regarded had the
degradation, leading to low DOC values in the subsoil
highest biochemical quality within the shortest residen-
layer in the 10 a site, although the AOC value was hig-
ce time, and played an important role in plant nutrition.
her than that in the 25 a forest site. With increased root
ROC is an inert compound with stable physical and
density and microbe quantity, subsoil SOC and AOC in
chemical qualities. LOC can be deemed as a recalci-
25a forest had the lowest values, whereas DOC increa-
trant compound with the longest residence time (Paul et
sed compared with 10a forest.
al., 1999). Kazumi (2011) found that young, fast-MRT
UV absorbance and DOC: DON were utilized
soil carbon is decomposed in the upper A horizon, and
to evaluate DOM property and composition (Traina
old, stable soil carbon is decomposed in the lower A ho-
et al., 1990). The specific UV absorbance at 280 nm
rizon in the forest. In the present study, the AOC/SOC
was considered as a measure of aromaticity (Chin et
ratio in all four forest sites decreased gradually with
al., 1994), and DOC:DON was considered as a pro-
increased depth. The SOC dynamics and compositions
xy for the quality of the DOM. Increased DOC:DON
differed between the soil surface and subsoil, leading to
indicates reduced bioavailability (e.g., Brian et al.,
different changes during forest restoration.
2009). In our study, DOC:DON at 20 cm in the forest sites showed no obvious difference with those in the
4.3 DOC changes in forest sites
tillage site; however, those at 60 cm were higher than those in the tillage site. Stephan (2011) found the
DOC in soil solution is generated from litter leacha-
throughfall contribution to the overall element fluxes
tes, root exudates, and microbial degradation products
was higher for DON than for DOC. Lower DOC/DON
(Zsolnay, 1996). In the forest ecosystem, litters on
values in forest than in tillage sites reflects that after
the forest floor gradually accumulates, microbial de-
forest restoration, soil solution movement is more ac-
gradation products increase due to high AOC values
tive, and/or more recalcitrant DOM is removed from
with short residence times, and root density in subsoil
the solution (Brian et al., 2009). On the other hand,
increase. Consequently, the average DOC increases
forest restoration leads to changes in SOC propor-
with increased age.
tions, such as increased AOC and ROC ratio, as well
The DOC values at 40 and 60 cm in 10a forest
as decreased LOC, suggesting biodegradation action.
were lower than in the other study sites, contributing
A part of DOC is released from SOC biodegradation.
to lower average DOC values in 10a forest than in the
DOC in forest sites mainly consist of litter-derived
tillage site. Theoretically, both DOC leaching from soil
DOC and SOC-derived DOC, providing lower DOC/
surface and root exudates can lead to the low depth dis-
DON values and higher acromaticity compositions
tribution of the study sites, except the 10a forest site.
than in tillage sites.
In other words, they decrease the DOC difference between the soil surface and subsoil layer. As important
5. Conclusions
sources, the degradation products of litters and AOC on the soil surface hardly leach through the subsoil la-
When tillage was reverted into forest, SOC exhibited
yer (Matthias, 2009), especially when AOC on the soil
a total, nonlinear, absolute increase, suggesting asyn-
surface is low in the beginning of forest restoration. For
chronous changes. During R. pseudoacaci forest res-
young forests, the plant root density and microbe quan-
toration, the difference between the soil surface and
Journal of Soil Science and Plant Nutrition 2012, 12 (4), 763-774
Soil organic carbon dissolved organic carbon Robina pseudoacacia forests 773
subsoil led to the depth distribution of SOC and AOC. The 25a forest represented a special phase wherein soil water content, SOC, and AOC exhibited low values in the subsoil layer. Apparently, there was a natural C-input course during forest restoration. After forest restoration, the total SOC and AOC increased and ROC increased, suggesting an internal conversion process among the SOC proportions. In forest ecosystems, the LOC concentration decreases and the degradation and transformation among AOC, LOC, and ROC changed. However, whether the changes benefit the soil carbon input in the long run is still unclear. In the beginning of forest restoration, DOC concentration at 40 and 60 cm sharply decreased, suggesting obvious depth distribution. However, the depth distribution of DOC for mature forests was not obvious. DOC does not perfectly indicate the same changes as those of SOC proportions, and more factors control the DOC concentration.
Acknowledgments We thank Jinyi Wang from Northwest A&F University for academic support, who improved the presentation of the manuscript. This work was supported by Knowledge Innovation Project of The Chinese Academy of Sciences(KZCX2-XB2-05-01)
References
pools. Forest Ecology and Management. 258, 2347-352 Bush, J.K. 2008. Soil nitrogen and carbon after twenty years of riparian forest development. Soil Science Society of America Journal. 72, 815-822. Chin, Y. P., Alken, G., OLoughlin, E. 1994. Molecular weight, polydispersity, and spectroscopic properties of aquatic humic substances. Environmental Science and Technology. 28, 1853-1858. Collins, H.P., Elliott, E.T., Pustian, K. et al. 2000. Soil carbon pools and fluxes in long-term corn belt agroecosystems. Soil Biology and Biochemistry. 32, 157-168. Conteh, A., Lefroy, R.D.B., Blair, G.J. 1997. Dynamics of organic matter in soils as determined by variations in 13C/12C isotopic ratios and fractionation by ease of oxidation. Australian Journal of Soil Research. 35, 881-890. Fontaine, S., Barot, S., Barre, P., Bdioui, N., Mary, B., Rumpel, C. 2007. Stability of organic carbon in deep soil layers controlled by fresh carbon supply. Nature. 450, 277-280. Fu, X.L., Shao, M.A., Wei, X.R. et al. 2010. Soil organic carbon and total nitrogen as affected by vegetation types in Northern Loess Plateau of China. Geoderma. 155, 31-35. Guo, L.B., Gifford, R.M., 2002. Soil carbon stocks and land use change: a meta analysis. Glob. Change Biol. 8, 345-360.
Axel, D., Jens, S., Annette, F. 2011. Impact of tropical land-use change on soil organic carbon stocks- a meta-analysis. Global Change Biology. 17, 1658-670.
Huang, Y.H., Li, Y.L., Xiao, Y. et al. 2011. Controls of litter quality on the carbon sink in soils through partitioning the products of decomposing litter in a forest succession series in South China. Forest ecology and management. 261, 1170-1177.
Brian, D.S., Robert, B. H., Thomas, A.T., et al. 2009. Changes in dissolved organic matter with depth suggest the potential for postharvest organic matter retention to increase subsurface soil carbon
Kalbitz, K., Kaiser, K. 2008. Contribution of dissolved organic matter to carbon storage in forest mineral soils. Journal of Plant Nutrition and Soil Science. 171, 52-60.
Journal of Soil Science and Plant Nutrition 2012, 12 (4), 763-774
774
Lv and Liang
Kazumi, K., Yosuke, M., Kenji, T. et al. 2011. A study of the carbon dynamics of Japanese grassland and forest using 14C and 13C Nuclear Instruments and Methods in Physics Research. B. 268, 1106-1109
Traina, S.J., Novak, J., Smeck, N.E. 1990. An ultraviolet absorbance method of estimation the percent aromatic carbon content of humic acids. Journal of Environmental Quality. 19, 151-153.
Kiser, L.C., Kelly, J.M., Mays, P.A. 2009. Changes in forest soil carbon and nitrogen after a thirty-year interval. Soil Science Society of America Journal. 73, 647-653.
Vesterdal, L., Ritter, E., Gundersen, P. 2002. Change in soil organic carbon following afforestation of former arable land. Forest Ecology Management. 169, 137-147.
Lal, R. 2004. Soil carbon sequestration impacts on global climate change and food security. Science. 304, 1623-1627.
Wang, Y.F., Fu, B.J., Lü, Y.H., Song, C.J., Luan, Y. 2010. Local-scale spatial variability of soil organic carbon and its stock in the hilly area of the Loess Plateau, China. Quatern Res. 73, 70-76.
Lal, R. 2005. Forest soils and carbon sequestration. Forest ecology and managemen.t 220, 242-258. Ma, Y.H., Guo, S.L., Yang, Y.L. et al. 2007. Influence of Vegetation Types on Soil Organic C at Yangou Catchment in the Loess Hilly-gully Region Journal of natural resources (in Chinese) 22(1), 97-106 Michalzik, B., Kalbitz, K., Park, J.H., Solinger, S., Matzner, E. 2001. Fluxes and concentrations of dissolved organic carbon and nitrogen-a synthesis for temperate forests. Biogeochemistry. 52, 173-205. Post, W.M., Kwon, K.C. 2000. Soil carbon sequestration and land-use change: processes and potential. Glob. Change Biol. 6, 317-327. Parton, W.J., Sandford Jr, R.L., Sanchez, P.A., Stewart, J.W.B. 1989. Modeling soil organicmatter dynamics in tropical soils. Soil Science Society of America Journal. 39, 153-171. Paul, E.A.D., Harris, H.P., Collins, U.S., Robertson, G.P. 1999. Evolution of CO2 and soil carbon dynamics in biologically managed, rowcrop agroecosystems. Applied Soil Ecology. 11, 53-65.
Wang, Y.F., Fu, B.J., lv, Y.H. et al. 2011. Effects of vegetation restoration on soil organic carbon sequestration at multiple scales in semi-arid Loess Plateau, China. Catena. 85, 58-66. Zhao, J.B., Du, J., Zhou, Q. et al. 2005. Dry layer of soil below artificial forest near XianYang in Shaanxi. Scientia geographica sinica. 25(3), 322329. (in Chinese) Zhou, G.Y., Zhou, C.Y., Liu, S.G. et al. 2006. Belowground carbon balance and carbon accumulation rate in the successional series of monsoon evergreen broad-leaved forest. Science in China Series D: Earth Sciences. 49, 311–321. Zsolnay, A. 1996. Dissolved humus in soil waters. In: Piccola. A. (Ed.). Humic Substances in Terrestrial Ecosystems. Elsevier. Amsterdam pp, 171-223. Zsolnay, A., Baigar, E., Jimenez, M. et al. 1999. Differentiatingwith fluorescence spectroscopy the sources of dissolved organic matter in soils subjected to drying. Chemosphere. 8, 45-50
Journal of Soil Science and Plant Nutrition 2012, 12 (4), 763-774