MARINE ECOLOGY PROGRESS SERIES Mar Ecol Prog Ser
Vol. 559: 159–173, 2016 doi: 10.3354/meps11887
Published November 9
Ecological niche of coastal Beaufort Sea fishes defined by stable isotopes and fatty acids Jasmine D. Brewster1, 2,*, Carolina Giraldo2, Heidi Swanson3, Wojciech Walkusz2, 4, Tracey N. Loewen2, 5, Jim D. Reist2, Gary A. Stern1, Lisa L. Loseto1, 2 1
Department of Environment and Geography, University of Manitoba, 220 Sinnott Building, 70A Dysart Road, Winnipeg, MB R3T 2N2, Canada 2 Freshwater Institute/Fisheries and Oceans Canada, 501 University Cres., Winnipeg, MB R3T 2N6, Canada 3 Department of Biology, University of Waterloo, 200 University Ave. W, Waterloo, ON N2L 3G1, Canada 4 Institute of Oceanology, Polish Academy of Sciences, Powstancow Warszawy 55, 81-712 Sopot, Poland 5 Department of Geological Sciences, University of Manitoba, 240 Wallace Building, 125 Dysart Rd., Winnipeg, MB R3T 2N2, Canada
ABSTRACT: Little is known about the trophic ecology of freshwater, coastal and marine fish species that utilize coastal environments in the Beaufort Sea. In this study we use stable isotopes (SI) and fatty acid (FA) profiles to (1) characterize habitat and diet components of the ecological niche for 16 co-occurring fish species, (2) quantify niche overlap among these species and groups of species, and (3) identify resource partitioning and niche shift indicators for future monitoring. Ward’s cluster analysis of SI (δ13C, δ15N) results identified 3 representative isotopic groups that were consistent with known life-history groups: marine, freshwater-rearing and coastal fishes. Correspondence and Ward’s clustering analyses on FA profiles resulted in 5 FA groups that indicated feeding preferences and included: pelagic marine-feeding, benthic and pelagic brackish (both freshwater and marine)-feeding, benthic freshwater-feeding, benthic marine-feeding, and benthic brackish-feeding groups. Isotopic niche size and feeding preferences (FA) indicated generalist and specialist strategies that could be used as indicators for resource partitioning and niche shifts. Understanding the habitat use, diet, and trophic interactions among fish species is important in monitoring the Tarium Niryutait Marine Protected Area. Combining SI and FA tracers to quantify probability of niche overlap is a unique aspect of understanding species-specific niche interactions within the Beaufort Sea coastal environment, and our results contribute to understanding how these biotracers can contribute to current and future monitoring and management of this remote MPA. KEY WORDS: Niche · Stable isotopes · Fatty acids · Marine protected areas · Fishes Resale or republication not permitted without written consent of the publisher
INTRODUCTION Direct and indirect effects of climate variability and change on the marine environment and organisms of the Beaufort Sea are substantive and anticipated to continue (Cobb et al. 2008, Serreze & Barry 2011, Barber et al. 2012, Stroeve et al. 2012). Many climateinduced modifications of marine food webs will manifest through changes in the productivities and trophic structures of affected ecosystems (e.g. see *Corresponding author:
[email protected]
Wrona et al. 2006, Arrigo et al. 2008). Therefore, a baseline understanding of the feeding and habitat ecology of animals in the Beaufort Sea ecosystem is needed to understand and predict the full effects of future climate change. Coastal habitats of the southern Beaufort Sea are unique as they integrate the cooler marine water inputs of the Beaufort Sea and the warmer freshwater inputs from large rivers (Craig 1984, Wrona et al. 2006). The Mackenzie River and estuary serve as important transitional habitats © Inter-Research and Fisheries and Oceans Canada 2016 · www.int-res.com
160
Mar Ecol Prog Ser 559: 159–173, 2016
between fresh and saltwater and, coupled with the stable buoyancy boundary current of brackish water along the Yukon coastal environments, serve as migration corridors for anadromous fishes in the summer months (Craig 1984, Carmack & Macdonald 2002). Summer freshwater inputs that mix with seawater also provide complex coastal habitats for eurythermal and euryhaline marine fishes. Accordingly, coastal habitat use by anadromous and marine fishes, and use of freshened marine waters by freshwater species, is complex (Carmack & Macdonald 2002). Documenting such usages through biological tracers (biotracers) such as stable carbon and nitrogen isotopes and fatty acid signatures can provide basic understanding of trophic structure and patterns in this important coastal fish community. Moreover, baselines established under present circumstances allow for follow-on studies monitoring changes and potentially documenting causation resulting from changes induced by climate shifts and other stressors. Stable isotope (SI) ratios of carbon and nitrogen (δ13C and δ15N) have successfully been used in many investigations of feeding ecology, trophic interactions, and habitat use in fish populations (e.g. Hobson et al. 2002, Cherel et al. 2011, Radabaugh et al. 2013). δ13C values are often used to differentiate between benthic and pelagic, terrestrial and marine prey sources, whereas δ15N values are widely used as indicators of trophic level (e.g. see Post 2002, Boecklen et al. 2011). Fatty acids (FAs) are also commonly used chemical tracers that reflect trophic interactions and predator diets (e.g. Iverson et al. 1997, 2004, Kolts et al. 2013). More recently, SI ratios and FA compositions have been used together to better characterize and understand long-term (3 to 4 mo; Post 2002, Iverson et al. 2004) feeding ecology and habitat use (Dahl et al. 2003, Wan et al. 2010, Connelly et al. 2014). Recent advances in quantitative and statistical analyses of both SI and FA data (e.g. multi-dimensional plots and combined qualitative assessments) have enabled stronger analytical outcomes than those achieved through results of each individual marker type (Newsome et al. 2007, Swanson et al. 2015). A new approach in quantifying trophic (or other) niches beyond 2 dimensions has been developed in the statistical program ‘nicheROVER’ (Newsome et al. 2007, Swanson et al. 2015). This method can quantify niche region and the probabilities of overlap within or among species and may help better assess speciesspecific resource partitioning and plasticity. Several locations along the Beaufort Sea coast have been designated as marine protected areas (MPAs).
The Tarium Niryuitait MPA consists of 3 regions, Niaqunnaq (including Shingle Point), Okeevik, and Kittigaryuit, and was established to protect Beaufort marine species and their supporting habitats (Government of Canada 2010). Efforts to conserve and protect the biota in this MPA require the establishment of effective monitoring. These monitoring programs must be founded on existing bodies of baseline research. This is particularly important for Shingle Point, where the ecology (diets/habitats) of the many fish species that use the area in summer months is poorly understood. In this study, we used SI and FA data in conjunction with Bayesian and multivariate techniques to (1) characterize the niches of 16 co-occurring fish species from the coastal area of Shingle Point, (2) identify and quantify niche overlap among these species and group species based on their niche similarities, and (3) identify indicators for resource partitioning and niche shifts. Increased understanding of the Beaufort Sea coastal ecosystems can then be used to select key species and parameters relevant to the assessment of long-term ecosystem health of this MPA.
MATERIALS AND METHODS Sample collection Fish samples from 16 species (see Table 1) were collected under the auspices of the Arctic Coastal Ecosystem Study program (ACES, Department of Fisheries and Oceans) from coastal habitats at Shingle Point, Yukon Territory, Canada (Fig. 1), in each year between 2011 and 2013. The study species represent seasonally anadromous forms of salmonids that are important in subsistence fisheries as well as coastal (mixed low-salinity) and marine (high-salinity) species (Coad & Reist 2004). Fish were collected in the brackish coastal environment of Shingle Point by local fisheries monitors and harvesters. Gill and seine nets allowed for the capture of a large range of fish sizes. The samples for this study were opportunistic, and collected in the months of July and August (2011 to 2013). Most fishes were vacuum-sealed and kept frozen (−18°C) on site before they were shipped to the Freshwater Institute (DFO, Winnipeg, Manitoba, Canada), for processing. Dolly varden char Salvelinus malma are an important traditional food for the Inuvialuit and Gwich’in peoples (Jarvela & Thorsteinson 1999). As such, the harvesters will normally prepare and con-
Brewster et al.: Niches of Beaufort Sea fish
161
run every n = 10). Repeat measurements of laboratory standards crosscalibrated against the International Atomic Energy Agency standards CH6 for C and N1 and N2 for N validated the analytical precision since error did not exceed 0.2 and 0.3 ‰ for δ13C and δ15N, respectively.
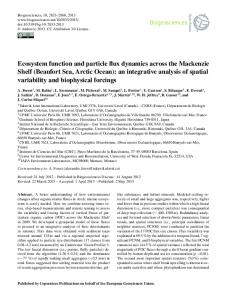
FA analysis FA samples comprised the lateral half of each fish cut lengthwise along the sagittal plane and excluded the gastrointestinal tract. Each sample was homogenized and stored in a −80°C freezer for a minimum of 24 h before being freeze-dried. The freezedried homogenate was sub-sampled Fig. 1. Map of the Tarium Niryutait Marine Protected Area, Yukon Territory, Canada, including the Kittigaryuit, Niaqunnaq, and Okeevik regions. The and aliquots weighed (0.25 g), and a study area Shingle Point is part of the Niaqunnaq area standard lipid extraction method using 2:1 chloroform-methanol containsume the entire fish. Thus, muscle tissue for SI analying 0.01% butylated hydroxytoluene (BHT) (v/v/w) sis was only taken from this species if local harvesters was performed (Folch et al. 1957). The lipid phase of allowed us to sample their catches. FA analysis was each sample was obtained by using anhydrous sodinot run for dolly varden char. um sulphate to wash, collect and dry each sample, and then the sample was evaporated under N. The lipid phase was then weighed and recorded for lipid SI analysis weight before being treated with Hilditch reagent (0.5 N H2SO4 in methanol) resulting in transesterficaDorsal muscle tissue was removed from individuals tion and FA methyl esters (FAMES) (Morrison & of the 16 species of fish to be processed for SI analySmith 1964). Samples were heated at 100°C for 1 h. ses. Each sample was freeze-dried and ground into The techniques and processes in identifying FA fine powder using a mortar and pestle. Samples were peaks are outlined in more detail in Giraldo et al. sent to the Environment Isotope Laboratory at the (2015). Briefly, gas chromatography (on an Agilent University of Waterloo, Ontario, Canada, where stanTechnologies 7890N GC equipped with a 30 m J&W dard isotopic methods analyzed each sample for carDB-23 column) combined with a Flame Ionization Debon (C) and nitrogen (N) stable isotope ratios on a tector (FID) (running at 350°C) was used to identify Thermo-Finnigan Delta Plus continuous flow isotope FA compounds. Hydrogen was used as the carrier gas mass spectrometer (Thermo Finnigan) equipped with flowing at 1.25 ml min−δ1 for 14 min and ramped to 2.5 ml min−δ1 for 5 min. The split/splitless injector was a Carlo Erba Elemental Analyzer (CHNS-O EA1108, heated to 260°C and run in splitless mode. The oven Carlo Erba). Stable nitrogen (δ15N/δ14N) and carbon (δ13C/δ12C) isotopic ratios relative to the international program was as follows: 60°C for 0.66 min, increase of standards of atmospheric nitrogen (Mariotti 1983) 22.82°C min−δ1 to 165°C with a 1.97 min hold, 4.56°C min−δ1 to 174°C and 7.61°C min−δ1 to 200°C with a and Vienna Pee Dee Belemnite (Craig 1957) for N 6 min hold (Giraldo et al. 2015). Percent FAs were and C, respectively, were expressed in standard used for statistical analysis. A total of 73 FAs were notation (δ) measured as per mil (‰). Internal laboraidentified, 25 of which accounted for 90% or more of tory standards included 1 standard of cellulose for the total. These 25 FA profiles (FA signatures) are exδ13C (−25.5 ‰) and 2 standards of (NH4)2SO4 for δ15N (0.77 and 20.2 ‰). Repeatability of sample material pressed using the notation A:BnX, reported as for δ13C and δ15N was 0.1 and 0.2 ‰, respectfully, percent of total FA (%), and were used to identify the based on repeat analysis of duplicates (duplicates general diet of the fishes.
162
Mar Ecol Prog Ser 559: 159–173, 2016
Study design and statistical analysis Trophic level (δ15N) and habitat use/carbon source (δ13C) often vary with fish size and life stage (e.g. Peterson & Fry 1987, Bosley et al. 2002, Romanuk et al. 2011). As such, SI and FA analyses were thus limited to adult, non-spawning individuals. There was no significant relationship between δ13C and fish size (fork length) observed (r2 < 0.3, for all species) for adult, mature individuals (determined by visual inspection of gonads). In order to compare δ15N among multiple fishes, δ15N was normalized for each species separately. Species-specific residuals of the relationship between δ15N and fork length for each individual were calculated and added to the mean δ15N of the respective species, with analyses of δ15N data performed on these size-corrected data (Swanson & Kidd 2010). Lipid content can significantly affect δ13C values and interpretation (Post et al. 2007). Since lipids were not chemically extracted from the dorsal muscle prior to SI analysis, a mathematical approach that incorporates the C to N ratio (C:N) within tissues was used (Post et al. 2007): δ13Cnormalized = δ13Cuntreated − 3.32 + 0.99 × C:N (1) All statistical analyses were performed in R v.3.1.0 (R Core Team 2012). Ward’s hierarchical clustering analysis with Euclidean distance generated groups from mean δ13C and δ15N values for each species using the package ‘ade4’. Two-dimensional (δ13C and δ15N) probabilistic (95%) regions for each of the groups identified from the Ward’s clustering were developed using a Bayesian framework in the package ‘nicheROVER’ (Swanson et al. 2015). We also used nicheROVER to estimate probability of isotopic niche overlap (95% region) among species. Results for niche region size generated with the 40% probabilistic niche region are presented in Table S1 in the Supplement at www.int-res.com/articles/suppl/m559 p159_supp.pdf. Here we define high niche overlap as a median overlap greater than 50% between 2 species. The default ‘non-informative’ prior was used in nicheROVER. Differences in niche centroid (defined by mean δ13C and δ15N) among species within the 3 isotopic groups (A, B, and C) were investigated using the residual permutation procedure (RPP) metric mean distance (MD). Variations in species-specific isotopic niche positions were identified if Euclidean distance between niche centroids was significantly greater then zero (Turner et al. 2010). The 25 FA signatures for all species studied, except dolly vaden char, were used to infer the general diet of each species (Table S2 in the Supplement). A
Kruskal-Wallis test was used to analyze differences in percent total lipid content (%TL) among species. The relationship between fork length (mm) with FA profiles and%TL for each species was assessed using linear regression analysis. For statistical and modeling analyses some FAs were combined. The FA markers for Calanus copepods 20:1n9, 20:1n11 and 22:1n9, 22:1n11 were combined as FA Calanus (e.g. FalkPetersen et al. 2002). The 16PUFAs (polyunsaturated fatty acids) included: 16:2n6, 16:2n4, 16:3n4, 16:4n3, and 16:4n1. The 18PUFAs included: 18:2n7, 18:2n4, 18:3n6, 18:3n4, 18:3n1, 18:4n3, and 18:4n1. Essential FAs found in freshwater fish: 18:3n3 and 18:2n6 were separated from the 18PUFAs (Tocher 2010). Finally, non-methylene interrupted (NMI) FAs, indicative of bivalves or gastropods (Budge et al. 2006) included: 20:2n, 20:3n, 22:2n, and 22:3n. Correspondence analysis (CA) was used to compare FA signatures among species using the packages ‘Factoshiny’ and ‘FactoMineR’. Highest explained variance was indicated in the CA using the 25 FAs. To group individuals based on similar FA compositions, a Ward’s cluster analysis was performed using mean FA signatures and 2 significant CA axes. This was done in the package ‘hclust’. The FA groups generated from the Ward’s cluster analysis were characterized by significant high and low proportions of FA signatures indicated by a v-test. The probability of niche overlap within groups (identified by the isotopic Ward’s cluster analysis) was reevaluated using both the mean SI signatures and mean dietary FA profiles identified by the v-test. The FA signatures included as variables in the probability of niche overlap calculation were: 20:3n6, 20:2n6, 21:5n3, 18:2n6, Calanus FA and 22:6n3.
RESULTS SI analysis Relatively wide variability in δ13C and δ15N was observed among the 16 species of fish (n = 1048) (Table 1). The δ13C ranges among all species was (mean ± SE; 4.6 ± 0.22 ‰). The species most depleted in 13C was broad whitefish Coregonus nasus (−27.47 ± 0.25 ‰), and the species most enriched in 13C was saffron cod Eleginus gracilis (−22.87 ± 0.03 ‰) (Table 1). Our results suggest a span of approximately 2 trophic levels identified among all species with a ± δ15N range of 6.37 ‰; the lowest values were observed in broad whitefish (9.10 ± 0.13 ‰) and highest in saffron cod (15.47 ± 0.05 ‰) (Table 1).
Brewster et al.: Niches of Beaufort Sea fish
163
Table 1. Biological data of the 16 fish species captured at Shingle Point, Yukon Territory, Canada. Sample size (n), (mean ± SE) fork length (FL), carbon to nitrogen ratio (C:N), % total lipid content (%TL), and stable isotopic signatures (δ13C and δ15N) for each species are shown as well as δ13C and δ15N ranges. Species are grouped by family. N/A: information not available Species common name (code), Scientific name
n
FL (mm)
C:N
%TL
δ13C (‰)
δ13C range (‰)
δ15N (‰)
δ15N range (‰)
Habitat
Catostomidae Longnose sucker (LNSK), Catostomus catostomus
11 160.09 ± 22.60 3.33 ± 0.039 16.12 ± 2.21 −26.15 ± 0.46
3.79
9.64 ± 0.34
3.51
Freshwater/ brackisha
Clupeidae Pacific herring (PCHR), Clupea pallasii
18
277.50 ± 3.70
4.63 ± 0.30
37.42 ± 3.00 −23.79 ± 0.14
2.58
13.00 ± 0.11
2.09
Marine/ brackishb
Cottidae Fourhorn sculpin (FHSC), 105 247.64 ± 5.27 Myoxocephalus quadricornis
3.42 ± 0.02
16.43 ± 1.00 −23.62 ± 0.08
6.7
15.18 ± 0.07
5.53
Marineb
9.94 ± 1.63
−26.84 ± 0.17
1.46
10.26 ± 0.20
1.72
Freshwater/ brackisha
11.94 ± 0.56 −22.87 ± 0.03
1.99
15.47 ± 0.05
3.31
Brackishb
Esocidae Northern pike (NRPK), Esox Lucius Gadidae Saffron cod (SFCD), Eleginus gracilis Burbot (BRBT), Lota lota
9
426.33 ± 53.19 3.18 ± 0.06
129 442.26 ± 2.38
3.33 ± 0.02
9
452.56 ± 87.12 3.42 ± 0.03
7.25 ± 1.20
−25.95 ± 0.51
4.39
10.26 ± 0.36
3.45
Freshwater/ brackishc
Osmeridae Rainbow smelt (RBSM), Osmerus mordax
25
225.08 ± 5.96
3.43 ± 0.04
16.26 ± 1.92 −24.15 ± 0.09
1.85
13.96 ± 0.07
1.27
Anadromousd
Pleuronectidae Arctic flounder (ARFL), Liopsetta glacialis
97
192.89 ± 3.68
3.32 ± 0.01
18.40 ± 1.34 −24.01 ± 0.12
9.84
11.55 ± 0.07
4.45
Brackish/ marine/ freshwaterb
75
275.09 ± 4.60
3.31 ± 0.02
14.13 ± 1.22 −24.85 ± 0.13
5.94
12.42 ± 0.09
4.06
Brackish/ marine/ freshwaterb
74
327.82 ± 7.33
3.65 ± 0.06
28.68 ± 2.38 −23.64 ± 0.17
8.25
12.35 ± 0.10
3.82
Anadromousd
−27.47 ± 0.25 13.57
9.10 ± 0.13
8.79
Anadromousd
Starry flounder (STFL) Platichthys stellatus
Salmonidae Arctic cisco (ARCS), Coregonus autumnalis Broad whitefish (BDWF), C. nasus
117 352.22 ± 10.38 3.45 ± 0.04
19.91v1.27
Lake whitefish (LKWF), C. clupeaformis
113 251.65 ± 8.04
3.31 ± 0.03
13.77 ± 0.88 −25.94 ± 0.17
9.06
10.90 ± 0.10
5.47
Anadromousd
Least cisco (LSCS), C. sardinella
70
3.23 ± 0.02
12.12 ± 2.68 −26.13 ± 0.11 10.96
11.84 ± 0.06
4.87
Anadromousb
Inconnu (INCN), Stenodus leucichthys
86 497.23 ± 10.65 3.28 ± 0.03
10.71 ± 0.88 −26.29 ± 0.09
4.78
12.78 ± 0.08
4.4
Anadromousd
Dolly varden char (DVCH), Salvelinus malma
37 448.62 ± 14.05 6.17 ± 0.31
9.48
13.88 ± 0.13
3.92
Anadromousd
Round whitefish (RDWF), Prosopium cylindraceum
73
11.04 ± 0.57 −25.79 ± 0.25 11.04
9.95 ± 0.11
4.86
Freshwater/d brackish
a
257.24 ± 3.86
131 ± 594.73
321 ± 0.02
N/A
−23.42 ± 0.27
Scott & Crossman (1973); bCoad & Reist (2004); cKottelat & Freyhof (2007); dRiede (2004)
Mar Ecol Prog Ser 559: 159–173, 2016
164
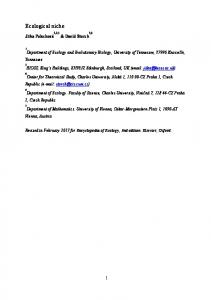
Fig. 2. Stable isotope biplot indicating the mean δ13C and δ15N positions of the 16 fish species captured at Shingle Point. See Table 1 for species names and codes. SE is indicated by error bars
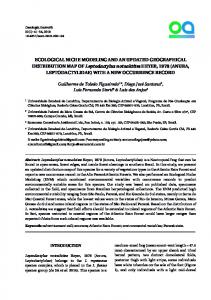
SI-determined groups Based on the SI values (Fig. 2), Ward’s cluster analysis identified 3 ‘isotopic groups’ within among the 16 species (Table 1, Fig. 3). The species in Group A were characterized by more enriched 13C and 15N, and included: fourhorn sculpin Myoxocephalus quadricornis, saffron cod, Pacific herring Clupea pallasii, dolly varden char, and rainbow smelt Osmerus mordax. Group B was characterized by depleted 13C and
Fig. 3. Dendrogram of the 16 fish species captured at Shingle Point, produced from Ward’s cluster analysis using the mean isotopic signatures (δ13C and δ15N) as variables. See Table 1 for species names and codes
lower δ15N ratios and included: broad whitefish, longnose sucker Catostomus catostomus, burbot Lota lota, round whitefish Prosopium cylindraceum, lake whitefish Coregonus clupeaformis, and northern pike Esox lucius., The species in Group C had intermediate δ13C and δ15N compared to the other groups, and included: inconnu Stenodus leucichthys, least cisco Coregonus sardinella, Arctic flounder Liopsetta glacialis, Arctic cisco Coregonus autumnalis and starry flounder Platichthys stellatus (Fig. 4).
Fig. 4. The 95% isotopic ellipses of the 16 species of fish captured at Shingle Point, separated into 3 groups (generated from the Ward’s cluster analysis, see Fig. 3). (a) Group A; (b) Group B; (c) Group C. See Table 1 for species names and codes
Brewster et al.: Niches of Beaufort Sea fish
Isotopic niche assessment Among the 3 isotopically defined groups (Fig. 3), the highest niche overlap was observed between Groups B and C (Table 2, Fig. 4). Probabilistic niche regions (95% level of inclusion) ranged from the narrow niche of rainbow smelt (2.93) to the broad niche of broad whitefish (73.04), (Table 2). The species with the broadest probabilistic 2-dimensional niches were dolly varden char, broad whitefish, and Arctic cisco (Fig. 4). We expected that probability of overlap would be high among all species within each group; however, considerable overlap (i.e. > 50%) was only observed within Group A. All species in Group A overlapped with the large niche region of dolly varden char (24.86), whereas rainbow smelt and saffron cod overlapped considerably with fourhorn sculpin (Table 2, Fig. 4a). The niche region size of Pacific herring (5.61; Table 2) was similar to saffron cod (4.11) and rainbow smelt (2.93). The lower probability of isotopic niche overlap of other Group A species onto the isotopic niches of Pacific herring, rainbow smelt, and saffron cod can be attributed to the narrow δ13C range and δ15N range that was observed for each of these species (Tables 1 & 2). Additionally, the lower δ15N of Pacific herring separated this species from others in Group A (Fig. 4a). The narrow δ13C range for saffron cod and rainbow smelt fell within the larger niche of fourhorn sculpin, which resulted in a 98.48 and 92.02% probability of overlap of saffron cod and rainbow smelt onto fourhorn sculpin, respectively (Table 2). Niche centroids differed among all species (MD > 0.74, p < 0.03 for all). Within a group, the highest probabilities of niche overlap (> 50%)
165
Table 2. Results of the probabilities of niche overlap among the fishes in Groups A, B and C (see Fig. 2 for the corresponding species and Table 1 for abbreviations). The mean probability indicates the probability of Species A niche being found within the niche of Species B. The probability of overlap is indicated by mean and credible intervals (2.5%, 97.5%). The niche overlaps were calculated using α = 0.95. 95% isotopic ellipses or niche region size (α = 0.95) of each species were calculated using isotopic signatures (δ13C and δ15N) and recorded (‰). SI: stable isotope; FA: fatty acid. N/A: information not available Species B (95% niche region size) Group A DVCH (24.86)
Species A
SI mean probability [credible interval]
FA and SI mean probability [credible interval]
FHSC PCHR RBSM SFCD
67.49 [45.15, 88.89] 95.36 [80.75, 99.97] 99.93 [99.36, 100.00] 64.42 [37.05, 91.02]
FHSC (11.45)
DVCH PCHR RBSM SFCD
41.05 [26.87, 56.45] 15.08 [2.47, 37.33] 92.02 [75.68, 99.39] 98.48 [95.86, 99.76]
N/A 16.53 [2.80, 39.00] 92.13 [76.19, 99.60] 98.82 [96.00, 100.00]
PCHR (5.61)
DVCH FHSC RBSM SFCD
32.29 [18.12, 51.22] 5.43 [1.21,15.86] 45.05 [12.37, 87.65] 1.45 [0.08, 7.20]
N/A 6.11 [1.29, 17.40] 47.68 [13.30, 90.70] 0.95 [0.00, 5.50]
RBSM (2.93)
DVCH FHSC PCHR SFCD
26.68 [16.83, 39.12] 20.32 [11.74, 32.57] 22.33 [6.45, 47.37] 3.63 [0.65, 11.29]
N/A 20.36 [12.10, 32.40] 23.70 [6.90, 46.32] 3.23 [0.40, 9.90]
SFCD (4.11)
DVCH FHSC PCHR RBSM
12.72 [7.07, 19.77] 46.73 [38.03, 55.88] 0.88 [0.01, 4.38] 5.40 [0.68, 15.55]
N/A 48.19 [37.79, 58.30] 0.52 [0.00, 2.91] 4.71 [0.40, 16.31]
BRBT LKWF LNSK NRPK RDWF
95.94 [81.95, 99.94] 90.84 [80.97, 97.25] 98.06 [89.92, 99.99] 99.86 [98.66, 100.00] 97.15 [92.44, 99.50]
41.04 [21.48, 61.50] 46.42 [33.76, 59.01] 71.77 [42.38, 93.94] 37.32 [18.37, 58.59] 68.61 [56.19, 80.06]
BRBT (31.23)
BDWF LKWF LNSK NRPK RDWF
48.51 [28.46, 73.80] 77.06 [55.81, 94.38] 79.29 [51.44, 98.04] 98.06 [85.56, 100.00] 77.26 [57.45, 94.52]
0.05 [0.00, 0.13] 0.08 [0.01, 0.20] 0.00 [0.00, 0.00] 0.56 [0.00, 2.06] 0.08 [0.01, 0.21]
LKWF (35.49)
BDWF BRBT LNSK NRPK RDWF
51.34 [40.80, 62.67] 91.59 [72.15, 99.49] 82.07 [59.27, 96.51] 99.50 [95.62,100.00] 85.75 [75.78, 93.43]
36.51 [25.51, 48.15] 69.71 [40.67, 90.66] 81.07 [52.93, 96.99] 77.44 [52.31, 96.06] 80.45 [69.74, 89.19]
LNSK (31.97)
BDWF BRBT LKWF NRPK RDWF
58.46 [39.06, 80.42] 85.00 [57.30, 99.25] 72.20 [47.08, 93.54] 97.77 [83.31,100.00] 81.47 [63.27, 95.88]
0.01 [0.00, 0.04] 0.00 [0.00, 0.00] 0.02 [0.00, 0.07] 0.00 [0.00, 0.02] 0.06 [0.00, 0.15]
NRPK (5.57)
BDWF BRBT LKWF LNSK RDWF
13.34 [6.98, 24.30] 31.70 [13.23, 58.29] 25.65 [14.43, 43.05] 27.69 [11.39, 51.88] 24.68 [14.17, 40.65]
0.00 [0.00, 0.02] 0.03 [0.00, 0.19] 0.01 [0.00, 0.04] 0.00 [0.00, 0.01] 0.01 [0.00, 0.04]
Group B BDWF (73.04)
N/A N/A N/A N/A
Table continued on next page
Mar Ecol Prog Ser 559: 159–173, 2016
166
Table 2 (continued) Species B (95% niche region size) Group B RDWF (36.30)
Species A
SI mean probability [credible interval]
FA and SI mean probability [credible interval]
BDWF BRBT LKWF LNSK NRPK
65.58 [54.37, 76.99] 91.88 [72.90, 99.56] 83.36 [72.23, 92.63] 90.67 [72.44, 99.19] 99.26 [94.01, 100.00]
38.51 [28.11, 49.39] 46.69 [24.01, 69.84] 55.66 [43.87, 67.40] 90.78 [68.74, 99.48] 43.01 [21.82, 67.40]
ARFL INCN LSCS STFL
92.74 [83.69, 98.20] 72.82 [47.99, 92.10] 80.39 [60.10, 94.40] 93.25 [85.60, 98.30]
93.64 [85.69, 98.60] 73.81 [50.09, 92.60] 80.28 [61.69, 95.50] 94.94 [87.60, 99.20]
ARFL (15.71)
ARCS INCN LSCS STFL
73.43 [61.50, 84.30] 27.87 [11.19, 50.91] 72.63 [52.80, 88.40] 73.18 [60.00, 84.71]
67.01 [55.40, 79.30] 23.52 [8.90, 44.10] 70.99 [51.89, 88.01] 72.34 [56.80, 85.60]
INCN (11.62)
ARCS ARFL LSCS STFL
19.00 [10.80, 29.00] 10.57 [5.20, 18.00] 72.20 [56.70, 86.21] 45.54 [32.70, 58.70]
19.17 [11.40, 28.80] 10.19 [4.80, 17.80] 72.23 [55.39, 85.20] 50.06 [36.19, 64.00]
Group C ARCS (23.89)
acterized by a relatively small niche region size (11.62), narrow δ13C range and depleted 13C (Table 1), and higher δ15N relative to other fishes in this group (Fig. 3c). Arctic cisco (23.89), starry flounder (17.62), and Arctic flounder (15.71) had the largest niche regions compared to other Group C species and showed similar δ13C and δ15N ranges (Table 2, Fig. 3c). In turn, this resulted in high probability of finding other Group C species within these isotopic niches. Niche centroids differed among all species (MD < 0.71, p > 0.02 for all).
FA analysis
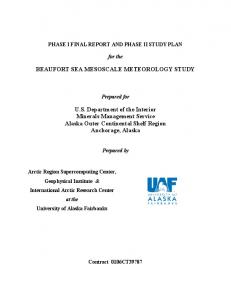
Differences in %TL existed among species (Kruskal-Wallis chisquared = 189.21, df = 14, p < 0.05), ARCS 30.10 [19.30, 43.30] 29.71 [19.09, 42.71] LSCS (9.82) and ranged from (mean ± SE) ARFL 32.67 [21.10, 45.50] 33.16 [21.90, 46.40] 7.25 ± 1.20% for burbot to 37.42 ± INCN 55.24 [40.39, 71.00] 54.68 [40.40, 70.50] STFL 58.08 [43.08, 71.21] 63.45 [47.60, 77.41] 3.00% for Pacific herring (Table 1). STFL (17.62) ARCS 76.34 [63.40, 87.40] 70.14 [57.20, 83.71] Within-species no significant relaARFL 75.56 [61.00, 87.90] 71.61 [53.70, 87.50] tionship was observed between INCN 85.07 [69.40, 95.30] 81.76 [65.50, 93.90] fork length and %TL (r2 < 0.48, p < LSCS 89.77 [78.30, 97.80] 81.37 [66.00, 94.20] 0.97 for all) and between fork length and most FA profiles. Northwere observed among Group B fishes; this was due to ern pike did indicate some relationship between fork similar mean isotopic ratios and similar niche region length and 20:4n6 (r2 = 0.54, p = 0.02); however, this relationship was not strong. sizes (Table 2). Probabilistic niche region sizes were To assess how FAs defined species groups, a CA similar among burbot (31.23), lake whitefish (35.49), was performed on 15 species of fish (n = 1011) prolongnose sucker (31.97), and round whitefish (36.30). cessed for FAs. The total variance of the first and secBroad whitefish and northern pike had the largest ond dimensions of the CA was 57.45%, where the and smallest niche region size 73.04 and 5.57, respecfirst dimension explained 38.67% of the variance and tively (Table 2). Although the isotopic niche for norththe second dimension explained 18.78% of the variern pike is located at the center of all species in Group ance. Dimension 1 illustrated a marine pelagic− B, the small isotopic niche of northern pike (5.57) refreshwater gradient, with the greatest influence on sulted in relatively low probability of other Group B the positive side (+) for Calanus-markers (pelagic), species overlapping onto the northern pike niche and docosahexaenoic acid (DHA, 22:6n3) and palmi(Fig. 4b, Table 2). Differences among Group B niche toleic acid (16:1n7) on the negative side (−) (Fig. 5a). centroids only existed between broad whitefish and Pacific herring and Arctic cisco were most associated both lake whitefish (MD = 2.49, p = 0.00) and round with the positive dimension 1. This was consistent whitefish (MD = 1.70, p = 0.00), and between lake with the high content of Calanus-markers in these whitefish and longnose sucker (MD = 1.66, p = 0.00), species (~12−23% of total FAs for Arctic cisco and northern pike (MD = 1.32, p < 0.01), and round whitePacific herring, respectively). Calanus-markers were fish (MD = 1.01, p = 0.00). also found in inconnu, least cisco, and round whiteHigh probability of niche overlap was observed fish tissues, but to a lesser extent (~1−7%, Table S2 in among most fishes in Group C with the exception of the Supplement) (Fig. 5b). inconnu (see Group C in Table 2). Inconnu were char-
Brewster et al.: Niches of Beaufort Sea fish
167
Fig. 5. Correspondence analysis on the (a) 25 fatty acid signatures of (b) 15 species of fish captured at Shingle Point. Bars represent SE for each species and were included to represent the spread of individuals within each species. See Table 1 for species names and codes
The second dimension of the CA was characterized by DHA, Calanus-markers, oleic acid (18:1n9), linoleic acid (18:2n6), and alpha-linoleic acid (18:3n3) (Fig. 5a). Lake whitefish, followed by least cisco and Arctic cisco, were most associated with the second dimension (5b). Results indicate that (1) Arctic flounder and starry flounder were highly associated with the benthic marker NMI (2) burbot was highly associated with the FA arachidonic acid (20:4n6) (3) broad whitefish, lake whitefish, and round whitefish had relatively higher proportions of 18:2n6 and 18:3n3 (Table S2 in the Supplement, Fig. 5a), and (4) Pacific herring and starry flounder had the highest proportions of 16:1n7 (Table S2) and Pacific herring had the lowest proportions of DHA.
found in these fishes (Table 3) suggest feeding in both pelagic and benthic zones. Fish species in Group 3 (broad whitefish, round whitefish, lake whitefish, and longnose sucker) were characterized by high proportions of heneicosapentaenoic acid (21:5n3) and 18:2n6 and low proportions of Calanus-markers (Table 3). High proportions of 21:5n3 and low proportions of DHA characterized the FA composition of Group 4 (fourhorn sculpin, Arctic flounder, starry flounder; Table 3).
Groups inferred from FA analysis A hierarchical analysis on the first 2 dimensions of the CA identified groups of species based on similarities of FA signatures. Five groups were identified (Fig. 6) using the 25 FA profiles described earlier for each species. The FA composition of the one fish species (Pacific herring) in Group 1 was characterized by high proportions of Calanus-markers and low proportions of the essential FA DHA (Table 3). Group 2 (also 1 species; burbot) was characterized by high proportions of 20:3n6 and 20:2n6, followed by 20:4n6, and low proportions of 16:1n7 (Table 3). The proportions of FA were not distinct enough to describe diets of fish within Group 5 (rainbow smelt, northern pike, least cisco, inconnu, saffron cod, and Arctic cisco); however, higher levels of Calanus-markers (compared to Groups 2, 3, and 4) and combined benthic markers
Fig. 6. Hierarchical Ward’s cluster analysis performed on a correspondence analysis of 25 fatty acid profiles. The 15 species of fish were grouped based on similarities using the mean fatty acid compositions. The 5 groups were characterized by high fatty acid (+) and low fatty acid (−) proportions indicated by the v-test (Table 3). See Table 1 for species names and codes
Mar Ecol Prog Ser 559: 159–173, 2016
168
Table 3. Results from the Ward’s cluster and correspondence analysis on fatty acid (FA) profiles. The 15 species of fish were used and grouped based on similar FA signatures. Groups 1, 2, 3, 4, and 5 are characterized by the highest to lowest proportions of FA, indicated by the highest to lowest (−) v-test values, respectively. Inf: infinite values FA cluster group
Species
FA
v-test
p
Group 1
Pacific herring
Calanus 22:6n3
5.86 –2.81
0 0
Group 2
Burbot
20:3n6 20:2n6 20:4n6 16:1n7
Inf Inf 3.19 −2.44
0 0 0 0.01
Group 3
Broad whitefish, round whitefish, lake whitefish, longnose sucker
21:5n3 18:2n6 Calanus
Inf 2.05 −4.71
0 0 0
Group 4
Fourhorn sculpin, Arctic flounder, starry flounder
21:5n3 22:6n3
Inf −2.40
Group 5
Rainbow smelt, northern pike, least cisco, inconnu, saffron cod, Arctic cisco
Null
FA and SI group niche assessment Probabilities of niche overlap within the 3 isotopic groups previously identified by the cluster analysis (Fig. 3) were re-analyzed with SI and FA data combined. The dietary FA signatures that characterized the 5 FA groups: 20:3n6, 20:2n6, 18:2n6, 21:5n3, 22:6n3, and Calanus-markers (Table 3) were combined with the isotopic data, and probabilities of niche overlap were re-calculated using a total of 8 dimensions of data. The probabilities of niche overlap using SI and FA data together only marginally differed from the results of the overlap in Groups A and C previously determined using only SI data (Table 2). For Group B, the probability of niche overlap decreased considerably when key dietary FA profiles were combined with SI data (Table 2). SI data alone indicated that Group B had the highest niche overlap among species, but when FA data were included, high (> 50%) niche overlap was restricted to various combinations of longnose sucker, burbot, northern pike, and the 3 species of whitefish (Table 2).
DISCUSSION Characterizing diet and habitat ecology of cooccurring freshwater, coastal, and anadromous fishes in summer Beaufort Sea coastal environments will further our understanding of prey sources and partitioning of resources in the study species and environ-
ment (Post 2003, Layman et al. 2007, Swanson et al. 2015). These results may be used to indicate future shifts in species-specific niches, understand implications of climate change on important habitat features (Carmack & Macdonald 2002, Kelly & Scheibling 2012), develop monitoring programs, and inform testable hypotheses for competitive interactions among species.
Habitat and diet niche overlap
Three distinct isotopic groups and 5 FA-based dietary groups identified the general habitat and feeding Null Null ecologies of the 16 fish species studied. The δ13C ranges and δ15N ranges found here suggest that these species are feeding across a range of salinities, in both pelagic and benthic habitats, and that the species assemblage examined represents approximately 2 trophic levels (Post 2002, Hill et al. 2006, Cherel et al. 2011). FA analyses further demonstrated the importance and heavy reliance on benthic prey sources. We recognize potential problems when interpreting dietary FAs from species with low %TL (