Economic Structure, Trade Openness, and Gendered Employment in Sub-‐Saharan Africa Evelyn Wamboye Business Department Pennsylvania State University DuBois, PA 15801 USA
[email protected] Stephanie Seguino Department of Economics University of Vermont Burlington, VT 05401 USA
[email protected] December 15, 2012 Abstract More than thirty years into the third era of globalization, scholars are in a position to evaluate the distributive effects of the policy shifts that have led to greater economic integration. One region of the world for which there is little robust empirical evidence on gendered employment effects is sub-‐Saharan Africa (SSA). This paper empirically explores these issues for 38 SSA countries, and for two sub-‐groups (mineral exporters and non-‐oil non-‐mineral exporters). Our purpose is to identify whether there is an impact of economic and trade structure on women’s relative access to work. We use fixed effects (FE) and two stage least squares (TSLS) estimation techniques on an unbalanced panel data for the period of 1991-‐2010. Our findings suggest that trade liberalization has gendered employment effects, with the direction depending on the structure of the economy. However, the more robust finding is that a country’s infrastructure plays a determining role in gendered labor market outcomes in SSA since the early 1990s. Key words: Trade, economic structure, gender, employment, sub-‐Saharan Africa. JEL code: F14, F15, F16, J21.
Economic Structure, Trade Openness, and Gendered Employment in Sub-‐Saharan Africa
I.
Introduction
More than thirty years into the third era of globalization, scholars are in a position
to evaluate the distributive effects of those policy shifts that have led to greater economic integration. Feminists have made a major contribution to the literature, evaluating the effects of liberalization of trade, investment, and finance on several aspects of women’s absolute and relative well-‐being (Irene van Staveren, Diane Elson, Caren Grown, and Nilufer Cagatay 2007). Gender effects are complex. There is evidence, for example, that semi-‐industrialized countries have registered rapid gains in women’s share of employment but conditions of work have tended to be precarious (Lourdes Benería 2003), and employment gains have reversed as countries move up the industrial ladder (Sheba Tejani and William Milberg 2010).
One region of the world for which there is as yet little robust empirical evidence on
gendered employment effects is sub-‐Saharan Africa (SSA). Women in low-‐income agricultural economies in SSA tend to be concentrated in subsistence agriculture, to a lesser extent in agro-‐processing in the manufacturing sector, and in informal sector work. The latter concentration is more indicative of residual unemployment than of a livelihood choice (Jorge Arbache, Alexandra Kolev, and Ewa Filipina 2010). Men are more likely to obtain their livelihood in export sectors such as cash crops and mineral extraction. Economic roles tend to be relatively rigid, and women lack the resources to respond to
2
incentives to export, suggesting that labor is relatively immobile between sectors (World Bank 2012).
Given rigid gender roles, the structure of gender job segregation in the export
sector, and women’s lack of resources to facilitate labor mobility between sectors in SSA, one possibility is that men’s employment opportunities may have increased more than women’s in contrast to outcomes in semi-‐industrialized economies. The effect of trade integration will also depend on how import liberalization impacts women’s employment opportunities. Insofar as imported goods compete with the types of goods women produce as subsistence farmers, rural waged workers, or in the manufacturing sector, we might expect negative effects on women’s income-‐generating opportunities. That said, if over time, economies adapt and labor supply adjusts to new opportunities, and if in fact growth is stimulated by economic integration, the longer run effects on women’s economic opportunities may be positive.
This paper empirically explores these issues for 38 SSA economies and for two sub-‐
groups of non-‐oil producing SSA countries – mineral exporters and non-‐mineral exporters – using fixed effects (FE) and two stage least squares (TSLS) estimation techniques. Our purpose in analyzing gendered employment effects in this way is to identify whether there is an impact of economic and export structure on women’s relative and absolute access to work. We also explore the gender impact of physical infrastructure via its potential to reduce their unpaid care work, freeing time to spend in employment. Our results show that while trade has significant effects – largely negative – infrastructure has a strong positive effect on women’s relative and absolute employment. Our results are robust to different estimation techniques, model specifications, and samples.
3
II. Background and Literature Review The 1980s witnessed an era of trade, investment, and financial liberalization for many developing countries. The goal of this significant macroeconomic policy shift away from targeted subsidies, managed exchange rates, and import protection was to promote competitiveness in global markets, and thus to shift the structure of production away from domestic production towards exports. If successful, proponents argued, these policies would successfully address balance of payments problems and stimulate economic growth, with employment also expanding.
In sub-‐Saharan Africa, as in other developing countries, the structural adjustment
programs that have shaped macroeconomic policy and performance since the 1980s include real currency depreciation, import tariff and non-‐tariff barrier reductions, accompanied by liberalization of foreign direct investment (FDI). In addition, in the earlier years of liberalization, International Monetary Fund (IMF) and World Bank conditionalities included cuts to public sector budgets and thus employment, with impacts on food subsidies, health care facilities, and education. The recommendations of these international financial institutions (IFIs) were premised on the view that sub-‐Saharan’s economic future depended on an outward-‐oriented program of raw materials exports.
In response, tariff rates fell by 50% from 1985 to early 2000s in SSA. There is some
variation across countries in the extent of tariff reduction (although no particular pattern by economic structure). For example, in West Africa, tariffs averaged 38% in the mid-‐1980s as compared to 20% in southern Africa (Babatunde, Musibau Adetunji 2009). By the end of the 2000s, the median tariff for all SSA was 13%, but South Africa and Mauritius are outliers, with tariffs averaging 8% and 7%, respectively.1 Despite extensive tariff reduction,
4
SSA’s share of global trade has steadily fallen from 3.3% in the 1970s to just 1.8% in the late 2000s. Of particular note is that SSA’s agricultural exports have precipitously declined from over one quarter of merchandise exports in the 1980s to just 15% in the 2000s (UNCTAD 2009).
Liberalization was also intended to spur foreign direct investment (FDI) in SSA. But
this did not materialize. FDI to SSA as a share of total developing country FDI fell substantially from the 1980s onward, from 21% in the 1970s to just 11% in the 2000s. Most FDI in SSA went to oil-‐exporting and resource-‐rich countries, particularly Angola, Nigeria, and South Africa (Jomo Kwame Sundaram, Oliver Schwank, and Rudiger von Arnim 2011). There is some evidence that lack of diversification of the export structure in some SSA economies has also contributed to volatility in foreign exchange earnings, dampening the benefits that such liberalization might otherwise offer (Michael Bleaney and David Greenaway 2001).
Even if trade and growth were stimulated as a result of liberalization, women might
not benefit absolutely or relatively. Research on the gender effects of openness in SSA has emphasized the (negative) impact of declines in public sector spending on women’s well-‐ being, resulting from privatization and decreased public sector spending in part attributable to the decline in tariff revenues (Christina Gladwin 1991). Cuts in social spending and infrastructure investments can have a negative impact on women’s unpaid labor time, girls’ access to schooling, and maternal mortality, with implications for labor market participation.
In one of the few cross-‐country econometric studies on this topic, Mina Baliamoune-‐
Lutz (2007) explores the effect of trade liberalization on gender equality of literacy in the
5
SSA region compared to non-‐SSA developing countries. The author conducts a cross-‐ country analysis employing OLS and three-‐stage least squares estimations to account for potential endogeneity of trade and growth. She presents robust statistical evidence that higher integration into world markets causes gender inequality of literacy to increase in SSA.
The channels by which openness affects women’s absolute and relative employment
outcomes differ from the transmission mechanisms of literacy. Mainstream trade theory hypothesizes that liberalization stimulates growth, which may result in an increase in women’s employment and share of employment. However, even in the absence of growth effects from trade openness, there may be gendered employment effects due to the different distributions of men and women across tradable and nontradable sectors. This, coupled with the rigidity of gender roles that inhibit substitutability between male and female labor, suggests the potential for gendered effects of trade liberalization, although those effects may or may not contribute to gender equality.
A number of country-‐level studies have been conducted on the gendered
employment effects of trade liberalization in SSA-‐type economies. A general finding is that men are more likely to benefit from trade liberalization due to their concentration in natural resource extraction industries (Maurizio Bussolo and Rafael De Hoyos 2009; Marzia Fontana 2007; Elissa Braunstein 2012). In several African economies where the manufacturing sector is less competitive than in the Asia region, empirical evidence shows that a reduction in tariffs on labor-‐intensive imports has hurt women’s employment relatively more than men’s (Ratnakar Adhikari and Yumiko Yamamoto 2006; David Kucera and Leanne Roncolato 2011).
6
Among the few global cross-‐country studies on the labor effects of globalization,
Lisa Meyer (2006) examines the effect of liberalization on female labor force participation (but not gender equality of labor force participation) for the period 1970-‐95. The author obtains contradictory results and concludes they are not robust enough to draw firm conclusions. The failure to obtain consistent results may be due to an analysis that does not differentiate effects on countries with very different structures of production and trade. This may make it difficult to discern labor force participation effects, given that gender employment distribution across sectors is a function of the structure of the economy. Gendered labor market effects of globalization may in fact differ according to economic structure and trade composition. In exporting sectors that are female-‐dominated in employment, we would expect openness to increase women’s access to employment, absolutely and relative to men. Typically, we have observed this effect in countries whose shift to an export orientation resulted in an expansion of labor-‐intensive manufacturing (Guy Standing 1989; Günseli Berik 2000; Naila Kabeer 2000).
In general, male workers in SSA tend to be concentrated in primary commodity and
cash crop production (FAO 2011). In particular, men are heavily represented as employees in ore and mineral extraction and in the production of export crops such as coffee and cocoa. This stylized fact does not imply women do not participate in cash crop production. Rather, women’s cash crop plots tend to be smaller and have lower yields than men’s due to resource constraints, including access to credit for the purchase of inputs and means to travel to market (Ruth Vargas Hill and Marcella Vigneri 2011; FAO 2012 ). In Ghana, for example, women only represent 20 percent of cocoa farmers (Marcella Vigneri and Rebecca
7
Holmes 2009). In other cases, such as in Uganda, while both men and women work on cash crop production, men decide how the resulting income should be spent (IFAD 2000). Table 1 shows the sectoral female share of employment for SSA countries for which such data are available. Women’s share of employment is substantially lower on average in the mining and quarrying sector (20.5%) than in agriculture or manufacturing, although there is wide variation across countries. In contrast, the female share of agriculture is 40.5%, while in manufacturing, the share is 39.5%. The relatively high share of females in manufacturing is in part explained by the labor-‐intensive nature of this sector in much of SSA. (Table 1 about here). Although on the surface, it is tempting to hypothesize that men may differentially benefit from trade expansion in SSA, the shift to an outward orientation may lead to men hire women, including female family members, to work on their cash crop plots (William Darity, Jr 1995). This possibility is supported by evidence that a large share of women engage in waged labor in the rural sector of many SSA countries (John Sender, Carlos Oya, and Christopher Cramer 2006; Carlos Oya and John Sender 2009). Women’s employment may therefore also rise in response to an expansion of exports, which may or may not come at the cost of reduced labor on subsistence plots. Moreover, although trade liberalization has had a negative effect on textile manufacturing in a number of SSA countries and thus women’s employment, non-‐ traditional agricultural exports (NTAEs) are an increasing (though small) share of exports, and tend to employ female workers. To the extent that agricultural exports increase in response to trade liberalization, we might expect women’s employment opportunities in
8
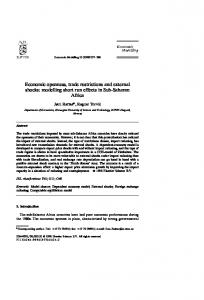
agro-‐processing to improve. It thus remains an empirical question as to whether women’s absolute and relative job opportunities have increased as a result of trade liberalization in SSA. This study’s contribution to the literature is the analysis of the gendered determinants of employment in 38 SSA economies. Our analysis compares outcomes in oil exporting countries and two groups of non-‐oil exporters: mineral exporters (MECs), and non-‐mineral exporters (NMEs), reflective of differential resource endowments in this region. Countries are categorized as follows. Those countries in our sample that are not oil exporters are classified according to the share of ores and minerals in exports. Those countries above the SSA share of 10% are categorized as MECs and those below as NMECs. Table A.1 in the appendix identifies countries in our sample according to their oil, MEC, or NMEC status. To give a sense of the different export structures of these countries, for oil exporting countries, the mean share of fuel in merchandise exports over the period 1960-‐ 2010 is 32%. Ores and minerals are a small share of their exports at 7.5%. In contrast, the mean share of ores and minerals in exports in MECs averaged over 1960-‐2010 is 29.9% compared to 1.2% in NMECs.2 The dependent variables in our analysis are a) the female minus the male employment-‐to-‐population rate for those 15 years and over and b) the female employment rate. (In the econometric analysis, both variables are measured in natural logs). Note that the former dependent variable is measured such that a larger gap indicates greater gender equality in employment, though this does not allow us to differentiate whether improvements are due to higher female employment rates or lower male employment rates. Panel A in Figure 1 offers a graphical representation of trends in this variable since
9
1991 (the first year for which cross-‐country SSA data are available) to 2010. The female-‐ male gap has widened (women’s employment rates have increased more than men’s) over this period in each group of countries. The gap has widened the most in NMECs (5.1 percentage points), compared to an average of 4.4 percentage points in oil exporting countries and 3.5 percentage points in MECs. Panel B exhibits secular trends in the female employment rate in each group of countries. Note the significantly higher female employment rate in NMECs and MECs as compared to oil exporting countries. (Figure 1 about here). We want to underscore that any evidence of a positive effect of increased trade volume on women’s employment does not necessarily infer an improvement in relative well-‐being. In many countries, as noted, the direct effects of liberalization of trade on employment are contemporaneous with cuts in public sector spending in education, health, food and agriculture subsidies, and infrastructure. This in turn can lead to “distress” sales of female labor in order to replace lost income from other sources. In that case, an increase in women’s employment may signal a decline, not improvement, in well-‐being. Moreover, should the ratio of female to male employment rise with trade liberalization, this is no guarantee that women’s relative time poverty attenuates, or that there is sufficient time for the household to contribute the desired amount of time to reproductive labor. II. Structures of Production, Employment, and Trade, and Macroeconomic Performance We preface our analysis of gendered employment effects of trade integration with a description of the structure of SSA economies and an exploration of trade and macroeconomic trends.
10
2.1. Structure of production
Services is the largest sector in SSA countries, contributing roughly half of value-‐added to GDP in 2009. In oil exporting SSA economies, however, services is somewhat lower at 37.9% of GDP (Table 2). The agricultural sector is nevertheless considered the backbone of most sub-‐Saharan economies, employing the majority of workers, regardless of economic structure. The greatest structural difference is observed in the share of industrial sector, and more specifically, non-‐manufacturing industry value-‐added as a share of GDP. That sector is 21.9% of GDP in MECs compared to only 9.8% in NMECs. In contrast, the manufacturing sector, a subset of the industrial sector (with a tendency to be more female-‐ intensive in employment), contributes more to GDP in NMECs (13.4%) than in MECs (9.2%) or oil exporters (10.2%).
In addition to data on sectoral employment shares, Table 2 also provides
information on employment shares of all workers, as well as the ratio of female to male employment by sector, from 1991 to 2009. As can be seen, the largest share of workers – fully two thirds – is employed in the agricultural sector in NMECs as compared to the other groups. However, in all groups, agriculture is only marginally female-‐dominated. In contrast, the industrial sector is male-‐dominated, and substantially more so in MECs. Finally, between a quarter to one third of all workers are employed in the services sector, a female-‐dominated sector in all groups. (Table 2 about here).
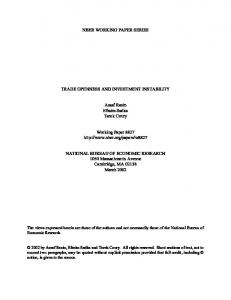
The structure of production in SSA has shifted substantially over the 1960-‐2010
period. Figure 2 compares trends in value-‐added as a percentage of GDP by sector. Panel A shows a steady decline in agriculture as a share of GDP since the mid-‐1960s, despite the
11
expectation that trade liberalization might expand the demand for agricultural exports and therefore output. The service sector in SSA and other developing countries is typically associated with informal sector employment, much of which is disguised or residual unemployment. Services as a share of GDP has been rising in both MECs and NMECs, though by the early 1990s, the growth in this sector’s share was more accentuated in NMECs. (Services also includes public sector employment, but given the decline in public sector budgets in much of SSA, it is not possible to attribute the rising share of this sector in GDP to public sector output growth). In contrast, the share of this sector in GDP has fallen since 1975 for oil exporters. (Figure 2 about here). As Panel C in Figure 2 suggests, non-‐manufacturing industrial output as share of GDP began to increase in MECs and oil exporters by 1990. Its share is significantly lower in NMECs, and has been less variable than in the other groups, but also shows a very modest increase since the early 1990s. These trends coincide with trade liberalization that began in the mid-‐to late-‐1980s in many SSA countries. The manufacturing sector, in contrast, demonstrates a significant divergence in structural trends between oil exporters, MECs and NMECs (Panel D). While in oil exporters and MECs, the onset of trade liberalization is contemporaneous with a decline in manufacturing’s share of GDP, in NMECs, a continued upward trend is evident. That upward trend, however, is very anemic, and bodes poorly for future economic growth insofar as the manufacturing sector is often the driver of economy-‐ wide productivity growth (José Antonio, Codrina Rada, and Lance Taylor 2009).
2.2 Trends in Imports and Exports 12
Similar to many developing countries, trade policy reforms started in the mid to late 1980s in SSA as part of the overall structural and macroeconomic policy reforms induced by World Bank conditionality on loans. These reforms entailed elimination of all subsidies for exports and the reduction of import tariffs as well as their restructuring to a more simplified form. In response to these policy shifts, an upward trend in the ratio of exports and imports to GDP is evident in all three groups of countries (Figure 3, Panel A).
As Panel B in Figure 3 shows, however, all groups had suffered from widening trade
deficits prior to the liberalization period, and liberalization has not improved that state of affairs for NMECs and MECs. The emergence of a large trade imbalance in these two groups was initially in part related to the rising price of foreign crude oil imports, and continued as a result of fluctuating primary commodity prices on the world markets. While oil exporting countries have fared better, they demonstrate remarkable volatility in the current account balance.
To understand these trends in more detail, we examine the shift in the structure of
exports and imports in three key areas – food, ores, and manufacturing. These three sectors are particularly important to our analysis insofar as trends will have an impact on female and male employment, with women more likely to be involved in food and manufacturing production (agro-‐processing) while men are more concentrated in ores and minerals.
Net food exports as a percentage of all merchandise exports have been in decline in
all groups since 1962 (Figure 4, Panel A). That downward trend slowed by the early 1990s in NMECs and oil exporters but continued in MECs. Net manufacturing exports as percentage of total net merchandise exports have experienced a secular increase since 1962 (although still in deficit), with a brief interruption in the early 1990s in NMECs (Panel
13
B). Finally, in Panel C, there is a notably volatile secular increase in net ore exports in MECs in contrast to stagnant trends in NMECs and oil exporters since 1992 where net ore exports are close to zero.
(Figures 3 and 4 about here).
2.3. Trends in Macroeconomic Performance
Trends in trade openness and composition of output and net exports describe a country’s economic structure. It is also useful to look at per capita GDP growth, which partially reflects demand-‐side effects of trade. Long-‐run growth trends (estimated using a Hodrick-‐ Prescott filter) over the period 1960 to 2010 vary widely (Figure 5). Growth rates registered a notable downturn in the 1980s in all groups, contemporaneous with trade liberalization. Subsequently, growth rates have shown an upward trend with oil exporters outperforming MECs and NMECs by the 2000s. Average growth rates are, however, extremely low by developing country standards, averaging 0.5% per annum for the 38 SSA countries in our sample from 1985-‐2010, compared to a rate of 0.7% in the pre-‐ liberalization post-‐independence era.3 (Figure 5 about here).
The data provided in this section reflect the differing structures and structural
changes of these three groups of countries. These, coupled with gender differences in patterns of employment, underscore the relevance of evaluating the impact of trade liberalization according to SSA countries’ economic and trade structure.
14
III. Gendered Employment Effects of Trade Liberalization: Methodology and Empirical Results
3.1 Empirical Model
In the empirical analysis, we investigate whether economic integration has led to an increase in women’s relative employment in SSA countries. The empirical model identifies four categories of factors that affect the female-‐male employment rate gap: 1) GDP growth, 2) physical infrastructure, which affects women’s care burden and thus female labor supply, 3) the degree of global integration, and 4) economic structure. We discuss each of these in turn.
We include the growth rate of real GDP per capita to account for the effects of
aggregate demand on gendered employment. The direction of the effect of aggregate demand on female-‐male employment gap may vary. For example, evidence from South Africa, Mexico, and Argentina shows that women engage in distress sales of labor in times of economic hardship. This countercyclical surge arises due to the decrease in household income from male breadwinners (Mercedes Gonzalez de la Rocha 1988; Marcella Cerrutti 2000; Daniela Casale 2004; Carmen Diana Deere 2005). On the other hand, with economic growth, women may have increased relative job opportunities due to their lower wages.
We also control for influences on women’s relative labor supply. The unpaid care
burden, which can constrain women’s ability to participate in production, is influenced by a country’s physical infrastructure. Electrification, clean water, transport, and communication infrastructure help to lessen the time women spend in unpaid labor (Pierre-‐Richard Agénor, Otaviano Canuto, and Luiz Pereira da Silva 2010). In our estimations, we capture infrastructure with two variables – the percentage of the
15
population with access to improved sanitation facilities and telephone lines per 100 people.
Improved sanitation is expected to have a positive effect on the gap between female
and male employment through, for example, improved overall health outcomes and reduced time spent by women as caregivers. The effect of telephone lines on relative access to employment is indirect, and this variable proxies for other direct measures of time-‐ saving infrastructure improvements for which data are more sparse – roads, electricity consumption, and births attended by skilled health personnel (the latter is a measure of social rather than physical infrastructure). For the 38 countries in our sample, the correlations of telephones with roads, electricity consumption, and births attended by skilled health personnel, respectively, are 0.257, 0.902, and 0.638.
As the literature has noted, policies that contribute to global economic integration
can affect the structure of production as well as employment opportunities by, for example, shifting productive economic resources from the non-‐tradables sector to the tradables sector. Although it would be ideal to have time series trade policy data on tariffs and non-‐ tariff trade barriers (NTBs), such data are not widely available.4 We therefore rely on outcome measures. In particular, economic integration is measured as trade’s share of GDP (the sum of exports and imports as a % GDP), and in separate regressions, we disaggregate this variable, using exports and imports as a percentage of GDP.
There are two reasons for which we are motivated to measure the effects of imports
and exports separately. Entering exports and imports as separate arguments allows for net exports to be negative (thereby capturing the demand-‐side effects of trade openness), even if trade as a percentage of GDP is positive. Second, research has identified export sectors in developing countries as feminized due to their low-‐skill labor intensity and women’s
16
relatively lower wages (Standing 1989). Nonetheless, the group of countries in this study is unique in the sense that besides being net importers, their export sectors are characterized by primary commodity production and agriculture-‐based manufacturing, with potentially different effects on gendered employment. The sign of the coefficients on exports and imports is therefore unpredicted prior to our empirical investigation.
Finally, we use manufacturing and agriculture value-‐added as a share of GDP to
capture gender employment effects arising from changes in sectoral demand and in economic structure. Given the intensity of women’s employment in the agricultural and manufacturing sectors, we might expect that an increase in agriculture and manufacturing in GDP would widen the female-‐male employment gap. We would therefore expect positive signs on the coefficients of these two variables.
Based on this discussion, our estimated equation for the determinants of the
female-‐male employment gap is: lnGapit = ! + "1Grit + "2 ln Sanit + "3 lnTelit + " 4 lnTradeit + "5 ln Mfgit + "6 ln Agit + #it (1) where ln is the natural log, Gap is the female minus the male employment-‐to-‐population rate in country i at time t, Gr is the growth rate of GDP per capita, San is the percentage of the population with improved sanitation facilities, Tel is the number of telephone lines per 100 people, Trade is the sum of exports and imports as a percentage of GDP, Mfg and Ag are manufacturing and agriculture value-‐added as percentages of GDP, respectively, and ε is the error term. We run another set of regressions where we substitute exports (X) and imports (M) for the trade variable.
17
3.2 Data and Econometric Results
Data are taken from World Bank’s World Development Indicators and African Development Indicators, with employment variables drawn from the ILO’s Key Indicators of the Labor Market database. Descriptions and data sources of the model variables are shown in Table A.2. Descriptive statistics of all variables used in our analysis are provided in Table A.3.5
We use two estimation methods in our analysis: fixed effects (FE) and two stage
least squares (TSLS) on an unbalanced panel for the period 1991-‐2010. Fixed effects estimation captures country-‐specific factors influencing gendered employment not otherwise captured by the independent variables. One assumption of the FE model is that the time variant characteristics are unique to each country and that they are not correlated with another country’s characteristics. This assumption holds if the countries’ error terms are not correlated. However, if the error terms are correlated, the assumption does not hold and the FE model cannot be used. Consequently, we conduct the Hausman specification test in order to determine whether to use random or fixed effects. The test rejects the null hypothesis that the difference in random and fixed effects coefficients are not systematic, thereby affirming fixed effects as the model of choice. To control for potential heteroskedasticity, we report results based on robust standard errors. TSLS estimation is added as a robustness check and to account for potential endogeneity of explanatory variables. In particular, as the gender and growth literature has shown, the degree of gender equality may itself influence the rate of economic growth (Stephanie Seguino 2000; Stephan Klasen and Francesca Lamanna 2009; Amarakoon Bandara 2012), and may also respond to changes in the trade share. We therefore instrument GDP growth in the TSLS estimations with the growth rate of gross fixed capital
18
formation, the growth rate of OECD economies to capture trade effects, 6 the gap between the female and male labor force participation rates, and the ratio of female to male primary education. The latter two variables are measured in natural logs. Standard with instrumental variable estimation techniques, we calculate both the Cragg-‐Donald Wald F and the Sargan statistics to test for weak instruments and overidentifying restrictions. Each of the regressions produced test statistics that exceeded the relevant critical values, indicating that instruments are sufficiently strong and the regressions are not overidentified.
In the baseline regressions, the female-‐male employment gap is specified as a
function of the independent variables outlined in equation (1). We use three sets of data: (1) the full sample of 38 SSA countries, including 6 oil exporters, (2) 15 NMECs, and (3) 17 MECs. Because of the small sample size of the oil exporting countries, we do not provide separate regressions for this group.7 Table 3 reports the results for female-‐male employment rate gap effects of trade, controlling for other factors that affect the employment gap. In Table 4, we report results from disaggregating trade with exports and imports entered as separate arguments, followed by results from further disaggregation to sub-‐categories of exports and imports.
(Table 3 about here). GDP per capita growth rates capture the employment effects of changes in aggregate demand. While aggregate employment rates are typically pro-‐cyclical, gendered effects have been found to vary across countries. In the recent financial crisis, for example, male employment rates fell more than female rates in the United States, whereas in some developing countries that export labor-‐intensive manufactures, women’s employment was
19
more negatively affected. Our results suggest counter-‐cyclical movements in the female-‐ male employment gap in the full sample, but only in the TSLS regression. The coefficient on this variable is neutral in the NMECS and MECs, regardless of the model specification. The apparent counter-‐cyclical movements reflected in the full sample, but absent in the subsamples, might be due to the inclusion of the oil exporting countries. The coefficients on sanitation access, one of our infrastructure development proxies, are significant and positive across all model specifications for the full sample and NMECs. A 10% increase in the share of the population with access to improved sanitation facilities, for example, improves women’s relative employment by 0.23 – 0.4% in the full sample, and 0.78 – 0.83% in NMECs. The effect, in contrast, is negative but only in the TSLS results for MECs. Telephone lines, our second infrastructure proxy, is also significant, and is positive for all samples, with a 10% increase in telephone lines per 100 people contributing to a 0.3– 0.5% increase in the female-‐male employment gap (in favor of women’s employment). This is consistent with the hypothesis that better infrastructure has differentially positive effects on women’s employment chances, possibly via a reduction in women’s unpaid care burden. The regression results indicate that increased global integration as measured by trade’s share in GDP has no significant effect on the female-‐male employment gap in the full sample (Table 3, columns 1 and 2). However, when we consider NMECs and MECs separately, we find contradictory effects of the trade share of the female-‐male employment gap. Those effects are negative in NMECs, a result that holds both in the FE and TSLS estimations, while they are positive in MECs but only in the TSLS estimation. In other words, if the share of trade in GDP increases by 10%, the disparity in female-‐male
20
employment disparity will narrow (in favor of men’s employment) by approximately 0.78 – 0.97% in NMECs, but widen by 0.5% in MECs. These results differ from what might be expected. In MECs where mining is a larger share of GDP and is a male-‐dominated sector, we would have expected a negative effect on the female-‐male employment gap. Apart from this unexpected result, the fact that the results differ between these two groups underscores the relevance of exploring trade effects by economic structure. Finally, manufacturing and agriculture shares in GDP are used to measure effects of changes in sectoral demand. As the share of manufacturing in GDP rises in NMECs, the employment gap widens in favor of women, but in MECs, the opposite is the case, only in the TSLS regressions. This result for NMECs is expected since manufacturing in that group tends to be both labor-‐intensive goods production (such as garments in Mauritius) as well as agro-‐processing. The case of MECs is different, insofar as manufacturing as a share of GDP has been falling since the early 1990s. The negative coefficient on this variable would imply that women’s employment in this sector has fallen more than men’s, as a result.
Agriculture, on the other hand, has a negative effect in the TSLS regressions across
all samples. In contrast, effects are insignificant in the FE models. One way to interpret these results is that, as the agricultural sector has shrunk in SSA, women’s employment rates are again more negatively affected. This might suggest that contract farming and cash crop exports, both stimulated by trade liberalization, have resulted in more employment opportunities for men than women, despite women’s participation as workers in the non-‐ traditional export (NTAE) sector.8
21
When trade is disaggregated into imports and exports (Table 4), the effects of economic growth differ, with growth having a positive effect on the employment gap but only in NMECs and only in the TSLS regressions. Our measures of physical infrastructure, sanitation and telephone lines, continue to have positive significant effects across samples in the TSLS regressions. The expansion of exports as a share of GDP has a negative effect on the female-‐male employment gap in all regressions across all samples. That is, men’s job advantage widens with export expansion. For example, if the share of exports in GDP is increased by 10%, the female-‐male employment disparity will narrow by roughly 0.3% in the full sample, between 0.29–0.36% in NMECs, and between 0.2–0.35% in MECs. The expansion of imports exerts a negative effect on the employment gap in NMECs, while a positive effect in the full sample and MECs. This can result from the composition of imports, which are likely capital-‐intensive in MECs and therefore less likely to affect women’s job access. In contrast, women are more likely to be employed in import-‐competing industries in NMECs than MECs, accounting for the result that a 10% increase in imports as a share of NMECs’ GDP results in a 0.46–0.58% decline in the employment gap in favor of men. Finally, coefficients on manufacturing and agriculture are broadly similar to those reported in Table 3. As the literature has widely noted, the substitution of male for female labor tends to be inelastic in import and export industries due to gender norms. For that reason, we re-‐ run these regressions, disaggregating each to assess the effects of food and manufacturing (more female-‐intensive in employment), and ores and minerals which is male-‐intensive. The regression results are for the full sample only, since disaggregation of exports and imports obviates the relevance of disaggregating countries according to economic structure.
22
Food exports are found to confer no employment advantages for women, nor do food imports disadvantage them relative to men. Ore exports have a neutral effect, but ore imports raise women’s employment relative to men, possibly because male workers are disadvantaged as ore imports rise. Both manufacturing exports and imports tend to worsen women’s share of jobs. The effects are quite small for manufacturing exports, but are larger for manufacturing imports, although only significant in the TSLS regressions. (Table 4 about here). To sum up the results of this section, although trade liberalization has been associated with a feminization of employment in some developing economies, this effect may not occur if production shifts in favor capital-‐intensive industries, non-‐agricultural sectors, or male-‐dominated agricultural crops (Marzia Fontana, Susan Joekes, and Rachel Masika 1998; Nilufer Cagatay 2001). Women in SSA who tend to be in low-‐skilled or labor-‐ intensive jobs and concentrated in the informal and/or subsistence agricultural sector appear to have benefited less from the wave of trade liberalization that started in the 1980s. In contrast, we find that the strongest and most robust effects on women’s increased share of employment stem from infrastructure investments that reduce their care burden.9 It may very well be that the ability of women to engage in trade-‐induced employment possibilities is shaped by their care burden. That is, it is likely that infrastructure improvements are a complement to women’s relatively greater access to employment induced by trade expansion. III. Effects of Trade Liberalization on Women’s Employment Rates
23
The concern about the relative effects of trade liberalization on women’s employment are motivated by a rich literature underscoring the role of bargaining power in influencing negotiations between adults over resources and labor at the household level. That said, we might also be interested in the absolute effect of trade on women’s employment changes. This matters for several reasons. First, a basic tenet of economic development is that it should contribute to broadly shared well-‐being and we are thus interested to know whether the policy shift that leads to expanded trade in GDP in fact benefits women’s access to work, even if the effect is weaker than on men’s employment. Second, improvements in women’s absolute well-‐being have been found to have significant beneficial effects on children’s outcomes, with positive effects on long-‐run growth. In this section, we briefly present results obtained from estimating equation (1) with the female employment-‐to-‐population rate as the dependent variable, measured in natural logs. Again, we estimate our model with FE and as a robustness check and to account for potential endogeneity of GDP growth, we re-‐run the regressions with TSLS.
Table 5 summarizes those results. It is notable that GDP growth is neutral in its
effects on female employment across all samples and estimation methods. Growth rates in SSA have been weak at best, and the inability of our data set to identify benefits for women’s employment may therefore not be surprising. In contrast, both of the infrastructure variables exert the strongest positive effect on women’s employment of all of the independent variables in our model. The results are significant in the full and NMEC samples. They are not significant in the MECs but that could be due to multicollinearity with the manufacturing share of GDP variable.10 The combined effect of a 10% increase in
24
sanitation and telephone infrastructure yields a 0.8% improvement in women’s employment rates in the full sample and 1.0% in NMECs. (Table 5 about here). The effect of trade as a share of GDP is neutral in the full sample, negative in NMECs, and positive in MECs (but only in the TSLS regression). This suggests that the negative effect of trade on the female-‐male employment gap (Table 3) cannot simply be attributed to men’s differential ability to gain employment with trade expansion. Rather, the results suggest that women’s absolute employment rates decline with trade openness in NMECs. Why might this be so? One possibility is that trade liberalization, associated with structural adjustment programs that reduce public sector expenditures may have contributed to women’s care burden in terms of food preparation, health care, and other activities not otherwise captured by our physical infrastructure variables. In that case, trade is acting as a proxy for a broader array of neoliberal macro-‐level policies. As such, then, it would underscore the importance of looking at the impact of a broad set of macroeconomic policies rather than attempting to isolate the effects of a single policy. Other noteworthy results from these regression analyses are the negative effects of manufacturing as a share of GDP on women’s employment as well as the inverse relationship between agriculture’s share of GDP and women’s employment rates. Although perhaps counterintuitive, given the assumption of agriculture as a female-‐dominated sector, this can be explained by the shift from agriculture to services in SSA, where women are even more heavily concentrated. V. Conclusion
25
There are limits to what can be discerned from aggregate cross-‐country analyses. Many authors conclude their research with a call for further research and we are no different. To understand macro linkages more fully, such studies must be complemented by country-‐ specific analyses. That said, there are some important conclusions that can be drawn from the results presented here. The rich gender and development literature that has developed over the last 25 years made its intellectual mark by identifying the gendered impact of macroeconomic policies. The adoption of neo-‐liberal policies, often induced by World Bank and IMF loan conditionalities, had been found to have unintended negative impacts on women’s well-‐ being in SSA, linked primarily to public expenditure cuts. Further, as so presciently noted by Diane Elson (1991), women’s care burden constrained their relative ability to respond elastically to new employment opportunities.11 And of course, as has been found in a number of countries, including SSA, trade liberalization has been contemporaneous with worsened current account balances, as imports outpaced exports. Now 25 years later, we are in a better position to assess the gender employment effects of structural changes deriving from to trade liberalization. Although labor supply responses might be inelastic in the shorter run, there is the possibility that labor, including female labor, has adapted in the longer run to take advantage of structural changes. Our results convey a mixed picture, however. Table 6 summarizes the highlights of the results. Holding constant other factors, trade expansion has had a negative effect on women’s absolute and relative employment chances in NMECs. The effects are positive in MECs, but not robust across estimation methods. When we disaggregate trade variables into exports and imports, and then sub-‐groups, gender effects differ across sectors and
26
countries of differing economic structures. For example, both imports and exports have a negative effect on women’s relative employment rates in NMECs and MECs, but imports have a positive effect in MECs. At a more granular level of analysis, we find that food imports and exports produce a neutral gendered employment effect, but manufacturing exports and imports lower women’s employment relative to men’s (that is, men gain more). (Table 6 about here). Perhaps the most substantive finding in this study, however, is that infrastructure improvements are positively correlated with women’s absolute and relative employment rates. The econometric analysis used in this research is designed to decompose the determinants of employment into discrete factors. Given this, our results show that if we hold infrastructure constant, we still have gendered trade effects. That said, there is some likelihood that it is the composite of gender conditions in a country that mediate the relationship between trade and gendered employment.12 To have introduced interaction terms to capture this effect, however, was deemed too demanding for this dataset, given cross-‐country differences in employment surveys (Table 1) and measurement of infrastructure.13 It bears reiterating, however, that the elasticity of labor supply is gendered, and women’s care burden has an important effect on that elasticity. Finally, this paper is a contribution to the ongoing debates and discussion on the gendered effects of macroeconomic policies, including rules on trade. It underscores the need for economic analysis that is gender-‐aware, in the sense of recognizing that economic activity works through and within gendered relationships, including those in the labor
27
market. Given the impact of gender on economic growth and development, a better understanding of the policies required to diminish gender inequality is essential.
28
REFERENCES Adhikari, Ratnakar and Yumiko Yamamoto. 2006. “Sewing Thoughts: How to Realize Human Development Goals in the Post-‐Quota World. Tracing Report.” Asia Pacific Trading Initiative, UNDP Regional Centre, Colombo. Africa Infrastructure Knowledge Program. 2011. Handbook on Infrastructure Statistics. Addis Ababa and Washington, DC: African Development Bank and World Bank. Agénor, Pierre-‐Richard, Otaviano Canuto, and Luiz Pereira da Silva. 2010. “On Gender and Growth: The Role of Intergenerational Health Externalities and Women’s Occupational Constraints.” World Bank Policy Research Working Paper No. 5492. Arbache, Jorge Saba, Alexandre Kolev, and Ewa Filipiak. 2010. Gender Disparities in Africa’s Labor Market. Washington, DC: World Bank. Babatunde, Musibau Adetunji. 2009. “Can Trade Liberalization Stimulate Export Performance in Sub-‐Saharan Africa? Journal of International and Global Economic Studies 2(1): 68-‐92. Baliamoune-‐Lutz, Mina. 2007. “Globalisation and Gender Inequality: Is Africa Different? Journal of African Economies 16(2): 301-‐348. Bandara, Amarakoon. 2012. “Economic Cost of Gender Gaps in Effective Labor: Africa’s Missing Growth Reserve.” Mimeo, UNDP Tanzania, Dar-‐es-‐Salaam. Benería, Lourdes. 2003. Gender, Development, and Globalization: Economics as if People Mattered. New York: Routledge. Berik, Gűnseli. 2000. “Mature Export-‐Led Growth and Gender Wage Inequality in Taiwan.” Feminist Economics 6(3): 1–26. Bleaney, Michael and David Greenaway. 2001. “The Impact of Terms of Trade and Real Exchange Rate Volatility on Investment and Growth in Sub-‐Saharan Africa.” UNU/WIDER Discussion Paper 91, World Institute for Development Economics Research, Helsinki: United Nations University. Braunstein, Elissa. 2012. “Neoliberal Development Macroeconomics. A Consideration of Its Gendered Employment Effects.” Gender and Development Paper No. 14, UNRISD. Bruckner, Markus and Daniel Lederman. 2012. “Trade Causes Growth in SSA.” World Bank Policy Research Working Paper 6007. Bussolo, Maurizio and Rafael De Hoyos. 2009. Gender Aspects of the Trade and Poverty Nexus: A Micro-‐Macro Approach. Washington, DC: World Bank.
29
Cagatay, Nilufer. 2001. “Trade, Gender and Poverty”. UNDP, NY. Darity, William, Jr. 1995. “The Formal Structure of a Gender-‐segregated Low-‐income Economy.” World Development 23(7): 1963-‐1968. Deere, Carmen Diana. 2005. Feminization of Agriculture? Economic Restructuring in Rural Latin America. Occasional Paper No.1, UNRISD, Geneva. Elson, Diane. 1991. “Male Bias in the Development Process: The Case of Structural Adjustment.” In D. Elson (Ed.), Male Bias in the Development Process, pp. 164-‐90. Manchester: Manchester University Press. Fontana Marzia, Susan Joekes, and Rachel Masika. 1998. “Global Trade Expansion and Liberalisation: Gender Issues and Impacts. BRIDGE Development-‐Gender Report No. 42, Institute of Development Studies, Brighton, UK. Fontana, Marzia and Luisa Natali. 2008. “Gendered Patterns of Time Use in Tanzania: Public Investment in Infrastructure Can Help.” Paper prepared for the IFPRI Project on Evaluating the Long-‐Term Impact of Gender-‐focused Policy Interventions. Food and Agriculture Organization (FAO). 2011. The State of Food and Agriculture: Women in Agriculture. Rome: Author. Fontana, Marzia. 2007. “Modeling the Effects of Trade on Women, at Work and at Home: Comparative Perspectives.” In Irene van Staveren, Diane Elson, Caren Grown and Nilufer Cagatay (Eds.), The Feminist Economics of Trade. London: Routledge. Gladwin, Christina (Ed.). 1991. Structural Adjustment and African Women Farmers. Gainsville, FL: University of Florida Press. Gonzalez de la Rocha, Mercedes. 1988. “Economic Crisis, Domestic Reorganisation, and Women’s Work in Guadalajara.” Bulletin of Latin American Research 7(2): 207–223. Hill, Ruth Vargas and Marcella Vigneri. 2011. “Mainstreaming Gender Sensitivity in Cash Crop Market Supply Chains.” ESA Working Paper No. 11-‐08. Kabeer, Naila. 2000. The Power to Choose. London: Verso. Klasen, Stephan and Francesca Lamanna. 2009. “The Impact of Gender Inequality in Education and Employment on Economic Growth: New Evidence for a Panel of Countries.” Feminist Economics 15(3): 91-‐132. Kucera, David and Leanne Roncolato. 2011. “Trade Liberalization, Employment, and Inequality in India and South Africa.” International Labour Review 150 (1–2): 1-‐41.
30
Jomo, Kwame Sundaram, Oliver Schwank, and Rudiger von Arnim. 2011. “Globalization and Development in sub-‐Saharan Africa.” UN DESA Working Paper No. 102. Meyer, Lisa. 2006. “Trade Liberalization and Women’s Integration into National Labor Markets: A Cross-‐Country Analysis.” Social Indicators Research 75(1): 83-‐121 Ocampo, José Antonio, Codrina Rada, and Lance Taylor. 2009. Growth and Policy in Developing Countries: A Structuralist Approach. New York: Columbia University Press. Oya, Carlos and John Sender. 2009. “Divorced, Separated and Widowed Women Workers in Rural Mozambique.” Feminist Economics 15(2): 1-‐31. Seguino, Stephanie. 2000. “Gender Inequality and Economic Growth: A Cross-‐Country Analysis.” World Development 28(7): 1211-‐30. Sender, John, Carlos Oya and Christopher Cramer. 2006. “Women Working for Wages: Putting Flesh on the Bones of a Rural Labour Market Survey in Mozambique.” Journal of Southern African Studies, Vol. 32, No. 2, pp. 313-‐333. Shaxson, Nicholas. 2005. “New Approaches to Volatility: Dealing with the ‘Resource Curse’ in sub-‐Saharan Africa.” International Affairs 81(2): 311-‐324. Standing, Guy. 1989. “Global Feminization through Flexible Labor.” World Development 17(7): 1077–1095. Tejani, Sheba and William Milberg. 2010. “Global Defeminization? Industrial Upgrading, Occupational Segmentation and Manufacturing Employment in Middle-‐Income Countries.” SCEP Working Paper 2010-‐1, Schwartz Center for Economic Policy Analysis & Department of Economics, New School for Social Research, New York. United Nations Children’s Fund (UNICEF). 1999. Women in Transition. Florence, Italy: UNICEF Innocenti Research Centre. United Nations Conference on Trade and Development (UNCTAD). 2009. UNCTAD Handbook of Statistics. Geneva: UNCTAD. van Staveren, Irene, Diane Elson, Caren Grown, and Nilufer Cagatay (Eds.). 2007. Feminist Economics of Trade. London: Routledge. Vigneri, Marcella and Rebecca Holmes 2009. “When Being More Productive Still Doesn’t Pay: Gender Inequality and Socio-‐Economic Constraints in Ghana’s Cocoa Sector.” Paper presented at the FAO-‐IFAD-‐ILO Workshop on Gaps, Trends and Current Research in Gender Dimensions of Agricultural and Rural Employment, Rome. World Bank. 2012. World Development Report 2012. Washington, DC: World Bank.
31
Table 1. Female Share of Employment by Sector in SSA Agriculture & Fishing
Mining & Quarrying
Manu-‐ facturing
Data source
Year of survey
Botswana
38.7%
12.3%
55.4%
1
2006
12+ including armed forces
Ethiopia
32.1%
10.6%
50.4%
1
2006
10+
Lesotho
39.3%
20.3%
63.4%
1
2000
10+
Madagascar
49.7%
45.0%
23.3%
2
2005
6+
Mali
29.8%
26.1%
50.1%
1
2004
15+
Mauritius
27.4%
0.0%
43.2%
1
2008
12+
Namibia
36.8%
21.9%
49.1%
1
2004
15-‐69
Nigeria
36.6%
20.9%
52.5%
1
2007
Civilians (no age specified)
Senegal
34.3%
18.5%
17.0%
2
2006
15+
Sierra Leone
51.4%
14.0%
21.4%
3
2004
10+
South Africa
33.1%
11.0%
32.1%
1
2008
15-‐64
Tanzania
51.8%
47.1%
34.1%
1
2002
15+
Uganda
55.8%
33.5%
33.4%
1
2003
10+
Zambia
49.6%
5.5%
27.0%
3
2000
12+
Ages included in sample
Sample mean 40.5% 20.5% 39.5% Note: Date sources are 1) labor force survey, 2) household survey, and 3) population census. Source: International Labor Organization, Laborstat, Table 2B, accessed December 8, 2012.
32
Table 2. Sectoral Shares of Value-‐Added as % of GDP and Employment
Sectoral shares of output, 2009
Agriculture Services Industry Non-‐Mfg. Industry Mfg.
NMECs
MECs
Oil
22.4 54.3
21.4 48.5
25.9 37.9
23.3 9.8 13.4
30.1 22.8 9.4
36.2 26.0 10.2
64.7 9.5 25.2
55.8 10.8 33.2
50.7 10.0 35.5
1.01 0.74 1.07
1.05 0.46 1.15
1.00 0.65 1.14
Employment Shares, 1991-‐2009 Agriculture Industry Services F/M Employment Shares, 1991-‐2009 Agriculture Industry Services
Note: Industry is comprised of manufacturing and non-‐manufacturing output. Non-‐manufacturing industry value-‐added includes mining, construction, electricity, water and gas. Source: World Development Indicators (2012), online.
33
Variables
Table 3. Gender Employment Effects of Trade Liberalization (Dependent variable: ln[Female – Male Employment Rate Gap]) Full sample NMECs MECs FE TSLS FE TSLS FE TSLS (1) (2) (3) (4) (5) (6)
GDP growth
-‐0.009 (0.020)
-‐0.168** (0.079)
0.018 (0.026)
0.123 (0.085)
0.015 (0.029)
-‐0.093 (0.111)
Sanitation
0.041* (0.022)
0.023** (0.011)
0.083*** (0.020)
0.078*** (0.013)
0.029 (0.035)
-‐0.078*** (0.024)
Telephones
0.030*** (0.010)
0.048*** (0.005)
0.020 (0.017)
0.031*** (0.008)
0.013 (0.010)
0.043*** (0.008)
Trade as % GDP
-‐0.007 (0.017)
-‐0.006 (0.009)
-‐0.078*** (0.019)
-‐0.097*** (0.013)
0.023 (0.022)
0.051*** (0.011)
Mfg. as % GDP
0.012 (0.015)
0.003 (0.009)
0.033 (0.019)
0.027** (0.012)
-‐0.011 (0.024)
-‐0.038*** (0.013)
Agric. as % GDP
-‐0.028 (0.017)
-‐0.023*** (0.008)
-‐0.050* (0.027)
-‐0.050*** (0.012)
-‐0.032 (0.025)
-‐0.044*** (0.011)
Constant No. of observations R2
-‐0.290*** (0.095) 654
441
0.24
0.338
-‐0.079 (0.130)
No. of countries
255
208
0.486
0.526
-‐0.263 (0.182) 303
175
0.158
0.393
38 30 15 13 17 13 Note: All variables with the exception of per capita GDP growth are measured in natural logs. Values in the parenthesis are standard errors. A single asterisk (*) denotes significance at the 10% level, two asterisks (**) at the 5% level, and three asterisks (***) at the 1% level. Instruments in the TSLS regressions are: the growth rate of gross fixed capital formation, OECD GDP growth rates, the log of the female-‐male gap in labor force participation rates, and the log of the ratio of female to male gross primary enrollment rates.
34
Table 4. Gender Employment Effects of Trade Liberalization, Exports and Imports Disaggregated (Dependent variable: ln[Female – Male Employment Rate Gap])
Full sample
Variables
GDP growth Sanitation Telephones Exports Imports Food exports Food imports Ore exports Ore imports Mfg. exports Mfg. imports Mfg. as % GDP Agric. as % GDP Constant No. of observations R2 No. of countries
NMECs
Full sample (Disaggregated X and M)
MECs
FE
TSLS
FE
TSLS
FE
TSLS
FE
TSLS
(1)
(2)
(3)
(4)
(5)
(6)
(7)
(8)
0.010 (0.020)
-‐0.108 (0.079)
0.026 (0.030)
0.155* (0.090)
0.042 (0.037)
0.019 (0.109)
0.016 (0.051)
-‐0.147 (0.090)
0.036* (0.021)
0.013 (0.012)
0.080*** (0.023)
0.073*** (0.014)
0.030 (0.034)
0.072 (0.023)
0.047** (0.022)
0.045*** (0.013)
0.030*** (0.010)
0.048*** (0.005)
0.020 (0.017)
0.031*** (0.008)
0.012 (0.010)
0.038*** (0.007)
0.037*** (0.011)
0.050*** (0.005)
-‐0.027** (0.013)
-‐0.026*** (0.008)
-‐0.029** (0.013)
-‐0.036*** (0.011)
-‐0.035** (0.016)
-‐0.020* (0.011)
0.023 (0.015)
0.023** (0.009)
-‐0.046** (0.021)
-‐0.058*** (0.016)
0.052** (0.024)
0.069*** (0.012)
0.008 (0.007)
0.003 (0.004)
-‐0.006 (0.010)
0.003 (0.007)
0.0002 (0.003)
0.0002 (0.002)
0.001 (0.008)
0.011*** (0.004)
-‐0.002 (0.004)
-‐0.007*** (0.002)
-‐0.021 (0.023)
-‐0.032** (0.014)
0.011 (0.014)
0.006 (0.009)
0.033 (0.020)
0.027** (0.012)
-‐0.011 (0.022)
-‐0.021 (0.014)
0.008 (0.019)
-‐0.016 (0.012)
-‐0.036** (0.016)
-‐0.032*** (0.008)
-‐0.052* (0.028)
-‐0.052*** (0.012)
-‐0.040 (0.024)
-‐0.053*** (0.011)
-‐0.043* (0.023)
-‐0.034*** (0.011)
-‐0.129 (0.132)
-‐0.222 (0.171)
-‐0.210 (0.171)
-‐0.270*** (0.090) 654
441
255
208
303
175
429
308
0.261
0.37
0.484
0.519
0.211
0.451
0.356
0.52
38
30
15
13
17
13
34
28
Note: All variables with the exception of per capita GDP growth are measured in natural logs. Values in the parenthesis are standard errors. A single asterisk (*) denotes significance at the 10% level, two asterisks (**) at the 5% level, and three asterisks (***) at the 1% level. Instruments in the TSLS regressions are: the growth rate of gross fixed capital formation, OECD GDP growth rates, the log of the female-‐male gap in labor force participation rates, and the log of the ratio of female to male gross primary enrollment rates.
35
Table 5. Female Employment Effects of Trade Liberalization (Dependent variable: ln[Female Employment-‐to-‐Population Rate]) Full sample Variables GDP growth Sanitation Telephones Trade as % GDP Mfg. as % GDP Agric. as % GDP Constant of observations No. R2 No. of countries
NMECs
MECs
FE (1)
TSLS (2)
FE (3)
TSLS (4)
FE (5)
TSLS (6)
0.010 (0.029) 0.060*** (0.022) 0.022** (0.010) -‐0.011 (0.019) 0.009 (0.016) -‐0.047** (0.022) 3.993*** (0.103) 654
-‐0.056 (0.088) 0.043*** (0.013) 0.038*** (0.006) -‐0.017 (0.011) 0.006 (0.011) -‐0.046*** (0.009)
0.156 (0.108) 0.084*** (0.016) 0.028*** (0.010) -‐0.097*** (0.017) 0.028* (0.016) -‐0.077*** (0.015) 208
0.030 (0.050) 0.056 (0.039) 0.0003 (0.010) 0.018 (0.020) -‐0.020 (0.019) -‐0.065*** (0.022) 3.999*** (0.175) 303
-‐0.004 (0.140) 0.015 (0.030) 0.012 (0.010) 0.037*** (0.014) -‐0.059*** (0.017) -‐0.064*** (0.014)
441
0.027 (0.037) 0.087*** (0.018) 0.019 (0.014) -‐0.072*** (0.021) 0.032 (0.019) -‐0.072 (0.043) 4.245*** (0.182) 255
0.253
0.332
0.434
0.46
0.231
0.314
38
30
15
13
17
13
175
Note: All variables with the exception of per capita GDP growth are measured in natural logs. Values in the parenthesis are standard errors. A single asterisk (*) denotes significance at the 10% level, two asterisks (**) at the 5% level, and three asterisks (***) at the 1% level. Instruments in the TSLS regressions are: the growth rate of gross fixed capital formation, OECD GDP growth rates, the log of the female-‐male gap in labor force participation rates, and the log of the ratio of female to male gross primary enrollment rates.
36
Table 6. Summary of TSLS Regression Results on Trade and Infrastructure
Female-‐Male Employment Gap Full sample
NMECs
MECs
−
−***
+***
Exports
−***
−***
Imports
+**
Sanitation
NMECs
MECs
−
−***
+***
+***
−*
+
−**
−***
+***
+
−***
+***
+*
+***
+***
+***
+***
+
Telephone lines
+***
+***
+***
+***
+***
+
Manufacturing share of GDP
+
+***
−
+
+*
−***
−***
−***
−***
−***
−***
−***
Trade
Agriculture share of GDP
Female Employment Rate
37
Full Sample
Figure 1. Trends in Female and Male Employment-‐to-‐Population Rates by Structure in SSA, 1991-‐2010 Panel A: Female-‐Male Employment Rate -‐5.0 1991
1994
1997
2000
2003
2006
2009
-‐10.0 -‐15.0 -‐20.0 -‐25.0 -‐30.0
Oil
NMEC
MEC
Panel B: Female Employment-‐to-‐Population Rate
64 59 54 49 44 1991
1994
1997
Oil
2000
NMEC
2003
2006
2009
MEC
38
Figure 2. Trends in Structure of Production, 1960-‐2010 Panel A: Agriculture Value-‐Added as Share of GDP
55 50 45 40 35 30 25 20 15 1960 1965 1970 1975 1980 1985 1990 1995 2000 2005 2010
Oil
NMEC
MEC
Panel B: Services 60 55 50 45 40 35 30 1960 1965 1970 1975 1980 1985 1990 1995 2000 2005 2010
Oil
NMEC
39
MEC
Panel C: Non-‐manufacturing Industry
40 35 30 25 20 15 10 5 0 1960 1965 1970 1975 1980 1985 1990 1995 2000 2005 2010
Oil
NMEC
MEC
Panel D: Manufacturing
17 15 13 11 9 7 5 1960 1965 1970 1975 1980 1985 1990 1995 2000 2005 2010 Oil
NMEC
MEC
Note: Industry includes ISIC divisions 10-‐14 and 38-‐45, comprises manufacturing, mining, construction, electricity, water, and gas. Services include ISIC divisions 50-‐99, comprised of wholesale and retail trade, transport, and government, financial, professional, and personal services.
Source: World Development Indicators (2012), online.
40
Figure 3. Trends in Trade Openness and Trade Deficit (Surplus), 1960-‐2010 Panel a: Trade as % of GDP 95 85 75 65 55 45 35 25 1960 1965 1970 1975 1980 1985 1990 1995 2000 2005 2010
Oil
NMEC
MEC
Panel b: Trade deficit (surplus) as % of GDP
15 10 5 0 1960 1965 1970 1975 1980 1985 1990 1995 2000 2005 2010 -‐5 -‐10 -‐15 -‐20 -‐25 -‐30
Oil
NMEC
MEC
41
Figure 4. Trends in the Structure of Exports and Imports Panel A: Net food exports
90
70
50
30
10 1962 1967 1972 1977 1982 1987 1993 1998 2003 2008 -‐10
-‐30
Oil
NMEC
MEC
Panel B: Net manufacturing exports
0 1962 1967 1972 1977 1982 1987 1992 1997 2002 2007 -‐10 -‐20 -‐30 -‐40 -‐50 -‐60 -‐70 -‐80 Oil
NMEC
42
MEC
Panel C: Net ore exports
60 50 40 30 20 10 0 1962 1967 1972 1977 1982 1987 1992 1997 2002 2007 -‐10 Oil
NMEC
MEC
Note: Net export sectoral shares measure the difference between sectoral exports and imports as a share of GDP. Food comprises the following SITC categories: food and live animals; beverages and tobacco; animal products.
Source: World Development Indicators (2012), online.
43
Figure 5. Long-‐Run Per Capita GDP Growth Trends in SSA Economies, 1961-‐2010 (Hodrick-‐Prescott Filter) 0.04 0.03 0.02 0.01 0.00 1961
1966
1971
1976
1981
1986
1991
1996
2001
2006
-‐0.01 -‐0.02
Oil
NMEC
44
MEC
APPENDIX
Table A.1. Sample Countries by Structure of Merchandise Exports
Non-‐oil Mineral Exporters Botswana Central African Republic Congo, DR Gabon Ghana Guinea Mauritania Mozambique Namibia Niger Rwanda Senegal South Africa Tanzania Togo Zambia Zimbabwe
Non-‐oil Non-‐Mineral Exporters Benin Burkina Faso Burundi Eritrea Ethiopia Gambia Guinea Bissau Kenya Lesotho Madagascar Malawi Mali Mauritius Swaziland Uganda
45
Oil Exporters Angola Cameroon Chad Cote d'Ivoire Nigeria Sudan
Table A.2 Model Variables and Sources Variable Data Source Female employment-‐to-‐population rate minus male employment-‐to-‐population rate (15+)
Authors’ calculation based on ADI database
Female employment-‐to-‐population rate (15+)
ADI database
GDP per capita growth rate Percent of population with access to improved sanitation facilities
ADI database
Telephone lines per 100 people
ADI database
Trade (exports plus imports) as a share of GDP
ADI database
Manufacturing value-‐added as % of GDP
ADI database
Agriculture value-‐added as % of GDP
ADI database
Exports of goods and services as % of GDP
ADI database
Imports of goods and services as % of GDP
ADI database
Ores and metals exports as % of merchandise exports
ADI database
Ores and metals imports as % of merchandise imports
ADI database
Food exports as % of merchandise exports
ADI database
Food imports as % of merchandise imports
ADI database
Manufactures export as % of merchandise exports
ADI database
Manufactured imports as % of merchandise imports Female labor force participation rate minus log male labor force participation rate (population 15-‐64)
ADI database
Growth rate of gross fixed capital formation
Authors’ calculation based on ADI data
WDI database
Authors’ calculation based on ADI data Authors’ calculation based on WDI Ratio of female to male gross primary enrollment rates data Growth rate of OECD GDP per capita WDI database Notes: ADI is the African Development Indicators. WDI is the World Development Indicators. Both databases are from World Bank’s online database.
46
Table A.3. Descriptive Statistics
Mean
Std. Dev.
Min
Max
Obs.
Female-‐male employment rate gap (log)
-‐0.264
0.254
-‐1.154
0.153
722
Female employment rate (log)
3.997
0.317
3.082
4.459
722
Per capita GDP growth
0.01
0.056
-‐0.64
0.316
758
Sanitation (log)
3.18
0.712
1.099
4.489
748
Telephone (log)
-‐0.312
1.298
-‐5.157
3.392
719
Trade as % GDP (log)
4.146
0.489
2.382
5.344
727
Manufacturing value-‐added as % GDP (log)
2.259
0.587
0.916
3.81
690
Agriculture value-‐added as % GDP (log)
3.108
0.757
0.606
4.232
696
Exports as % GDP (log)
3.224
0.644
1.167
4.646
727
Imports as % GDP (log)
3.593
0.466
1.979
4.995
727
Ores exports as % of merchandise exports (log)
0.889
2.401
-‐5.923
4.487
468
Ores imports as % of merchandise imports (log)
0.131
0.728
-‐2.579
3.698
471
Food exports as % of merchandise exports (log)
3.057
1.402
-‐4.157
4.596
470
Food imports as % of merchandise imports (log) Manufacturing exports as % of merchandise exports (log) Manufacturing imports as % of merchandise imports (log)
2.778
0.481
0.804
4.134
471
2.421
1.691
-‐7.611
4.553
467
4.119
0.192
3.384
4.532
471
Female-‐male labor force participation rate gap (log)
-‐0.283
0.238
-‐1.167
0.039
722
Female/male ratio primary enrollment rates (log)
4.442
0.18
3.805
4.803
637
Growth of gross fixed capital formation
0.086
0.182
-‐0.777
0.787
505
Growth rate of OECD GDP per capita
1.306
1.646
-‐4.584
3.176
760
Note: All variables are measured in natural logs with the exception of the growth rates of per capita GDP, gross fixed capital formation, and OECD growth rates.
47
ENDNOTES 1
This is based on authors’ calculations from African Development Indicators (2012), online.
2 This is based on authors’ calculations from World Development Indicators (2012), online. 3 This is based on authors’ calculations using the World Bank’s African Development Indicators (online).
Aggregate economic activity (measured as variance of per capita GDP growth rates) has also been more volatile in since 1985. 4
These trade policy variables, in any case, have some limitations. Data on tariffs, for instance, disregard the use of NTBs as impediments to trade. Also, it is not always the case that NTBs are strictly enforced, especially in poor developing countries where corruption sometimes triumphs over trade policies. 5 Two unit root tests were performed on all variables, the standard Augmented Dickey-‐Fuller test and the
Phillips-‐Perron test. We were able to decisively reject the null hypothesis of no unit root for all but two variables –the natural log of telephone lines were 100 people and the log of the female to male primary enrollment rate (used as an instrument for per capita GDP growth in the TSLS estimation. For those two variables, we modified the specification to include deterministic drift (intercept) and linear trend terms. Based on the results of the unit root tests, we conclude that this set of variables can be considered to be stationary, stationary with drift, or trend stationary (that is, there is no evidence of unit roots once we account for deterministic factors that can produce trends in the data). 6 See Bruckner, Markus, and Lederman (2012) for a detailed explanation of the OECD GDP growth rate
instrument
7 We also ran regressions in which we excluded the oil exporters from the full sample. This did not
significantly change the results presented here for the full sample. Results available upon request. 8 The services sector is the omitted sector here, and it is useful to remember that a good deal of service sector
employment is informal and can be construed as residual unemployment. 9
Though we do not have direct estimates of the effects on women’s care burden, numerous studies have found linkages between infrastructure improvements and women’s care burden (Agénor, Canuto, and da Silva 2010; Fontana and Natali 2008). 10 We ran stepwise regressions without the manufacturing variable, and obtained positive and significant coefficients on sanitation and telephones. Results available on request. 11 Darity (1995) too noted that with the expansion of demand for cash crops, often controlled by men,
women’s labor time might be further constrained as they provided labor on male crops. This would not only limit their time for subsistence production but also for off-‐farm remunerative work. 12 We are grateful to an anonymous referee for raising this point. 13 Substantial effort goes into data cleaning to ensure accuracy, consistency, and coherence. Nevertheless, this
is a daunting task, given that SSA infrastructure estimates are compiled from a variety of sources, including household and enterprise surveys, administrative data sources, population and housing censuses (Africa Infrastructure Knowledge Program 2011).
48