CROATICA CHEMICA ACTA CCACAA, ISSN 0011-1643, e-ISSN 1334-417X
Croat. Chem. Acta 86 (1) (2013) 103–107. http://dx.doi.org/10.5562/cca2235 Original Scientific Article
Effect of Bubbling on the Potential of Reference Electrode Nikola Kallay, Matija Lovrak, Tajana Preočanin,* and Filip Šupljika Division of Physical Chemistry, Department of Chemistry, Faculty of Science, University of Zagreb, Horvatovac 102a, HR-10000 Zagreb, Croatia RECEIVED FEBRUARY 04, 2013; REVISED MARCH 12, 2013; ACCEPTED MARCH 19, 2013
Abstract. The method for the examination of gas/water interface electrokinetic behavior is developed. "Bubbling potential", i.e. the difference in the potential of the indicator electrode in the absence and presence of gas bubbles was measured. The indicator electrode is a reference electrode with the porous plug exposed to gas bubbles. The charged bubble in contact with the porous plug would affect the potential of the indicator electrode. However, electrodes, whose potential depends on the reversible interfacial reaction, would be relaxed due to the interfacial ionic equilibration and their potential will not be affected by the presence of bubbles. Measured Bubbling potentials are directly related to electrokinetic - potentials. The proposed method is fast, accurate and reproducible so that it can be used for the examination of gas/water interfaces in different conditions. The isoelectric point of argon bubbles in the aqueous NaCl solution was obtained as pHiep = 3.9 and pHiep = 3.4 at ionic strength of 10–3 and 10–2 mol dm–3, respectively. (doi: 10.5562/cca2235) Keywords: Air/Water Interface, bubbles, electrokinetics, electrokinetic -potential, bubbling potential
INTRODUCTION It seems at first sight that an inert material/water interface is one of the simplest systems to study and understand. However, an interface is never a simple system, especially when water is considered.1–4 It is agreed that interfacial water at inert surfaces, such as gas,5–7 ice,8 hydrocarbon oil,9 diamond10 and Teflon,11 exhibit electrical surface charge. Although the results of numerical simulations and calculations12–17 suggest positive surface charge, the experimental results obtained with different experimental techniques i.e. electrophoresis,5–7 surface tension,18 spectroscopy,19 indicate pH-dependent surface charge being negative in the pH region above pH = 4. This controversy is still not solved. One solution of the problem might be to consider the physical meaning of the surface charge. For example, negative electrokinetic potential means that the electrokinetic stagnant layer is negatively charged. This means that the water layer near the plane that divides water from the inert phase, the thickness of which is approximately 1 to 2 nm, bears net negative charge. On the other hand, numerical simulations predict electric potential of a certain plane at the interface, but not of the layer of finite thickness. The second possible approach to the problem is developing some additional experimental techniques that would produce results enabling better
understanding of the problem. The aim of this article is to present measurements of the electrode potentials in aqueous environment in the presence and absence of bubbles. The original idea was to measure surface charge of the gas/air interface but it turned out that these measurements produce "bubbling potential" ( b) which is related to the electrokinetic -potential. As a result the article comprises two parts. In the first part (Preliminary experiments) of the article the "history" of the project, i.e. the initial misconception, was described. In the second part it was stated that a "bubbling" potential is a kind of the interfacial potential. PRELIMINARY EXPERIMENTS The common method for surface charge determination is potentiometric titration of the suspension.20 In the case of metal oxides and gas/water interfaces the ions that determine surface charge (potential determining ions, p.d.i.) are H+ and OH− ions. Therefore, the glass electrode (G) and the reference calomel electrode with a porous plug (RP) were used. The method can be successfully applied if the particles surface area/solution volume ratio is high enough. This can be achieved by using small particles of high specific surface area. Since gas bubbles are relatively large it was assumed that the sufficiently high surface to volume ratio was likely to be
* Author to whom correspondence should be addressed. (E-mail:
[email protected])
104
N. Kallay et al., Effect of Bubbling on the Potential of Reference Electrode
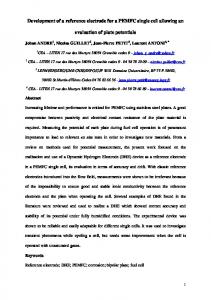
achieved by a continuous introduction of high portion of gas bubbles into the aqueous solution. For that purpose, the sintered glass Büchner funnel with the porous bottom (porous size: 2–2,5 μm) was used, as presented in Figure 1. Note that in the first attempt the sheltered reference electrode (RS) was not introduced. The acidic solution was titrated by base and the electromotivity (electromotive force) was measured in the presence and absence of bubbles. A measurable and reproducible difference of electromotivity was observed in the presence of bubbles. Despite the unknown surface area, it was expected that the surface charge density on the relative scale could be obtained. However, calculation of the "surface charge", from titrations in the presence and absence of bubbles, failed since the apparent values of negative "surface charge" increased from pH = 7 to pH = 4 and then suddenly dropped to zero at pH = 3.9. This finding contradicts the common behavior of interfaces i.e. negative surface charge should decrease from pH = 7 to pHiep = 3.9. Further, the measured difference in electromotivities in presence and in the absence of bubbles significantly decreased by increasing the electrolyte concentration, which was expected for surface potential values and not for surface charge density. In addition, the estimation of the surface area of gas bubbles showed that the surface area was too low to produce a measurable difference between titrations in the absence and presence of bubbles. The next assumption was that the measured effect could be attributed to the Dorn effect,21 as suggested by Usui, Sasaki and Matsukawa.22 The Dorn effect i.e. sedimentation potential, is an electrode potential difference between two electrodes mounted at two different heights, as a consequence of the sedimentation movement of charged colloidal particles. The difference between the buoyancy and gravitational force would cause an upward movement of bubbles and the difference in potentials of electrodes mounted at two different heights could be expected. In neutral solutions at pH ≈ 7, the bubbles are negatively charged23 and since they move upwards the potential of the upper electrode should be more negative while the potential of the lower electrode should be more positive. If electrodes are at the same level the effect should disappear. By changing positions of the electrodes in our experiment we have found that the measured phenomenon cannot be attributed to the Dorn effect. In order to understand the phenomenon, different electrodes were introduced and it was concluded that only the reference electrode with a porous plug (RP) is sensitive to bubbles. In order to test this conclusion, the sheltered reference electrode (RS) was constructed. In order to protect it from a contact with bubbles the shelter was equipped with the salt bridge with an open mouth in the upper position. The composition of the solution within the salt bridge was ensured to be the same as in the bulk by using the three way pipette bulb.
Croat. Chem. Acta 86 (2013) 103.
Figure 1. Device for measurements of the effect of gas bubbles on the potential of electrodes: the shielded reference electrode (RS), the glass electrode (G) and the reference electrode with a porous plug (RP).
In the measurements, three electrodes were introduced: (G) a commercial glass electrode. The potential determining ions are H+ and OH–. (RS) a sheltered reference electrode; a commercial calomel electrode Pt|Hg(l), Hg2Cl2(s)|KCl (3 mol dm–3) with porous ceramic plug sheltered in Plexiglas tube so that contact with gas bubbles was prevented. The electrode potential of this electrode is independent on pH and electrolyte composition and is not affected by bubbles. (RP) a reference electrode with a porous plug exposed to bubbles; a commercial calomel electrode Pt|Hg(l), Hg2Cl2(s)| KCl (3 mol dm–3) with porous ceramic plug in direct contact with measuring electrolyte solution and bubbles. The electrode potential of this electrode is independent on pH and electrolyte composition but is affected by bubbling. The titration cell with electrodes is presented in Figure 1. The electromotivity of the G|RS cell was not affected by bubbles, while the electromotivities of G|RP and RP|RS cells were significantly changed in the presence of bubbles. Accordingly, it was concluded that the reference electrode with a porous plug exposed to bubbles (RP) was responsible for the measured effect, while the glass electrode (G) and the sheltered reference electrode (RS) were not affected by the presence of bubbles.
105
N. Kallay et al., Effect of Bubbling on the Potential of Reference Electrode
EXPERIMENTAL According to preliminary findings, the new device was constructed (Figure 2). Gas (argon) was supplied through the capillary (size about = 1 mm in diameter) mounted exactly below the reference electrode with a porous plug, and this electrode was considered to be the indicator electrode (RP). The average size of bubbles was 1 to 3 mm. The glass (G) and the second reference electrode (RR) were mounted in such a way that bubbles could not approach them despite the stirring. The potentials of the glass electrode (G) and the indicator electrode (RP) were measured with respect to the reference electrode that was not exposed to bubbles (RR). The glass electrode served for pH determination, while the indicator electrode enabled the observation of the bubble effect. The potential of the indicator electrode with respect to the reference electrode RG|RR was measured in the presence (Eb) and absence (E0) of bubbles. The system was stirred and thermostated. The bubbling potential b, due to the potential drop caused by the contact of bubbles with a porous plug, is defined as
b = Eb − E0
(1)
Next two tests are related to the flow rate of argon and to the distance between capillary and the porous plug surface. Results are presented in figures 4 and 5, respectively. It is clear that the bubble effect, expressed in terms of bubbling potential b, requires a certain supply of bubbles. After reaching a sufficient supply of bubbles the effect is almost insensitive to the flow rate (Figure 4). The distance between the mouth of the capillary and the porous plug surface showed similar behaviour (Figure 5). In other words the surface of the porous plug should not be too far from the capillary month so that a sufficient supply of bubbles is ensured. On the basis of these tests the optimum flow rate of 50 dm3 h–1 and the separation of the indicator electrode of 0.5 cm were chosen as an optimum. At this condition the response
/ mV E / EmV
Several experiments were preformed. All chemicals used were of analytical grade; pH was adjusted by NaOH and HCl while the ionic strength was controlled by NaCl. The possible dissolution of carbon dioxide is reduced by using the electrolyte solution freshly prepared with degassed and deionised water. Argon was purified by bubbling through NaCl solution of the same ionic strength as the measuring system. Two pH meters
were used; one for the measurements of electrode potential of glass electrode in respect to reference electrode (G|RR) and another for the measurements of the electrode potential of indicator electrode (RP|RR) in respect to the same reference electrode. The readings were digitally collected by a computer. As a test of the method, an Ag|AgCl microcrystal reversible electrode of the second kind and the glass electrode were introduced as indicator electrodes. Their potentials with respect to the reference electrode (RR) were measured in the absence and presence of argon bubbles. The comparison with respect to the RP bubble sensitive electrode is presented in Figure 3. It can be concluded that the bubble effect appears only in the case when bubbles are in the contact with a porous plug of a reference electrode RP. When the electrode potential is affected only by reversible interactions with ionic species, the potential is relaxed and the effect of bubbles disappears.
60 50 40 30 20 10
mV 5050mV
0 -10 -20 -30 -40 0
1000
2000
3000
4000
t /t /ss
Figure 2. Device for measurements of the "bubbling potential": the reference electrode not exposed to bubbles (RR), the glass electrode (G) and the reference electrode with a porous plug exposed to bubbles (RP).
Figure 3. Potential of the glass (), the microcrystal Ag|AgCl () and the calomel electrode () vs. RR electrode at pH = 7, ionic strength of 10−3 mol dm−3 in the absence (white bands) and presence (blue bands) of argon bubbles. Distance between the capillary mouth and the porous plug was 0.5 cm and argon flow rate 50 dm3 h–1. Temperature: 25.0 °C Croat. Chem. Acta 86 (2013) 103.
Ψbb // mV mV
106
N. Kallay et al., Effect of Bubbling on the Potential of Reference Electrode 00 20
30
40
50
60
70
3 h1 J / 3dm J / dm h–1
–5 -5 –10 -10 –15 -15 –20 -20 –25 -25
// mV mV bΨ/bbmV
Figure 4. The effect of argon flow rate (J) on the bubbling potential of indicator RP electrode. Distance between the capillary mouth and the porous plug was 0.5 cm, pH = 7, ionic strength 10−3 mol dm−3, temperature 25.0 °C. Standard deviation is denoted.
00 0.0
0.5
1.0
1.5
2.0 cm hh//cm
–5 -5 –10 -10 –15 -15 –20 -20 –25 -25
Ψbb //mV mV
Figure 5. The effect of distance (h) between the capillary mouth and the porous plug surface on the bubbling potential of indicator RP electrode. Argon flow rate 50 dm3 h–1, pH = 7, ionic strength 10−3 mol dm−3, temperature 25.0 °C. Standard deviation is denoted. 5 5 0 0
1
2
3
4
5
–5 -5
6
7
8
9 pH pH
–10 -10 –15 -15 –20 -20
Figure 6. Dependency of bubbling potential Ψb of indicator RP electrode on pH at ionic strengths of 10−3 () and 10−2 () mol dm−3. Argon flow rate 50 dm3 h–1, distance between the capillary mouth and the porous plug 0.5 cm, temperature: 25.0 °C. Standard deviation is denoted when larger than symbol. Croat. Chem. Acta 86 (2013) 103.
was not sensitive on the possible variation of the flow rate and separation distance. The effect of pH on the bubbling potential was presented for two ionic strengths. Titrations of an acidic solution (HCl) with base (NaOH) at two different ionic strengths controlled by NaCl were performed at 25.0 °C. The results are presented in Figure 6. The isoelectric point of argon bubbles was found to be at pHiep = 3.9 at lower ionic strength of 10–3 mol dm–3 and was shifted to pHiep = 3.4 at ionic strength of 10–2 mol dm–3 (Figure 6). Above isoelectric point bubbling potential was found to be negative, while bellow pHiep the positive values were obtained. DISCUSSION Comparison of measured bubbling potentials (Figure 6) and electrokinetic data as found in literature5,7,24,25 clearly suggests that the bubbling potentials is somehow related, to electrokinetic -potentials. The bubbling potential is zero at the isoelectric point and follows the pattern of electrokinetic potential being significantly lower in value. For example, negatively charged bubbles in contact with the porous plug of the reference electrode would make its potential more negative. Due to the (average) separation between bubble and the porous plug the bubbling potential should be lower with respect to the -potential. The potential within the diffuse layer surrounding bubble decreases gradually from the original value at the onset of diffuse layer ( d). The d value is equal or slightly higher than the -potential. If the average separation distance between bubbles and porous ceramic plug is few nanometers, the bubbling potential ( b) at that distance will be of the same sign but significantly lower than -potential. The electrode potential of indicator electrode (commercial calomel electrode filled with 3 mol dm–3 KCl and separated from the solution with porous ceramic plug) is constant and does not depend on activities of H+ and OH– ions. However the electrode potential of indicator electrode is affected by the presence of bubbles, the potential of which is pH dependent. Therefore the bubbling potential may be considered as the -potential on the relative scale, but the relationship between these two physical quantities needs further examination. According to results presented in Figure 6, the isoelectric point of the argon/water interface was found to be pHiep = 3.9 at lower ionic strength of 10–3 mol dm–3 and was shifted to pHiep = 3.4 at ionic strength of 10–2 mol dm–3. Bubbling potential results agree with the data obtained by the electrophoresis: Takahashi5 found pHiep ≈ 4.3; Yang et al.6 measured pHiep ≈ 3.2 (at different concentrations of sodium chloride); Najafi et al.7 found that pHiep ≈ 2.3. Conclusion that bubbling potential corresponds to potential is additionally supported by finding that it was significantly reduced at higher electrolyte concentration.
N. Kallay et al., Effect of Bubbling on the Potential of Reference Electrode
The measurement of the bubbling potential by the proposed method is simple, fast and accurate. Therefore, this method may be used to examine the effect of e.g. temperature, solvent composition, different gases and electrolytes, etc. It may be considered a useful tool in studying the gas/water interface. Acknowledgements. Supported by the Ministry of Science, Education and Sports of the Republic of Croatia (project No. 119-1191342-2961).
REFERENCES 1. 2. 3. 4. 5. 6. 7. 8. 9. 10.
B. C. Garret, Science 303 (2004) 1146–1147. M. Chaplin, Water 1 (2009) 1–28. D. Ehre, E. Lavert, M. Lahav, and I. Lubomirsky, Science 327 (2010) 672–675. E. K. Wilson, Chemical and Engineering News, Science and Technology 88 (2010) pp. 35–36. M. Takahashi, J. Phys. Chem. B 109 (2005) 21858–21864. C. Yang, T. Dabros, D. Li, J. Czarnecki, and J. H. Masliyah, J. Colloid Interface Sci. 243 (2001) 128–135. A. S. Najafi, J. Drelich, A. Yeung, Z. Xu, and J. Masliyah, J. Colloid Interface Sci. 308 (2007) 344–350. N. Kallay, A. Čop, E. Chibowski, and L. Holysz, J. Colloid Interface Sci. 259 (2003) 89–96. J. K. Beattie and A. M. Djerdjev, Angew. Chem., Int. Ed. Engl. 43 (2004) 3568–3571. A. Härtl, J. A. Garrido, S. Nowy, R. Zimmermann, C. Werner,
11. 12. 13. 14. 15. 16. 17. 18. 19. 20. 21. 22. 23. 24. 25.
107
D. Horinek, R. Netz, and M. Stutzmann, J. Am Chem. Soc. 129 (2007) 1287–1292. T. Preočanin, A. Selmani, P. Lindqvist-Reiss, F. Heberling, J. Lützenkirchen, and N. Kallay, Colloids and Surfaces A: Physicochem. Eng. Aspects 412 (2012) 120–128. M. K. Petersen, S. S. Iyengar, T. J. F. Day, and G. A. Voth, J. Phys. Chem. 108 (2004) 14804–14806. R. Zangi, J. B. F. N. Engberts, J. Am. Chem. Soc. 127 (2005) 2272–2276. L. M. Pegram and M. T. Record Jr., Chem. Phys. Lett. 467 (2008) 1–8. C. J. Mundy, I-F. W. Kuo, M. E. Tuckerman, H-S. Lee, and D. J. Tobias, Chem. Phys. Lett. 481 (2009) 2–8. X. Sun, S. Yoo, S. S. Xantheas, and L. X. Dang, Chem. Phys. Lett. 481 (2009) 9–16. B. Winter, M. Faoubel, R. Vacha, and P. Jungwirth, Chem. Phys. Lett. 474 (2009) 241–247. A. Gray-Weale, Chem. Phys. Lett. 481 (2009) 22–24. S. C. Tian and Y. R. Shen, PNAS 106 (2009) 15148–15153. J. Lützenkirchen, T. Preočanin, D. Kovačević, V. Tomišić, L. Lövgren, and N. Kallay, Croat. Chem. Acta 85 (2012) 391–417. N. Spanos, P. G. Klepetsanis, and P. G. Koutsoukos, Encyclopedia of Surface and Colloid Science, Marcel Dekker Inc., New York, 2002, pp. 829–845. S. Usui, H. Sasaki, and H. Matsukawa, J. Colloid Interface Sci. 81 (1981) 80–84. J. Lützenkirchen, T. Preočanin, and N. Kallay, PCCP 10 (2008) 4946–4955. R-H. Yoon and J. L. Yordan, J. Colloid Interface Sci. 113 (1986) 430–438. S-H. Cho, J-Y. Kim, J-H. Chun, and J-D. Kim, Colloids and Surfaces A: Physicochem. Eng. Aspects 269 (2005) 28–34.
Croat. Chem. Acta 86 (2013) 103.