Proceedings of International Conference on Heat Exchanger Fouling and Cleaning VIII - 2009 (Peer-reviewed) June 14-19, 2009, Schladming, Austria Editors: H. Müller-Steinhagen, M.R. Malayeri and A.P. Watkinson Published online www.heatexchanger-fouling.com
CRYSTALLIZATION FOULING OF CaCO3 – EFFECT OF BULK PRECIPITATION ON MASS DEPOSITION ON THE HEAT TRANSFER SURFACE T.M. Pääkkönen1, M. Riihimäki1, E. Puhakka2, E. Muurinen1, C.J. Simonson3 and R.L. Keiski1 1
University of Oulu, Department of Process and Environmental Engineering, Mass and Heat Transfer Process Laboratory, P.O. Box 4300, FI-90014 University of Oulu, Finland,
[email protected] 2 VTT Technical Research Centre of Finland, P.O. Box 1000, FI-02044 VTT, Finland 3 University of Saskatchewan, Department of Mechanical Engineering, Saskatoon, SK, Canada
ABSTRACT Crystallization fouling occurs when dissolved salts precipitate from the aqueous solution. In the case of inversely soluble salts, like CaCO3, this may lead to crystal growth on heated surfaces. The crystallization may also take place in the bulk solution either via homogeneous nucleation or due to suspended material which act as nucleation centres. In this paper, surface crystallization of CaCO3 and crystallization in the bulk fluid and its effect on the mass deposition on a heated surface are studied. The fouling experiments are done in a laboratory scale set-up of a plate heat exchanger. SEM and XRD are used to determine the morphology and the composition of the deposited material. Particle precipitation in the bulk fluid is found to enhance markedly the mass deposition rate on the surface when compared to a case without bulk precipitation where fouling is due to crystal growth on the surface. The morphology of the CaCO3 crystals in the deposition on the surface is found to vary between experiments due to polymorph transformation or composite formation of calcite to aragonite. In addition, the deposition mechanism seems to change in the presence of the bulk fluid particles. INTRODUCTION Fouling, which is often described as the deposition of unwanted material on a heat transfer surface, diminishes the heat transfer and increases the pressure drop of the system. Due to fouling, operation and maintenance costs are increasing significantly. By decreasing the fouling of heat exchangers, harmful environmental and economical effects can be reduced. One detrimental fouling mechanism in a wide range of industrial applications is crystallization fouling. Crystallization fouling is caused by sparingly soluble salts, like CaCO3, which precipitate out of solution due to supersaturation. Impurities, like non-crystallized, inert particles or bulk crystallized particles, in the solution may enhance the fouling rate and thus overrun actual surface crystallization fouling (Bansal et al., 2003). Separate fouling mechanisms, especially crystallization fouling alone, have been studied quite extensively. It has been found out that interactions between different fouling mechanisms may affect notably the fouling rate
(Sheikholeslami, 2000). In the case of crystallization fouling, supersaturated conditions may occur also in the bulk fluid and thus there is a possibility that crystallization may occur also in the bulk fluid (homogenious nucleation) in addition to surfaces (heterogeneous nucleation) (Chen et al., 2008; Schreier & Fryer, 1995). The effects of bulk crystallized or suspended particles in the bulk fluid have been reported to be contradictory. Bansal et al. (2001, 1997) found that bulk crystallized particles augmented the fouling rate of CaSO4 whereas non-crystallizing particles were found to mitigate the fouling (Bansal et al., 2003). In contrast, Hasson and Karman (1984) reported that crystallized CaCO3 particles did not affect significantly the surface crystallization rates in pipes in highly supersaturated conditions (Bramson et al, 1995). Hasson and Zahavi (1970) and Bramson et al. (1995) also suggested that the effect of particles on the crystallization fouling of CaCO3 and CaSO4 may be contradictory. Determination of the effects of bulk crystallization on fouling is essential for proper modeling and for the prevention of composite fouling which includes both bulk crystallization and surface growth. In this study, the composite effect of bulk crystallized CaCO3 particles and surface crystallization of CaCO3 are studied by comparative experiments in conditions that corresponds to that of industrial plate heat exchangers. For surface crystallization experiments, the effect of bulk crystallization is excluded by using filters in-line of the experimental set-up. The main objective is to determine, how the crystallized CaCO3 particles in the bulk fluid affect the fouling rate and what fouling mechanism is dominant when there are crystallized particles in the bulk fluid. METHODS Experimental set up Experiments are performed in an experimental set up mimicking a plate heat exchanger. A more complete description of the set up is given in Riihimäki et al. (2009). The set up contains a test section made of two stainless steel (AISI 316L) flat plate test surfaces, size of 0.1 m x 0.2 m. The surfaces of the test sections are milled, and the average Ra value for the surface is 0.7 µm. The test sections are heated by ohmic heaters (Watlow Firerod, 230V/1000W)
209
Pääkkönen et al. / Crystallization Fouling …
embedded in the walls of the test section. The ohmic heaters are connected to a power transmitter (TEXLAB ACP100) to get constant, but adjustable heat flux. The test sections can be changed for analysis and to study different surface materials and structures. The test solution is prepared by mixing equivalent amounts (0.5 g/l) of CaCl2 (BDH Prolabo) and NaHCO3 (BDH Prolabo) salts with deionized water. The solution is circulated to the test section from a mixing tank (100 dm3) by pumping it through a double pipe heat exchanger which is used to set the inlet temperature of the test section to a desired value. Conductivity of the solution is controlled by adding conductivity control solution (1.5 g/l CaCl2 and 1.5 g/l NaHCO3) automatically to the mixing tank. The conductivity control is used to keep the concentration level in the test loop approximately constant, and thus to replace the ions that are removed during crystallization of the salts. Two different kinds of filters in series (Watman washable nylon 60 µm and Watman polypropene 1 µm) are assembled in-line of the set up before the test section in order to remove bulk precipitated particles from the test solution when only surface crystallization is studied (later called experiments with filters). For the experiments where the effect of bulk precipitated material is investigated, filters are removed from the set up (later without filters). The controlled variables in the test system are flow velocity, bulk fluid temperature, inlet temperature to the test section, and conductivity. The flow rate is measured using a Bürkert 8045 Electromagnetic Flow Transmitter, and controlled with a control valve (Bürkert 2632). The conductivity is measured (Bürkert 8225) and controlled with a magnetic on-off valve (Bürkert 0124). The temperatures of the inlet and outlet fluids and the heated walls are measured with SKS Automaatio Oy K-type thermocouples. There are three temperature measurement points at the surface of the test section. The control and data acquisition system is built on the National Instruments Inc. components on compact Field point 2100 platform and uses LabView 8.0 software. Average fluctuation during the experiments in the wall temperature is ±1 % from the moving average, and in the bulk temperature ±2% from the set point. The flow rate is accurate within ±10%, and the heat flux within ±5% from the set point. Experimental procedure In every experiment, the mixing tank is first filled with deionized water. After that, the water is heated up to a desired value by circulating it in the set up with test section heaters and tank heaters on. The test solution is created by dissolving desired amounts of salts separately to a small amount of heated deionized water. The two concentrated salt solutions are slowly added to the mixing tank in which the heated deionized water is circulated. Then, the fluid is circulated through the whole set-up until the conductivity reaches a steady value in order to ensure full mixing of the salts. Following this, heating of the test section is again turned on, and test begins when the temperature of the test section surface and fluid inlet temperature to the test section are stabilized.
The fouling experiments were done with four different fluid velocities (0.20, 0.27, 0.33, 0.40 m/s; average velocity in the test section) indicating Reynolds numbers 5200, 6900, 8900, 10400, respectively, when the nominal flow channel gap between the plates is 15 mm. Thus, the flow in the test section is in transition or near to fully turbulent flow regime. Heat fluxes of 47, 52, 57, and 63 kW/m2 were tested. The temperature of the surface changes depending on the flow velocity and heat flux. The studied conditions correspond to the conditions occurring often in industrial plate heat exchangers. The amount of particles precipitated to the bulk fluid depends on the bulk temperature (Sheikholeslami, 2000). Thus, the experiments done with the in-line filters are performed at quite low, constant bulk temperature (30°C) to ensure equal bulk concentration, and amount of particles in every test. In certain experiments, the bulk temperature is increased to 40°C to increase amount of bulk precipitated particles. Fouling resistance and mass deposition rate The heating system produces a constant heat flux to the test section which means that the surface temperature increases as the resistive fouling layer grows on the surface. The interfacial temperature between the fluid and the deposition remains constant. Fouling resistance is used to describe the formation of the resistive fouling layer on the surface. The fouling resistance in Eq. (1) is calculated from the surface temperature elevation by using equation for heat transfer coefficient. Thus, the fouling curve describes the change in the fouling resistance due to growth of the fouling layer on the surface by the time. 1
1
1
Fouling resistance is calculated from (Mwaba et al., 2006; Krause 1993): 2
Equation (2) yields Eq. (3) when the heat flux and the bulk temperature are considered to be constant: 3 Fouling resistance can be calculated from thickness and density of the fouling layer: 4
www.heatexchanger-fouling.com
210
Heat Exchanger Fouling and Cleaning VIII – 2009
ρ ·
5
The mass deposition rate is then:
ρ ·
·
6
·
Product of the density and the heat conductivity of the fouling layer is assumed to be 5000 kg W/m4 K (Watkinson et al., 1986). Defining the model parameters In the literature, crystallization fouling is quite often considered to be reaction controlled (Bansal and MüllerSteinhagen, 1993; Augustin and Bohnet, 1995), and the order of the reaction is assumed to be two (Helalizadeh et al., 2005; Augustin and Bohnet, 1995). Thus, the diffusion term in the mass deposition equation can be neglected, and we end up with the following equation: 7 In Eq. 8, kr is the reaction rate constant which depends on temperature, and can be described by Arrhenius expression: 8 Reaction rate constant, kr, in Eq. (9), is obtained from experiments by calculating the mass deposition rate from experimentally obtained fouling resistances in different initial wall temperatures, and dividing it with square of the concentration difference. The interface concentration, ci, can be assumed to be bulk concentration, cb, when reaction controls the fouling process (Mwaba et al. 2006). ·
· ·
9
Activation energy, Ea, and pre-exponential factor, k0, can be calculated based on the Arrhenius relation (Eq. 8) from the experimental results by plotting ln kr as a function of the inverse value of the initial surface temperature and gas constant (ln kr vs. 1/TR) (Eq. 10). Activation energy is then obtained from the slope of the line and pre-exponential factor from the intersection of the ln kr axis and the line. ln
ln
ln
10
RESULTS AND DISCUSSION Experimental fouling results – surface crystallization Fouling experiments with the filters in-line of the set up were carried out to study surface crystallization. The experiments were done with different heat fluxes and flow velocities. Fig. 1 presents an example of repeatability of the experiments. Repeatability was found to be satisfactory. The difference in the average fouling rates calculated from the best fit line of the linear part of the fouling curves was about 12%. 1,4E‐04
Fouling resistance [m 2 K/W]
The mass deposition rate is calculated by multiplying density of the fouling layer with the rate of change in thickness:
1,0E‐04
6,0E‐05
2,0E‐05
‐2,0E‐05
0
50
100
150
Time [min]
Fig. 1. Fouling resistance in two tests done in equal conditions to study repeatability of the experiments. Fig. 2 presents examples of the fouling resistances versus time in the experiments where the flow velocity is varied with a constant heat flux (53 kW/m2) (a) and the heat flux is varied with a constant flow velocity (0.27 m/s) (b). Increase in the heat flux slightly augments the fouling resistance, and increase in the flow velocity decreases it. Thus, the behavior of fouling in different conditions corresponds to those found from literature for crystallization fouling. The results show that the effect of the heat flux is quite small compared to the effect of the flow rate. However, this might be due to stronger effect of the flow velocity on the wall temperature or quite small differences in the studied heat fluxes. The dependency of the fouling rate on surface temperature and flow velocity is presented in Fig. 3, which presents the mass deposition rate as a function of the initial surface temperature (a) and the flow velocity (b). Composite effects of the parameters, like effect of velocity to surface temperature, are ignored. The mass deposition rate is calculated from the linear part of the fouling resistance curve, which takes place after induction time at the beginning of the experiments. A strong correlation between the initial surface temperature and the mass deposition rate is found, especially with higher surface temperatures. Also a correlation between the flow velocity and the mass deposition rate can be seen in the studied conditions.
www.heatexchanger-fouling.com
211
Pääkkönen et al. / Crystallization Fouling …
v=0.2m/s
Fouling resistance [m 2 K/W]
v=0.27m/s v=0.33m/s
1,0E‐04
v=0.4m/s 6,0E‐05
2,0E‐05
‐2,0E‐05
0
100
200 Time [min]
300
400
a) 8,0E‐05
Fouling resistance [m 2K/W]
q=62kW/m2 q=59kW/m2
6,0E‐05
q=53kW/m2 4,0E‐05
2,0E‐05
‐1,0E‐19 0
50
100
150
‐2,0E‐05
200
250
300
350
400
Time [min]
Mass deposition rate [kg/m 2 s]
b) Fig. 2. Fouling resistance (a) with different velocities when the heat flux is 53 kW/m2 and (b) with different heat fluxes when the velocity is 0.27 m/s (Re=6900).
Mass deposition rate [kg/m 2 s]
a)
b)
concentration on the surface compared to the bulk fluid concentration. A high temperature on the surface enhances also the surface integration of the ions to the surface because surface integration is strongly temperature dependent. In the experiments, temperature gradients of 45°C, 50°C, and 55°C corresponding to the surface temperatures of 75°C, 80°C, and 85°C, respectively, are studied by changing the heat flux while the bulk temperature is kept constant. Fig. 4 shows that the effect of the initial surface temperature or temperature gradient is large at lower velocity, but negligible at higher velocity. Fig. 4 also shows the effect of the velocity when the surface and bulk temperatures, and thus the temperature gradient is kept constant. It can be observed that the velocity has a considerable influence on the mass deposition rate especially when the temperature gradient is high (black line). This verifies that the effect of the flow rate cannot be totally neglected in modeling equations. Mass deposition rate [kg/m 2 s]
1,4E‐04
4,0E‐05
Tgrad=55°C Tgrad=50°C
3,0E‐05
Tgrad=45°C 2,0E‐05 1,0E‐05 0,0E+00 0,15
0,2
0,25
0,3 0,35 Velocity [m/s]
0,4
0,45
Fig. 4. Mass deposition rates with different temperature gradients for different flow rates.
5,0E‐05 4,0E‐05 3,0E‐05 2,0E‐05 1,0E‐05 0,0E+00 65
70
75 80 85 Initial wall temperature [°C]
90
95
5,0E‐05 4,0E‐05 3,0E‐05 2,0E‐05 1,0E‐05
The results may indicate that the crystallization, which usually is defined to be a combination of diffusion of the ions to the vicinity of the surface and surface integration (or reaction) of the ions on the surface, seems to be more strongly controlled by the temperature than the velocity with lower flow velocities. This means that the strongly temperature depended surface integration controls the fouling process at lower velocities. At higher flow velocities the effect of the velocity becomes more meaningful and dominates the temperature effect. The experimental data shows a trend that fouling decreases as the velocity increases, even though the diffusion of ions to the surface increases with the velocity. This means that the dominance of flow is not due to enhanced diffusion at high velocities, but possibly due to removal or breakage of the crystals, or from the changes in the morphology of the deposition layer or in crystal structure at high velocities.
0,0E+00 0,15
0,2
0,25
0,3 0,35 Velocity [m/s]
0,4
0,45
Fig. 3. Correlation between the mass deposition rate and the initial wall temperature (a), and the flow velocity (b). High enough temperature gradient, the temperature difference between the initial surface temperature and the bulk temperature, affects crystallization fouling by ensuring driving force for surface reaction with highly supersaturated
Activation energy. Activation energy is calculated from the average mass deposition rates by assuming, as often in literature (Bansal and Müller-Steinhagen, 1993; Augustin and Bohnet, 1995), that crystallization is controlled by the second order reaction, described in Eq. 7. Fig. 5 presents linear correlation of the results. Based on the set of 21 experiments (Tw,init = 70-95°C, v = 0.2-0.4 m/s), the average values for the activation energy and preexponential factor are found to be 162 kJ/mol and
www.heatexchanger-fouling.com
212
Heat Exchanger Fouling and Cleaning VIII – 2009
‐6 0,00032
0,00033
0,00034
0,00035
0,00036
v=0.27m/s, no filtered v=0.4m/s, no filtered
1,0E‐04
v=0.27m/s, filtered v=0.4m/s, filtered
6,0E‐05
2,0E‐05
ln kr
‐8
1,4E‐04
Fouling resistance [m 2K/W]
6.4·1019 m4/kg s, respectively. These values are higher than those found from the literature (e.g. Augustin and Bohnet, 1995: Ea = 118 kJ/ mol, k0 = 4.98·1011 m4/kg s).
‐10
‐12
0
‐2,0E‐05
y = ‐162241x + 45,608 R² = 0,783
100
200
300
400
Time [min]
a) 1,4E‐04
1/RT
Fig. 5. Activation energy and pre-exponential factor obtained from the experimental results. The above correlation for the activation energy does not take into account the effect of flow velocity. However, based on the earlier presented results, the velocity may affect the removal or breakage of the crystals, or on morphological changes. To take this into account, possibly additional terms for the effects should be added to the model, and use non-linear regression to correlate values for the activation energy and the pre-exponential factor. To verify need of other parameters, the activation energy and pre-exponential factor are calculated separately for different velocities. The values are found to depend strongly on velocity (Ea varies between 38 and 162 kJ/mol and A between 6.4·1019 and 9.7·101) which proves that other factors need to be considered in future. Experimental fouling results – bulk precipitation To study the effect of bulk precipitation on the mass deposition on the surface, the bulk temperature needs to be set at the value where both surface and bulk crystallization occur. These conditions are obtained for saturated solution with a high enough surface temperature and temperature gradient to ensure surface crystallization, and high enough bulk temperature to get crystallization in the bulk fluid. For this, the bulk temperature is set to 30°C, heat flux is varied between 53 kW/m2 and 59 kW/m2, and velocity is between 0.27 m/s and 0.4 m/s. The surface temperatures for the studied conditions are between 69°C and 85°C. Fig. 6 a) presents the effect of the velocity when the heat flux is set to 53 kW/m2 and b) the effect of the heat flux when the velocity is set to 0.27 m/s for the experiments performed with (thin lines) and without (thick lines) in-line filters. Fig. 6 shows that the effect bulk precipitation is very significant in every studied case. The deposition of the bulk precipitated material increases the average deposition rate by 74% and 81%, when the heat flux is 53, and 59 kW/m2, respectively. Increase in the deposition rate for the velocities of 0.27 and 0.4 m/s are 90% and 85%, respectively.
Fouling resistance [m 2 K/W]
‐14
1,0E‐04
q=59kW/m2_nofiltered q=53kW/m2_nofiltered q=59kW/m2_filtered q=53kW/m2_filtered
6,0E‐05
2,0E‐05
‐2,0E‐05
0
100
200
300
400
Time [min]
b) Fig. 6. Effect of the filters on the fouling resistance when the flow velocity (a) and the heat flux (b) are varied. If the filters are not used in the experimental set up, the amount of the bulk crystallized material increases with the bulk temperature because the homogeneous crystallization in the bulk fluid is increased due to an increasing degree of supersaturation. This was observed from the mixing tank during the experiments. During the lower temperature tests without filters, the bulk fluid was quite clear with slightly grayish color, while during higher temperature tests, the bulk fluid was very turbid. During all the tests with filters, the bulk fluid was crystal clear. Thus, the bulk temperature is varied between 30°C and 40°C in order to determine the effect of bulk crystallized particles on deposition (Fig. 7) in the experiments done without filters. In these experiments, the flow velocity is kept constant, and the influence of heat flux and the surface temperature are studied. The studied bulk temperatures (Fig. 7) do not have a large effect on the average fouling rates. At the initial state, the fouling rate is slightly higher with the higher bulk temperature due to greater amount of bulk precipitated particles, and likely also particulate fouling. However, the shape of the fouling curve with higher bulk temperature is more asymptotic whereas with the lower bulk temperature, the shape is more linear. This may be due to the fact that with a higher bulk temperature, when the bulk precipitated particles deposit to the surface, the amount of particles in the bulk fluid decreases with time, and thus fouling due to particulates slows down. Fouling due to surface growth of the crystals is also less because of the lower bulk concentration of ions and thus lower driving force for the surface integration.
www.heatexchanger-fouling.com
213
Pääkkönen et al. / Crystallization Fouling …
1,4E‐04
Fouling resistance [m 2 K/W]
Tw=77°C_Tb=30°C Tw=85°C_Tb=40°C 1,0E‐04
10 µm
6,0E‐05
2,0E‐05
‐2,0E‐05
0
50
100
150 200 Time [min]
250
300
350
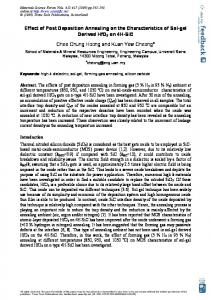
Fig. 7. Effect of the bulk temperature on the fouling resistance when the filters are not used. This study indicates that both fouling mechanisms, surface crystallization and particulate fouling of bulk precipitated material, occurs simultaneously in the conditions used when the filters are not used. Particulate fouling increases at least with increasing bulk temperature. However, the role of each mechanism depends on other conditions too, and more experiments are needed to quantify the role of the two fouling mechanisms in the composed fouling. Analysis of the deposited material - filtered The deposited material is analysed by Scanning Electron Microscope (SEM) (Jeol JSM-6400) and X-ray Diffraction (XRD) (Siemens D5000) to characterize the morphology and composition of the deposition. Samples are taken from the selected experiments to find out the composition in different conditions. Calcium carbonate crystals may exist in three forms: aragonite, calcite, and vaterite. All the forms are inversely soluble, and their saturation concentration decreases with increasing temperature (Plummer and Busenberg, 1982; Helilazadeh et al., 2000). Calcite is thermodynamically stable whereas aragonite is metastable and may change to calcite. The transformation rate increases with increasing temperature, and if the polymorph is in contact with water or solution containing calcium carbonate, transformation may occur even at room temperature. (Sheikholeslami and Ng, 2001). SEM images indicate that the deposits contained several different types of morphologies. The deposits presented in Fig. 8 a) are orthorhombic, needle-shaped crystals that are couple hundred micrometers long and about 5-10 µm of diameter. For this case, bulk precipitation was prevented by using filters in the experiment set up. Based on XRD, the sample contained 98% of aragonite. The deposits in Fig. 8 b) are hexagonal, round-shaped particles that are 5-10 µm in diameter, and contained 93% of calcite. In this case, also bulk precipitation occurred because filters were not used.
a) b) Fig. 8. SEM images of the deposited material with (a) and without (b) filters used in-line of the set-up. Despite the quite clear results presented in Fig. 8, most of the samples taken during the tests contained different crystal morphologies, and both calcite and aragonite. Based on several SEM analyses (examples in Fig. 9 and 10), the amount of needle-shaped crystals seemed to be quite high for the filtered cases, but XRD proved the ratio of calcite and aragonite to be approximately, 85-90% of calcite and 10-15% of aragonite, for all cases. One XRD and SEM analysis (Fig. 11) was done from the bulk fluid sample. SEM analysis showed only roundshaped particles in the sample. Based on XRD, the amount of calcite was 93% and aragonite 7%. Based on the analyses of the crystal structure and the composition of the depositions, it seems that formation of both calcite and aragonite is present. In the XRD analyses, at least velocity was found to change the calcite/aragonite ratio. For the velocity of 0.267 m/s, the amount of calcite was 85% whereas for the velocity of 0.4 m/s the amount was 100% while surface and bulk temperatures were kept constant. This proves that changes in the crystal structure occurred due to change in velocity. More experiments and analyses are required to find out more detailed what parameters, in addition to velocity, have an effect on the formation of aragonite and calcite, and how this affects the deposition rate. However, according to the literature (Cowan and Weintritt, 1976; Cho et al., 1997), more aragonite (∼80%) is formed than calcite (∼20%) at temperature above 30°C. In addition, the crystalline phase depends on supersaturation at the surface, with aragonite precipitating at higher supersaturations than calcite (Turner and Smith, 1998). Thus, it seems that in our case calcite is precipitating in the cool bulk fluid and depositing then to the surface while aragonite is more likely precipitating directly on the heated surface due to higher supersaturation. The experimental data support this conclusion because the material precipitated in the cool bulk fluid is mostly calcite while heated surface contains more aragonite. However, surface growth of calcite is also possible, especially with lower bulk and surface temperature. In addition, the experiments are done in the conditions where the crystalline phase transformation from aragonite to calcite may occur.
www.heatexchanger-fouling.com
214
Heat Exchanger Fouling and Cleaning VIII – 2009
polymorph changes should be added to the model equations of crystallization. In the experiments performed without filters, the bulk precipitated material was found to increase the fouling resistance significantly. Shape of the fouling resistance curve was observed to change due to an increase in the bulk temperature. Results indicated that the extent of particulate fouling was then increased. However, more experiments are needed to quantify the portions of the two fouling mechanisms in the composed fouling. a) b) Fig. 9. SEM images from the case where filters are in use (a) and from the case where filters are not used (b), other conditions are equal.
a) b) Fig. 10. SEM images from the cases where the filters are not used, but the bulk temperature is decreased from 40°C (a) to 30°C (b).
ACKNOWLEDGEMENTS This study was financed by the Graduate School for Energy Science and Technology (EST) and the MATERA ERA-Net cooperation between VTT Technical Research Centre of Finland (VTT), University of Oulu, SINTEF and University College Dublin by Finnish Funding Agency for Technology and Innovations (Tekes) and industrial partners. Jenny and Antti Wihuri Foundation and Tauno Tönning Foundation are also acknowledged for the support. The authors greatly acknowledge the research partners and the founding organizations. NOMENCLATURE c concentration, kg/m3 Ea activation energy, J/mol md mass deposition rate, kg/m2 s kr reaction rate constant, m4/kg s k0 pre-exponential factor, m4/kg s q heat flux, W/m2 R gas constant, J/mol K Rf fouling resistance, m2 K/W SEM Scanning Electron Microscopy U total heat transfer coefficient between the heated surface and bulk fluid, W/m2 K T temperature, K t time, s x thickness, m XRD X-ray Diffraction Greek letters λ heat conductivity, W/m K ρ density, kg/m3
Fig. 11. SEM image from the bulk sample when the filters are not used. CONCLUSIONS The present investigation concerned surface crystallization and composite fouling of bulk precipitated and surface crystallized CaCO3. Filters in the experimental set up were used to remove bulk precipitated particles when only surface crystallization was studied. In the experiments where only surface crystallization was studied, especially higher flow rates were found to have more significant effect than the surface temperature or temperature gradient on mass deposition rate. This effect is not due to diffusion but probably because of removal of the deposition or due to changes in polymorphs which, based on XRD and SEM analyses, take place in our experiments. Thus, in addition to the reaction, also effects due to hydrodynamics and
Subscript/superscript b bulk f fouling layer i interfacial t at the certain time t w wall/surface 0 initial * saturation REFERENCES Augustin, W., and Bohnet, M., 1995, Influence of the ratio of free hydrogen ions on crystallization fouling, Chemical Engineering and Processing, Vol. 34, pp. 79-85. Bansal, B., Chen X., and Müller-Steinhagen, H., 2003, Use non-crystallizing particles to mitigate crystallization
www.heatexchanger-fouling.com
215
Pääkkönen et al. / Crystallization Fouling …
fouling, Int. Comm. Heat Mass Transfer, Vol. 5, (30), pp. 695–706. Bansal, B., Müller-Steinhagen, H., and Chen X., 2001, Comparison of crystallization fouling in plate and doublepipe heat exchangers, Heat Transfer Engineering, Vol. 22, (5), pp. 13–17. Bansal, B., Müller-Steinhagen, H., and Chen, X., 1997, Effect of suspended particles on crystallization fouling in plate heat exchangers, Journal of Heat Transfer, Vol. 8, (119), pp. 568-574. Bansal, B., and Müller-Steinhagen, H., 1993, Crystallization fouling in plate heat exchanger, ASME Journal of Heat Transfer, Vol. 115, pp. 584-591. Bramson, D., Hasson. D., and Semiat, R., 1995 The roles of gas bubbling, wall crystallization and particulate deposition in CaSO4 scale formation, Desalination, Vol. 100, pp. 105-113. Chen, Y. C., Quan, Z. H., and Ma, C. F., 2008, Investigation of fouling process for convective heat transfer in a annular duct, ECI Symposium Series, Volume RP5: Proceedings of 7th International Conference on Heat Exchanger Fouling and Cleaning – Challenges and Opportunities, 1.-6.7.2007, Tomar, Portugal, eds. H. Müller-Steinhagen, M. R. Malayeri, and A. P. Watkinson, Engineering Conferences International, The Berkeley Electronic Press, Article 30. Cho, Y. I., Fan, C., and Choi, B.-G., 1997, Theory of electronic anti-fouling technology to control precipitation fouling in heat exchangers, Int. Comm. Heat Mass Transfer, Vol. 24, (6), pp. 757-770. Cowan, J. C., and Weintritt, D. J., 1976, Water formed scale deposits, Gulf Publishing Company, Houston, Texas. Hasson D, and Karman M., 1984, Novel process for lining water mains by controlled calcite deposition, Corrosion prevention and control, Vol. 31, pp. 9-17. Hasson D, and Zahavi J., 1970, Mechanism of calcium sulphate scale deposition on heat transfer surface, Industrial and Engineering Chemistry Fundamentals, Vol 9, (1). Helalizadeh, A., Müller-Steinhagen, H., and Jamialahmadi, M., 2005, Mathematical modelling of mixed salt precipitation during convective heat transfer and subcooled flow boiling, Chemical Engineering Science, Vol. 60, pp. 5078-5088.
Helalizadeh, A., Müller-Steinhagen, H., and Jamialahmadi, M., 2000, Mixed salt crystallization fouling, Chemical Engineering and Processing, Vol. 39, pp. 29-43. Krause, S., 1993, Fouling of heat transfer surfaces by crystallization and sedimentation, International Chemical Engineering, Vol. 33, No. 3. pp. 335-401. Mwaba, M. G., Rindt, C. C. M., Steenhoven, A. A., and Vorstman, M. A. G., 2006, Experimental investigation of CaSO4 crystallization on a flat plate, Heat Transfer Engineering, Vol. 27, (3), pp. 42-54. Plummer, L. N. and Busenberg, E., 1982, The solubilities of calcite, aragonite and vaterite in CO2 – H2O solutions between 0°C and 90°C, and evaluation of the aqueous model for the system CaCO3 – CO2 – H2O, Geochim. Cosmochim Acta, 46, pp. 1011-1040. Riihimäki, M., Puhakka, E., Pääkkönen, T. M., and Keiski, R. L., 2009, Fouling in high solid content slurry effect of nucleating air and background electrolyte, International Conference on Heat Exchanger Fouling and Cleaning – 2009, manuscript. Sheikholeslami, R., 2000, Composite fouling of heat transfer equipment in aqueous media – a review, Heat Transfer Engineering, Vol. 21, pp. 34-42. Sheikholeslami, R., and Ng, M., 2001, Calcium sulphate precipitation in the precence of nondominant calcium carbonate: thermodynamics and kinetics, Ind. Eng. Chem. Res., Vol. 40, pp. 3570-3578. Schreier, P. J. R., and Fryer, P. J., 1995, Heat exchanger fouling: A model study of the scale up of laboratory data. Chemical Engineering Science, Vol. 50, (8), pp. 1311-1321. Turner, C. W., and Smith, W. S., 1998, Calcium carbonate scaling kinetics determined from radiotracer experiments with calcium-47, Industrial & Engineering Chemistry Research, Vol. 37, pp. 439-448. Watkinson, A. P., 1986, Water quality effects on fouling from hard waters, Heat Exchanger Sourcebook, Hemisphere Publishing Corp., New York.
www.heatexchanger-fouling.com
216