Research Article
Advanced Materials Letters
Adv. Mater. Lett. 2016, 7(2), 104-110
www.amlett.com, www.vbripress.com/aml, DOI: 10.5185/amlett.2016.6090
Published online by the VBRI Press in 2016
Effect of different concentrations of dopant titanium dioxide nanoparticles on electro-optic and dielectric properties of ferroelectric liquid crystal mixture Pradeep Kumar, Avinash Kishore, Aloka Sinha* Department of Physics, Indian Institute of Technology Delhi, 110016, India *
Corresponding author. Tel: (+91) 11-26596003; E-mail:
[email protected]
Received: 09August 2015, Revised: 15 December 2015 and Accepted: 23 December 2015
ABSTRACT In the present study, the insulating titanium dioxide (TiO2) nanoparticles were dispersed in two different concentrations of 0.5 wt % and 1.0 wt % in pure ferroelectric liquid crystal (FLC) mixture, W206E. The effects of different concentrations of dopant TiO2 in W206E for electro-optical and dielectric properties have been studied. The optical microscopy measurements clearly show the isotropic transition temperature of both the doped samples slightly increases by about 1 ~ 2 0C as compared to the pure sample. Further, with the increasing concentrations of dopant TiO 2, the value of spontaneous polarization decreases. The value of dielectric permittivity also decreases for both the doped samples and this decrease in the value of permittivity is more prominent with increasing concentrations of TiO2 at the lower frequencies. The dielectric measurements also confirm the presence of Goldstone mode in Smectic C* phase in pure as well as in both the doped samples. The conductance measurements confirm the decrease in conductivity of doped samples as compared to the pure W206E FLC. This study may help in improving the transition temperature and reducing the impact of free ionic charge impurities on various physical properties of liquid crystal host by screening the free ions using TiO2 nanoparticles as dopant. Copyright © 2016 VBRI Press. Keywords: Ferroelectric liquid crystal; titanium dioxide nanoparticles; transition temperature; spontaneous polarization; dielectric behavior.
Introduction Ferroelectric liquid crystals (FLCs), have attracted the significant attention of researchers since it has been discovered in 1975 by Meyer [1] due to their physical properties which can be used in various electro-optical applications such as displays, spatial light modulators for optical processing and optical storage [2-4]. The new and modern devices require liquid crystals (LCs) with improved properties. It is difficult to synthesize new liquid crystal materials with enhanced properties due to the complexity in the synthesis of new LC materials. It has been observed that the doping of nanoparticles in different FLC mixtures can enhance their physical properties like frequency modulation response, faster switching time, non-volatile memory effect and lower operating voltage [5-7] which may be useful in the designing and fabrication of modern and sophisticated devices. The doping of different types of nanoparticles i.e. metallic, semiconducting, dielectric, ferroelectric, ferromagnetic in liquid crystal has been studied by different research groups. Doping of small amount of silica nanoparticles in FLCs has improved the switching time and memory effect [8]. FLCs doped with metal nanoparticles such as gold, palladium, platinum enhances the switching Adv. Mater. Lett. 2016, 7(2), 104-110
time and luminescent properties [9, 10]. Semiconducting nanoparticles such as zinc oxide when dispersed in FLCs, reduce the threshold voltage and improve the optical contrast of the display devices [11]. Doping of ferroelectric barium titanate (BaTiO3) nanoparticles results in the enhancement of the switching time, transition temperature and decrement in the polarization of FLCs [12,13]. It has been observed that, the impurity ions present in LCs are responsible for the lower contrast, slower response time and high threshold voltage. The addition of insulating nanoparticles such as diamond powders in LCs reduces the impurity ion concentration and thereafter decreases the transient current and threshold voltage. A significant amount of research has been done on TiO2 nanoparticles due to its existence in different phases and therefore exhibit different physical properties which may be utilized for the design and fabrication of novel photonic devices [14] and for other applications such as gas sensors [15]. Apart from this TiO2 nanoparticles are the best candidates for the suppression of free ionic charges present in liquid crystal due to trapping of free ions by dopant TiO2 nanoparticles. A very small amount of ionic impurities are always present in each liquid crystal, it may originate from different sources i.e. during the synthesis of liquid crystal, chemical decomposition of liquid crystal and aging etc. These ionic Copyright © 2016 VBRI Press
Research Article
Adv. Mater. Lett. 2016, 7(2), 104-110
impurities always degraded the performances of liquid crystal based devices. The decrement in contrast ratio, enhancement in operating voltage and slower response time are some of the common problems arise due to the presence of free ions in liquid crystals. The doping of TiO2 nanoparticles in nematics liquid crystal has reduced the ion concentration and hence ion current and voltage holding ratio [16, 17]. While in case of FLC the doping of TiO2 has reduced the conductivity [18]. It has been observed by Tang et al. [19], that the doping of anatase titania (TiO2) nanoparticles in nematics liquid crystals lowers the ionic concentration, diffusion constant, activation energy and improves the voltage holding ratio. Recently, Gupta et al. [20] reported the decrease in response time, conductivity and increase in spontaneous polarization of TiO2 doped FLC. A significant amount of research work has been devoted in nanodoping of liquid crystals but still there are many conflicting results and explanations and hence nanodoping of liquid crystals need further systematic investigations. In this paper, we report the effect of doping of two different concentrations of insulating TiO2 nanoparticles in pure FLC mixture acronym W206E on the transition temperature, spontaneous polarization, dielectric behavior and conductivity of TiO2 doped W206E samples.
Advanced Materials Letters
Characterizations The filled cells were studied at different temperatures for different liquid crystal phase’s present, spontaneous polarization and dielectric behavior. The temperature controller INSTEC mK-1000 was used for all these observations. The optical polarizing microscopy measurements were carried out using OLYMPUS BX-51. The spontaneous polarizations were determined by current reversal technique using function generator Tektronix AFG 3021 and oscilloscope Tektronix TPS 2024. The molecular and collective dynamics were studied by dielectric spectroscopy using Agilent E4980A LCR meter in the frequency range of 20 Hz to 2MHz.
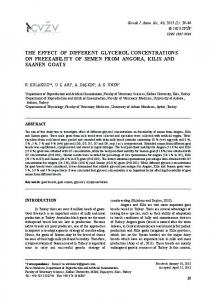
Experimental Materials The FLC mixture W206E utilized for the present study has the following phase sequence; Fig. 1. Optical micrographs of pure W206E sample.
The TiO2 nanoparticles with particle size 18~24 nm, obtained from Sigma Aldrich USA, were used to prepare two different concentrations of TiO2 nanocomposites W206E + 0.5 wt %TiO2 and W206E + 1.0 wt %TiO2. Synthesis of liquid crystal nanocomposites and cell fabrication To prepare each nanocomposite sample, TiO2 nanoparticles in fixed proportion were first mixed in pure W206E, and then chloroform was added to the W206E + TiO2. Thereafter the mixture was sonicated using ultrasonicator till the solution was visibly homogeneously mixed and after that the solution was left for 3~4 hours at temperature 40~ 450C or till the chloroform evaporated completely in order to get nanocomposites of the respective concentrations. The liquid crystal cells were prepared using indium tin oxide (ITO) coated glass plates. The square patterns on ITO- coated glass substrates were created using optical lithography. Thereafter, a thin layer of nylon solution was deposited and antiparallel rubbing was performed on the pairs of glass substrates to get homogeneous alignment and finally a Mylar spacer of uniform thickness of 3.5 micron was sandwiched between the glass plate pair to obtain a cell. The pure and both doped liquid crystal samples at their isotropic temperatures were introduced by capillary action in the self-designed liquid crystal cells. Adv. Mater. Lett. 2016, 7(2), 104-110
Results and discussion Optical microscopy Optical microscopy measurements were performed to investigate the transition temperature and different phases present in pure as well as both TiO2 doped samples of W206E FLC. Fig. 1 shows the different optical micrographs observed for pure W206E. It is clear from Fig.1 (a), that the isotropic temperature of pure W206E sample is around 98 0C. The cholesteric droplets separating out from the isotropic melt along with the oily streaks texture shown in Fig. 1(b) confirms the presence of chiral nematic (N*) at 97 0C. The growth of focal conic textures in Fig. 1(c) shows the existence of Smectic A (SmA) phase at 92 0C. The fan shaped structure and break up of focal conic structure at transition temperature shown in Fig. 1(d), confirms the presence of Smectic C (SmC*) at 86 0C [21]. Fig. 2 shows the optical micrographs for W206E + 0.5wt % TiO2 sample. It has been observed that the isotropic temperature as shown in Fig. 2(a), of this doped sample slightly increases to 99~1000C as compared to the pure W206E sample for which the isotropic temperature was 98 0C. The oily streaks present in Fig. 2(b), confirms the presence of N* phase at 98 0C. The appearance of focal conic texture shown in Fig. 2(c) at 94 0C corresponds to the SmA phase while Fig. 2(d) corresponds to the SmC* phase at 87 0C [21]. Fig. 3 represents the optical micrographs for W206E + 1.0 wt % TiO2 sample. The isotropic temperature for this doped sample is also around 100 0C. The Copyright © 2016 VBRI Press
Kumar, Kishore and Sinha cholesteric droplets present in Fig. 3(b) shows the presence of N* phase at 98 0C. The typical fan shaped structure shown in Fig. 3(c), confirms the presence of SmA phase while in Fig. 3(d), the focal conic texture with slight striation along fans represents the SmC* phase [21].
Fig. 2. Optical micrographs of W206E + 0.5wt %TiO2 sample.
increase in transition temperature was 9 0C, which was attributed to the influence of the ferroelectric nanoparticles on the orientational coupling in LC [24]. The effect of doping of carbon nanotubes on the phase transition of nematic liquid crystal was studied by Duran et al. [25]. They have reported a positive shift in the isotropic temperature of doped nematic liquid crystal and attributed this as anisotropic alignment of liquid crystal molecules along the carbon nanotubes bundles. In this present study we have also found a slight increase of 1~ 2 0C in the transition temperature as well as the temperatures corresponding to the different phases present in both the doped samples. To ensure that there is no solvent left in the liquid crystal nanocomposites, we have evaporated the ferroelectric nanocomposites at a temperature higher than the boiling point of chloroform repeatedly. We have also repeated the optical polarizing microscopy measurements several times and found a slight increase in transition temperature as well as in the temperature corresponding to the different phases present in both the doped samples. This may be attributed to the strong interaction between W206E molecules and the nonuniformly distributed TiO2 nanoparticles which result in anisotropic alignment of W206E molecules induced by TiO2 nanoparticles which improves the local interactions and orientational order in W206E molecules. This results in the increased isotropic temperature as well as the temperature corresponding to different phases present in both the liquid crystal nanocomposites.
Fig. 3. Optical micrographs of W206E + 1.0 wt% TiO2 sample at different temperatures.
The optical microscopy measurements confirms a slight increase of 1~2 0C in the transition temperature of both the doped samples. The increase in isotropic temperature of liquid crystal nanocomposites was also reported earlier by various research groups. Lee et al. [22], reported a small increase in isotropic temperature of a nematic liquid crystal when it was doped with silica nanoparticles and explained qualitatively this was because of the orienting influence of the non -uniformly distributed silica nanoparticles in the nematic liquid crystal and such orienting influence stabilizes and enhances the local orientational order of liquid crystal and hence results in the increase in transition temperature. Li et al. [23] reported the increase of isotropic temperature of the order of 38.9 0C, when the nematic liquid crystal was doped with BaTiO3. But later on, they modified and reported that this increase in transition temperature of 38.9 0C was due to the presence of heptane in the liquid crystal nanocolloid. However, the actual
Adv. Mater. Lett. 2016, 7(2), 104-110
Fig. 4. Oscillogram images for a) Pure W206E, b) W206E + 0.5wt%TiO2 and c) W206E + 1.0wt%TiO2.
Spontaneous polarization The spontaneous polarization Ps is the main characteristic of FLCs and it is one of the important physical parameters in FLC to investigate the transition from the lower SmC* phase to the high temperature SmA phase at a particular transition temperature Tc, where Ps disappears with increasing temperature. The value of spontaneous polarization strongly depends on the cell thickness, frequency and the concentration of ionic charges [26, 27]. The spontaneous polarization was calculated by using the following relation;
Copyright © 2016 VBRI Press
106
Research Article
Adv. Mater. Lett. 2016, 7(2), 104-110 (1)
where, Rs is the resistance connected in series with the sample, A is the area of the square pattern created on the cell and ∆V is the excess voltage because of the polarization reversal. The oscillogram images for pure and doped samples corresponding to the maximum value of spontaneous polarization are shown in Fig. 4.
Fig. 5. (a) Conductance vs. Frequency for Pure W206E and both TiO 2 doped samples, (b)Variation of spontaneous polarization with temperature for Pure and doped samples.
The maximum value of Ps for pure W206E FLC at 30 0C is 13.00 nC/cm2, while it is 12.20 nC/cm2 for W206E + 0.5 wt % TiO2 and 8.73 nC/cm2 for W206E + 1.0 wt % TiO2 at 35 0C. A similar type of decrement in the value of Ps with increased concentration of LiNbO3 in FLC was reported by Shukla et al. [28] and explained the decrease in the value of Ps by two different mechanisms. First, the distortion of polarization vector by the dopant LiNbO3 nanoparticles and also the antiparallel correlation between LiNbO3 nanoparticles and FLC molecules reduces the value of Ps. Secondly, the captured ions screen the net dipole moment contribution and hence reduction in the value of Ps of the nanocomposites is observed. Chaudhary et al. [29] have doped ZnO nanoparticles in FLC W206E in different proportions and found that there is an increase in Ps value upto 0.3 wt % of ZnO nanoparticles doped samples and reported this is due to the Adv. Mater. Lett. 2016, 7(2), 104-110
Advanced Materials Letters
dipole - dipole interactions between ZnO nanoparticles and FLC molecules. The ZnO nanoparticles add up the dipole moment into the FLC material and hence there is a corresponding increase in Ps value. Unlike Shukla et al. [28] results for Ps value, Gupta et al. [20] recently reported a small increase in Ps value, when they doped FLC with only one concentration of 1.0 wt % TiO2 nanoparticles and explained, TiO2 nanoparticles are suppressing the screening effect by trapping free ion charges and because of this the polarization component of FLC molecules align more preferably along the field direction which cause increment in the value of Ps. In our case, we have found a decrease in the value of Ps when W206E sample was doped with insulating TiO2 nanoparticles in different proportions. This decrease in Ps of both the doped samples as compared to pure W206E may be explained on the basis of trapping of free ions phenomenon as reported earlier by Shukla et al. [28]. The TiO2 nanoparticles capture the free charge ions present in pure W206E. These captured ions enhance the local electric filed in doped samples as compared to the local electric field present within pure W206E sample. Further, these trapped free charge ions also reduce the value of Ps of doped samples by shielding the net dipole moment effect and hence reduction in Ps value of both the doped samples has been observed [28]. With increase in concentration of TiO2, the concentration of free charge ions is lesser and trapping of free charge ions is more which may further reduce the value of Ps to 8.73 nC/cm2 in case of 1.0 wt % TiO2 doped sample. The suppression of free ion charges can be explained on the basis of decrease in the conductivity of doped samples. To substantiate this, conductance measurements have been carried out. The conductance for pure W206E and both the doped samples is shown in Fig. 5(a). It is clear from the graph that with increase in concentration of dopant TiO2, the value of conductance decreases due to the free ionic charge trapping phenomenon and hence conductivity decreases for both the doped samples as compared to the pure FLC. The contribution of free charge ions is maximum at lower frequencies. These TiO2 particles trap the free ion charges present in pure W206E and consequently their movements towards liquid crystal cell walls result in the decrease in conductivity of both the doped samples. The variation of Ps with temperature for all the three samples is shown in Fig. 5(b). It is clear that, with increase in temperature, the Ps is going down. The experimental data are fitted according to the following equation; (2) where, Tc is the transition temperature, Po and β are the fitting parameters, from the mean field theory the value of β is 0.50. The value of β obtained from equation (2) for pure W206E sample, W206E + 0.5 wt % TiO2 and W206E + 1.0 wt % TiO2 are 0.54, 0.52 and 0.51 respectively, which are greater than 0.50, indicates a second order transition corresponding to ferroelectric to paraelectric in all three samples [30]. The second order phase transition is corresponding to a symmetry breaking phenomenon. At Tc, the lowest- symmetry phase i.e. ferroelectric phase (SmC*) becomes high-symmetry paraelectric phase which Copyright © 2016 VBRI Press
Kumar, Kishore and Sinha causes the value of Ps to go to zero at Tc. The value of Ps decreases with the increase in temperature and at Tc, it becomes zero. The fitting parameters Po and β are given in Table 1. Table 1. The fitting parameters Po and β.
System Pure W206E W206E + 0.5wt% TiO2 W206E + 1.0wt% TiO2
P0 (nC/cm2) 1.50 1.46 1.18
β 0.54 0.52 0.51
Fig. 7. Effect of DC bias on Gold stone mode of (a) pure W206E, (b) pure w206E+0.5wt % TiO2 and (c) pure w206E+1.0wt % TiO2.
Fig. 6. ε’ and ε” vs. log f for a) pure W206E, b) W206E + 0.5 wt% TiO2 and c) W206E + 1.0 wt% TiO2 in SmC* phase.
Dielectric spectroscopy Dielectric spectroscopy is directly related to the macroscopic polarization of the material. There are various polarization mechanisms or relaxation processes. Apart from these relaxation processes, the two low frequency collective modes, the Goldstone mode because of fluctuations in the azimuthal angle φ and the soft mode due to the change in the tilt angle Ɵ may be present. Therefore, to study the different molecular and collective modes present, the dielectric measurements were carried out in pure and both doped samples in the frequency range of 20Hz to 2MHz. Fig. 6, shows the variation of ε’ and ε’’ with frequency for pure as well as both doped samples at 30 0C, at which the sample is in SmC* phase. The dielectric loss i.e. the peak appearing in ε” as shown in Fig. 6(a-c), appears at frequency 178 Hz, 212 Hz and 238 Hz for pure W206E, W206E + 0.5 wt% TiO2 and W206E + 1.0 wt% TiO2 doped samples respectively corresponds to the Goldstone mode present in these samples. The Goldstone mode can be further confirmed by the application of DC field [31]. With the application of DC bias the peak will be suppressed because of the unwinding of helix in SmC* phase. The suppression of dielectric loss peak with increasing DC bias from 0V to 5V as shown in Fig. 7 confirms the presence of Goldstone mode in SmC* phase in all the three samples.
Adv. Mater. Lett. 2016, 7(2), 104-110
The effect of the doping concentration of TiO2 on the dielectric properties of pure sample with the variation in frequency has been studied. It is clear from Fig. 6 that, with increasing doping concentration the value of dielectric permittivity ε’ is decreased. Fig. 6(a-c), clearly show that initially the value of ε’ for pure and both doped samples decreases with the increasing value of frequency and further at higher frequencies it remains almost constant and is independent of the increase in frequency. The dielectric permittivity of pure W206E is high in lower frequency region, however the dielectric permittivity observed for TiO2 doped W206E samples is low. In lower frequency region (