ABSTRACT An experiment was conducted to study the effects of different eggshell temperature (EST) profiles during incubation on embryo mortality, hatchability ...
PHYSIOLOGY, ENDOCRINOLOGY, AND REPRODUCTION Effect of Eggshell Temperature During Incubation on Embryo Development, Hatchability, and Posthatch Development A. Lourens,*,1 H. van den Brand,† R. Meijerhof,‡ and B. Kemp† *Applied Research of the Animal Sciences Group of Wageningen University and Research Centre, PO Box 65, 8200 AB Lelystad, The Netherlands; †Wageningen Institute of Animal Sciences, Adaptation Physiology Group, Wageningen University, PO Box 338, 6700 AA Wageningen, The Netherlands; and ‡HYBRO BV, Veerstraat 38, PO Box 30, 5830 AA, Boxmeer, The Netherlands instead of 37.8°C) reduced DT only in batch 2. Embryo development was most retarded in eggs incubated at 36.7°C EST compared with at 37.8°C during the first week of incubation. However, highest hatchability and embryo development were always found when EST was maintained at 37.8°C constantly throughout incubation. Chicks that hatched from eggs incubated at low EST during wk 1 of incubation had lower rectal temperature after hatching, especially under low housing temperatures, and this effect lasted until 7 d posthatch in batch 1. The highest rectal temperatures were always found in chicks incubated at 37.8°C EST constantly throughout incubation. Eggs and chicks from different batches require different environmental conditions for optimal embryo development, hatchability, and posthatch growth. Rearing temperature and incubation conditions affect the ability of young chicks to maintain their rectal temperature during the first week posthatch.
ABSTRACT An experiment was conducted to study the effects of different eggshell temperature (EST) profiles during incubation on embryo mortality, hatchability, and embryo development. Furthermore, chicks from different EST profiles were reared under low and high housing temperatures to investigate subsequent posthatch growth and rectal temperature. Two batches of eggs were used in this experiment. Hatching eggs were subjected to 36.7 or 37.8°C EST during the first week, to 37.8°C EST during the second week, and to 37.8 or 38.9°C EST during the third week of incubation. Posthatch housing temperature decreased from 35°C at d 1 to 30°C at d 7 (high) or decreased from 30°C at d 1 to 25°C at d 7 (low). The difference between machine temperature and EST (DT) was used to illustrate the effect of EST on heat production during incubation. DT differed per batch, and was smallest when eggs were incubated at 36.7°C instead of 37.8°C during wk 1. High EST during wk 3 of incubation (38.9°C
(Key words: eggshell temperature, embryo development, hatchability, posthatch performance, rectal temperature) 2005 Poultry Science 84:914–920
perature. However, measurement of embryo temperature requires destructive methods that influence embryo development and hatchability. Use of eggshell temperatures (EST) as a reflection of embryo temperature can solve this problem. Lourens (2001) found an average EST of 37.8°C in commercial single-stage incubators. However, a fluctuation of 5°C in EST was observed, depending on stage of development and position of the egg in the machine (Lourens, 2001). Especially in multistage machines, relatively low and high EST at the start and end of incubation, respectively, can be expected as a result of the imbalance between embryonic heat production and heat transfer (Meijerhof, 2002). Because the influence of varying EST on embryo development and hatchability is not known, a trial was conducted to evaluate the effect of low EST (36.7°C) during
INTRODUCTION Temperature is a very important factor affecting embryo development (Romanoff, 1972), hatchability (Deeming and Ferguson, 1991; Wilson, 1991), and posthatch performance (Lundy, 1969; Wilson, 1991). In incubation trials, air temperature is often used as treatment applied to the eggs (French, 1997). It could be questioned whether internal egg temperature (embryo temperature) would be more relevant than air temperature, because air temperature is not simply equal to embryo temperature and can vary independently (Meijerhof and van Beek, 1993). It can be assumed that embryo development and hatchability are more influenced by embryo temperature than by air tem-
2005 Poultry Science Association, Inc. Received for publication December 7, 2004. Accepted for publication February 13, 2005. 1 To whom correspondence should be addressed: sander.lourens @wur.nl.
Abbreviation Key: DT = difference between machine temperature and eggshell temperature (MT – EST); EST = eggshell temperature; HT = housing temperature; MT = machine temperature; RT = rectal temperature; YFBW = yolk-free body weight.
914
EGGSHELL TEMPERATURE PROFILES DURING INCUBATION
the first week and high EST (38.9°C) during the third week of incubation on embryo development, hatchability, and posthatch performance. Eggs in the control group were incubated at a constant EST of 37.8°C. Because parent stock age is an important factor in embryo development and hatchability (Gladys et al., 2000), the trial was performed twice with eggs of parent stock of different ages. Beside effects of eggshell temperature on embryo development and hatchability, posthatch performance was also determined in chicks housed at different temperatures (HT).
915
other egg place remained empty, and every other (empty) incubator tray was removed. All eggs originated from the same breed (Hybro G) but from different parent stock farms, and eggs were stored for a maximum of 1 wk. A total of 1,072 eggs per batch were incubated to determine embryonic mortality and hatchability (268 eggs per treatment per batch; equally divided across 4 incubator trays). Additionally, 360 extra eggs per batch were incubated (90 per treatment per batch; equally divided across 2 extra incubator trays) and opened at different stages to determine embryonic development.
MATERIALS AND METHODS Embryonic Mortality and Hatchability Experimental Setup The experiment was set up to examine the effect of low EST in the first week of incubation and the effect of high EST during the last week of incubation on embryonic mortality, hatchability, and embryo development in different batches of eggs. During wk 1 of incubation, the EST was set at 36.7 or 37.8°C, and during wk 3 EST was set at 37.8 or 38.9°C. The EST during wk 2 was set at 37.8°C for all treatments, resulting in 4 different EST treatments. Eggs were used from a young parent stock of 28 wk of age (batch 1) and from an old parent stock of 60 wk of age (batch 2). The 2 different batches were incubated in 2 subsequent periods.
Incubation Four identical digital Petersime 84 incubators2 with a maximum capacity of 8,400 eggs were used. During the first 2 wk of incubation, only 2 incubators were used. At d 14 of incubation, eggs were split per treatment across 4 incubators. At d 18 of incubation eggs were transferred to hatching baskets, and hatching baskets were put back into the same incubator. Each incubator represented one treatment. Eggs were divided across 16 incubator trays before incubation. The 16 incubator trays were randomly split across 4 different EST treatments. On one egg in the center of each incubator tray, a thermistor was attached with heat conducting paste (Schaffner)3 and covered with regular cello tape (Tesa).4 As a result, EST was measured at 4 eggs per treatment. On d 7, 14, and 18 of incubation these eggs were confirmed to contain living embryos. EST were read daily outside the incubators, and, accordingly, machine temperature (MT) was adjusted to achieve or maintain the desired EST in each treatment. In all EST treatments, relative humidity was maintained at a constant 55% throughout incubation. To ensure sufficient and uniform air speed across all eggs and to avoid interaction between incubator trays and eggs, only 67 eggs instead of 150 were placed on each incubator tray, every
At d 7 of incubation, all eggs were candled, and infertile eggs and eggs with dead embryos were removed and counted per incubator tray. All clear eggs were opened and evaluated visually to determine true fertility as a percentage of eggs set and to determine early embryonic mortality as percentage of fertile eggs. At d 18 of incubation, eggs were transferred to hatching baskets. Each hatching basket referred to an incubator tray. On the day of hatch, first and second grade chicks were counted per hatching basket. Second grade chicks were all chicks that were not able to stand straight up or chicks that showed visible signs of suboptimal incubation conditions, such as red hocks or rough navels. Eggs that failed to hatch were counted, opened, and visually evaluated to determine the stage of embryonic mortality. As a result, embryonic mortality could be categorized as early dead (wk 1), mid dead (wk 2), or late dead (wk 3).
Embryonic Development A total of 360 eggs per batch were incubated and subjected to analyses for embryo or chick weight, chick length, heart weight, and residual yolk weight. On d 7, 14, and 18, a total of 30 eggs per treatment were removed from the incubator to measure yolk-free embryo weight and embryo length. On the day of hatch (at d 21.5), 30 chicks per treatment were killed to determine chick length, yolkfree chick weight, and residual yolk.
Posthatch Development Per batch, a total of 400 chicks (100 chicks per treatment) were wing tagged and placed in grow-out facilities under 2 different HT regimens. HT was decreased from 35°C at placement to 30°C at d 7 (warm) and from 30°C at placement to 25°C at d 7 (cold). Feed and water was provided ad libitum, and chicks were reared under continuous light. At placement and at 7 d posthatch, the rectal temperature (RT), chick length, and weight were recorded from 15 chicks per treatment per batch.
Statistical Analyses 2
Petersime NV, Belgium. Schaffner Holding AG, Switzerland. Tesa SA-NV, Brussels, Belgium.
3 4
The 2 different batches of eggs were incubated in 2 succeeding experiments that were set up as a 2 × 2 × 2 factorial
916
LOURENS ET AL.
design with 2 EST settings in the first week of incubation, 2 EST settings in the last week of incubation, and 2 HT regimens during the first week posthatch. Fertility, embryo mortality, and hatchability of second and first grade chicks were analyzed using a generalized linear mixed model (GLMM) procedure for a binomial distribution with a logit link function (Genstat 6.1, 2002). Back transformed means were used for further discussion. Embryo mortality and hatchability were analyzed as percentage of the fertile eggs with incubator tray as the experimental unit. The significance of differences between means was determined with the PDIFF option of the LSMEANS statement of Genstat software. Embryo development was analyzed by threeway ANOVA with the general linear models procedure of Genstat software, and egg was the experimental unit. The model was as follows: Yijkl = µ + Bi + W1j + W3k + HTl + interactions + εijkl, where Yijkl is embryo mortality in wk 1, 2, or 3 of incubation, hatchability of dead, second and first grade chicks, or embryo development (yolk-free embryo weight, embryo length, and residual yolk), or posthatch development (chick weight, chick length and RT). In this model, µ is the overall mean, Bi is batch (I = 1, 2), W1j is EST during wk 1 (j = 36.7, 37.8°C), W3k is EST during wk 3 (k = 37.8, 38.9°C), HTl is house temperature (l = warm, cold), and εijkl is the residual error term. In all analyses, nonsignificant interactions were deleted from the model.
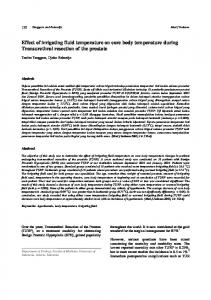
RESULTS Eggshell Temperature and Machine Temperature To obtain the different EST profiles, different MT profiles were needed. EST values did not fluctuate more than 0.2°C from the mean EST set point. The difference between MT and EST (DT) is shown in Figure 1. Eggs from the different batches needed to be incubated at different MT to control EST. EST during wk 1 had a profound effect on DT, especially in batch 2 where MT for eggs incubated at 37.8°C EST had to be decreased at an earlier stage (3 to 4 d) and to lower values thereafter compared with eggs incubated at 36.7°C during wk 1. In batch 1, this effect was less profound, and MT needed to be decreased substantially only after d 7. In batch 2, high EST during wk 3 decreased DT by 0.2°C at d 16, whereas at EST of 37.8°C, DT remained constant at around –1.0°C. This effect was observed in eggs incubated at 36.7 and 37.8°C during wk 1 (Figure 1). In batch 1, EST in wk 3 did not affect DT.
Embryonic Mortality and Hatchability Eggshell temperature during the first wk of incubation had no significant effect on embryonic mortality and hatchability. In batches 1 and 2, high EST during wk 3 increased late embryonic mortality, and, as a result, decreased hatchability of first grade chicks (Table 1). A significant interaction was observed between EST during wk 1 and EST during wk 3. The lowest wk 3 embryonic mortality and
FIGURE 1. Difference (DT) between machine temperature (MT) and eggshell temperature (EST) in batch 1 (upper panel) and batch 2 (lower panel). From d 1 to 14, EST is indicated by the straight line with open triangles or by a dotted line with open circles. From d 14 to 18, EST is indicated by open triangles, open circles, closed triangles, or closed circles. Error bars represent SEM.
highest hatchability of first grade chicks was found when eggs were incubated at a constant EST of 37.8°C. In batch 2, also the percentage of second grade chicks was lowest at a constant EST of 37.8°C. In both batches, any deviation from 37.8°C EST resulted in decreased hatchability of first grade chicks.
Embryo Development The EST during the first week of incubation significantly influenced embryo development (Table 2). In both batches, embryo length and yolk-free body weight (YFBW) was reduced on d 7, 14, 18 and 21.5 in embryos that were incubated at low EST during the first wk of incubation. High EST during the third wk of incubation had similar effects and reduced embryo length on d 18 and 21.5 in both batches. An interaction was observed between EST during wk 1 and EST during wk 3 with regard to embryo length on d 18. The largest embryos at day 18 were found in eggs incubated at 37.8°C constantly through incubation. The effect of low EST during wk 1 on embryo length at d 18 of incubation was larger than the effect of EST during wk
917
EGGSHELL TEMPERATURE PROFILES DURING INCUBATION TABLE 1. Embryo mortality and hatchability of 2 different batches incubated at 36.7 or 37.8°C eggshell temperature (EST) during wk 1, at 37.8°C EST during wk 2, and at 37.8 or 38.9°C EST during wk 3 Embryo mortality
Batch 1 EST wk 1 36.7°C 37.8°C EST wk 3 37.8°C 38.9°C EST wk 1 × 3 36.7 × 37.8 °C 36.7 × 38.9°C 37.8 × 37.8°C 37.8 × 38.9°C Batch 2 EST wk 1 36.7°C 37.8°C EST wk 3 37.8°C 38.9°C EST wk 1 × 3 36.7 × 37.8°C 36.7 × 38.9°C 37.8 × 37.8°C 37.8 × 38.9°C Pooled SEM Source of variation Batch Wk 1 Wk 3 Wk 1 × wk 3 Batch × wk 1 Batch × wk 3 Batch × wk 1 × wk 3
Hatchability
Week 1
Week 2
Week 3
2nd grade
1st grade
4.8 5.1
0.6 1.1
7.8 6.3
0.0 0.0
86.7 87.5
5.1 4.8
1.3 0.4
5.5 8.6
0.0 0.0
88.1 86.2
4.9 4.7 5.3 4.9
0.8 0.4 1.8 0.4
7.9a 7.7a 3.1b 9.4a
0.0 0.0 0.0 0.0
86.4b 87.1b 89.8a 85.2b
11.0 8.9
1.1 3.4
14.2 11.8
3.3a 1.0b
70.4 74.8
9.6 10.4
1.4 3.2
11.2 14.9
1.9 2.4
76.0 69.2
10.2 11.8 8.9 8.9 1.7
0.0 2.3 2.8 4.1 1.5
13.7a 14.7a 8.6b 15.0a 1.4
3.8a 2.8a 0.0b 2.0a 0.5
72.2b 68.5b 79.7a 69.9b 1.6
*** NS NS NS NS NS NS
* NS NS NS NS NS NS
*** NS * * NS NS NS
NS NS NS NS * NS *
*** NS * * NS NS NS
P
Means within a column and batch with no common superscript differ significantly (P < 0.05). ***P < 0.001; *P < 0.05.
a,b
3, which can be explained by the differences in exposure time and recovery time. Comparable effects and interactions were observed for YFBW. Highest YFBW was observed in embryos incubated at a constant EST of 37.8°C, and deviations from 37.8°C in the first or third wk of incubation result in decreased embryo development. On d 21.5 of incubation, the interactions between EST during wk 1 and 3 for YFBW and embryo length disappeared, and only the main effects of EST during wk 1 and EST during wk 3 remained (Table 2). The amount of RY differed between batches (3.1 and 5.2 g, respectively, in batches 1 and 2) but did not differ between EST treatments.
Posthatch Development In batch 1 under warm HT average chick weight a d 7 posthatch was 142.4 g, and under cold HT average chick weight was 136.6 g; chick lengths at d 7 post hatch were 26.1 for both HT treatments. Chicks in batch 1 responded differently with regard to EST treatment and HT. Chicks reared under warm HT reached highest first week body weight only when incubated at a constant 37.8°C EST (Table 3). Chicks reared under cold HT had lower first week body weights, and no effects of EST profiles could be ob-
served. There were no significant effects of rearing conditions or EST profiles on chick length in batch 1 (Table 3). In batch 2, and under warm HT compared to under cold HT, average chick weights at d 7 posthatch were 168.9 and 154.4 g, respectively, and chick lengths at d 7 posthatch were 27.1 and 26.6 cm, respectively. HT not only affected posthatch development in batch 2 but also interacted with EST during incubation. Under warm HT, first week body weight was reduced in chicks that hatched from eggs incubated at low EST (164.2 g) compared with chicks incubated at 37.8°C during the first week of incubation (173.5 g; see Table 3). Under cold HT, first week body weight was highest in chicks that hatched from eggs incubated at a constant 37.8°C (158.4 g). Those chicks differed significantly from chicks incubated at 36.7°C during the first week of incubation and at 37.8°C (152.4 g) or 38.9°C (152.6 g) during the third week of incubation. The chicks incubated at a constant 37.8°C did not differ from chicks incubated at 37.8°C during the first week of incubation and 38.9°C during the third week of incubation (154.2 g).
Posthatch RT At d 1 posthatch and under warm HT in batch 1, RT (40.2°C) was highest in chicks that hatched from eggs incu-
918
LOURENS ET AL. TABLE 2. Embryo development in 2 different batches of eggs incubated at 36.7 or 37.8°C eggshell temperature (EST) during wk 1, at 37.8°C EST during wk 2, and at 37.8 or 38.9°C EST during wk 3 of incubation Embryo length (cm) Day of incubation Batch 1 EST wk 1 36.7°C 37.8°C EST wk 3 37.8°C 38.9°C EST wk 1 × 3 36.7 × 37.8°C 36.7 × 38.9°C 37.8 × 37.8°C 37.8 × 38.9°C Batch 2 EST wk 1 36.7°C 37.8°C EST wk 3 37.8°C 38.9°C EST wk 1 × 3 36.7 × 37.8°C 36.7 × 38.9°C 37.8 × 37.8°C 37.8 × 38.9°C Pooled SEM Source of variation Batch Wk 1 Wk 3 Wk1 × wk 3 Batch × wk 1 Batch × wk 3 Batch × wk1 × wk 3
7
14
1.6b 1.7a
Yolk free embryo weight (g)
18
21.5
7
14
11.4b 11.9a
16.9 17.6
17.9b 18.8a
0.6b 0.8a
– –
– –
17.5 17.0
18.5a 18.2b
– – – –
– – – –
17.0b 16.8b 17.9a 17.3ab
1.8b 2.0a
10.8b 11.4a
– –
– –
– – – – 0.0 *** *** – – NS – –
Residual yolk (g)
18
21,5
21.5
12.5b 13.6a
29.0 30.4
31.2b 34.6a
2.9 3.2
– –
– –
30.9 28.5
33.1a 32.7b
3.1 3.1
18.2 17.7 18.8 18.7
– – – –
– – – –
30.4ab 27.6b 31.4a 29.4ab
31.8 30.6 34.4 34.9
3.1 2.8 3.1 3.4
16.7 17.0
19.9b 20.3a
0.7b 0.9a
12.4b 13.4a
33.7 34.9
42.4b 42.9a
5.6 4.7
17.0 16.7
20.2a 19.9b
– –
– –
34.2 34.5
42.8a 42.5b
5.2 5.1
– – – – 0.1
16.6b 16.8b 17.2a 16.8ab 0.3
19.9 19.8 20.3 20.1 0.3
– – – 0.0
33.1b 34.3b 35.1a 34.7ab 0.7
42.6 41.9 43.1 42.8 0.9
5.5 5.8 4.8 4.7 0.8
*** *** – – NS – –
*** ** * ** NS NS NS
*** *** *** NS NS NS NS
NS *** – – NS – –
– – – – 0.2 P NS *** – – NS – –
*** *** * ** NS NS *
*** *** * NS NS NS NS
*** NS NS NS NS NS NS
Means within a column and batch with no common superscript differ significantly (P < 0.05). ***P < 0.001; **P < 0.01; *P < 0.05.
a,b
bated at a constant 37.8°C. RT was significantly lower in chicks that hatched from eggs incubated at 36.7°C during the first week of incubation and at 37.8 or 38.9°C during the third week of incubation (38.8 and 39.2°C, respectively). The high EST during the third week of incubation increased RT to 39.9°C in chicks that hatched from eggs incubated at 37.8°C during the first week of incubation and did not significantly differ from RT in chicks that hatched from eggs incubated at a constant EST of 37.8°C. At d 1 posthatch and under cold HT in batch 1, RT (38.3°C) was lowest in chicks that hatched from eggs incubated at 36.7°C during the first week and at 37.8°C during the third week of incubation and differed significantly compared with the other EST regimens during incubation. At d 1 posthatch and under warm HT in batch 2, there were no significant differences in RT between chicks that hatched from egg incubated at the different EST profiles. At d 1 and under cold HT in batch 2, however, chicks had lowest the RT (38.8°C) when incubated at 36.7°C during the first week and at 37.8°C during the third week of incubation and differed significantly from RT in chicks incubated at 37.8°C during the first week of incubation and at 37.8 or 38.9°C during the third week of incubation (both 39.7°C; Table 3).
At d 7 posthatch, under warm housing conditions, and in batches 1 and 2, no effects of EST profile on RT were observed (Table 3). At d 7 posthatch and under cold HT in batch 1, however, RT (39.9°C) of chicks that hatched from eggs incubated at 36.7°C during the first week and at 37.8°C during the third week of incubation was significantly lower (39.3°C) compared with chicks that hatched from eggs incubated at 37.8°C constantly. High EST during the third week of incubation increased RT in chicks incubated at 36.7 or 37.8°C during the first week of incubation (39.6 and 39.5°C, respectively; see Table 3). At d 7 posthatch and under cold housing conditions in batch 2, no effects of EST profile on RT were observed.
DISCUSSION The EST is influenced by heat production and heat transfer (Meijerhof and van Beek, 1993), in which MT is one of the factors influencing heat transfer. The goal of this experiment was to study the effect of EST, by using the MT as a method to control EST. The results show that eggs that were subjected to lower EST during the first week of incubation required a higher MT (lower DT) in the second and third weeks. This result
919
EGGSHELL TEMPERATURE PROFILES DURING INCUBATION TABLE 3. Development of chicks at 7 d posthatch from 2 different batches of eggs, incubated at 36.7 or 37.8°C eggshell temperature (EST) during wk 1 and at 37.8 or 38.9°C EST during wk 3 of incubation1 Rectal temperature (°C)
Batch 1 EST wk 1 36.7°C 37.8°C EST wk 3 37.8°C 38.9°C EST wk 1× 3 36.7 × 37.8°C 36.7 × 38.9°C 37.8 × 37.8°C 37.8 × 38.9°C Batch 2 EST wk 1 36.7°C 37.8°C EST wk 3 37.8°C 38.9°C EST wk 1 × 3 36.7 × 37.8°C 36.7 × 38.9°C 37.8 × 37.8°C 37.8 × 38.9°C Pooled SEM Source of variation1 Batch Wk 1 Wk 3 Wk1 × wk 3 Batch × wk 1 Batch × wk 3 Batch × wk 1 × wk 3
Chick weight (g)
Chick length (cm)
Warm
Warm
Cold
Warm
Cold
Cold
d1
d7 Warm
Cold
140.4 144.4
135.3 137.9
26.0 26.1
25.9 26.3
39.0 40.0
38.5 39.0
40.1 40.3
39.4 39.7
144.7 140.1
138.3 134.9
26.0 26.1
26.3 25.9
39.5 39.5
38.7 38.8
40.1 40.3
39.6 39.6
140.8b 140.0b 148.6a 140.3b
136.7 134.0 139.9 135.9
25.9 26.2 26.2 26.0
26.0 25.7 26.5 26.1
38.8b 39.2b 40.2a 39.9ab
38.3b 38.8a 39.1a 38.9a
40.0 40.2 40.2 40.3
39.3b 39.6ab 39.9a 39.5ab
164.2b 173.5a
152.5 156.3
27.1 27.1
26.4 26.8
40.1 40.3
39.1 39.7
40.0 40.5
40.0 40.1
167.6 170.3
155.4 153.4
27.2 27.0
26.7 26.6
40.2 40.2
39.3 39.5
40.4 40.1
40.0 40.1
161.9 166.5 173.2 173.8 3.8
152.4b 152.6b 158.4a 154.2ab 3.6
27.1 27.0 27.3 27.0 0.3
40.1 40.1 40.4 40.3 0.2
38.8b 39.3ab 39.7a 39.7a 0.3
40.1 39.9 40.7 40.3 0.4
40.0 39.9 40.0 40.2 0.3
*** ** ** *** NS NS *
*** NS NS NS NS NS *
*** NS NS NS NS NS NS
26.4 26.4 26.9 26.7 0.5 P *** NS NS NS NS NS NS
*** *** NS *** NS NS *
NS NS NS NS NS NS NS
*** NS NS ** NS NS *
*** *** NS *** ** NS *
Means within a column and batch with no common superscript differ significantly (P < 0.05). Chicks were reared at two different temperature regimes (warm and cold) and rectal temperatures were measured at d 1 and d 7. ***P < 0.001; **P < 0.01; *P < 0.05. a,b 1
can be explained by lower heat production in this period. Low temperatures early in incubation not only appear to have an effect on embryonic heat production but also are reported to have effects on embryoic and posthatch development (Moreng and Bryant, 1954, 1956; Geers et al., 1983; Sarpong and Reinhart, 1985). Embryonic metabolic rate and, thus, heat production changes with incubation temperature have been shown by Nichelmann et al. (1998). Early in incubation, metabolic rate increased with incubation temperature, whereas prior to pipping, metabolic rates of chicken and duck embryos decreased as the internal egg temperature exceeded 40.0°C (Janke et al., 2002). In the present study, this effect was already observed at lower internal egg temperatures, because internal egg temperature in the present study could not exceed EST by more than 0.2 to 0.3°C (Meijerhof and van Beek, 1993). In both trials, the group having a higher EST in the third week of incubation required a smaller DT. However in the second batch, MT needed to be increased relatively more at higher EST than in the first batch, indicating that different batches of eggs can respond differently.
Embryo development could be expressed in terms of embryo length and yolk-free embryo weight (Hill, 2001) and was always highest in eggs incubated at a constant EST of 37.8°C. In the present trial, effects of low EST during wk 1 and high EST during wk 3 of incubation on embryo length and yolk-free embryo weight were observed. Highest hatchability and best posthatch performance was observed when eggs were incubated at a constant EST of 37.8°C, which is in agreement with the results of Lourens and Van Middelkoop (2000). Schmalhausen (1930) hypothesized that posthatch growth and organ function will be impaired if growth rates during embryonic development deviates from optimum. Development of organs and physiological systems begin in the first week of embryonic development (Lilja and Olsson, 1987) and continue after hatch. An overview of physiological systems that start to mature during the last week of incubation and during the first week posthatch is documented by Christensen (2001). After hatching, the chick gradually transforms into a homeotherm organism that can regulate its body temperature within certain limits by
920
LOURENS ET AL.
increasing or decreasing heat production. On average, this transition period lasts about 3 to 4 d, and the duration depends mainly on the size of the chicken and the age of the breeder flock (Weyntjens et al., 1999). Chicks from young parent stock are more sensitive with regard to the control of RT in relation to HT (Weyntjens et al., 1999). The results of this experiment indicate that EST profiles during the first week of incubation influences the control of body temperature during the first week posthatch. Delayed development of thermoregulation in combination with decreased heat output may have been responsible for the lower RT, especially in chicks that were reared under cold HT. Chicks with decreased heat output as a result of low EST early in incubation may benefit from increased hatcher temperatures. Highest first week body weights and highest RT were observed in chicks that hatched from eggs incubated at a constant EST of 37.8°C, but rearing conditions appeared to play an important role as well. Under warm HT in batch 1, the best results were observed in chicks that hatched from eggs incubated at a constant EST of 37.8°C. In batch 2, however, the positive effect of a constant EST profile of 37.8°C was only observed when chicks were reared under cold HT; under warm HT, the first week EST profile was of more importance for posthatch growth. It can be concluded that different batches of eggs require different MT settings to incubate at the same EST. Furthermore, relatively small deviations in EST result in decreased HP, retarded embryo development, increased late embryonic mortality, increased percentage of second grade chicks, decreased hatchability, decreased posthatch growth, and decreased ability to maintain RT in the first week posthatch, especially under low HT. As EST can vary independent from MT, factors that influence heat transfer or heat production should be taken into account for optimizing incubation conditions. Controlling incubator conditions by controlling only MT can result in suboptimal incubation through an uncontrolled influence on EST. EST variation within incubators could, therefore, be responsible for an undesirable increase in variation of the response of embryos in incubation experiments or chicks in grow-out experiments.
ACKNOWLEDGMENTS Pingo Poultry Farming (Boxmeer, The Netherlands) kindly donated the hatching eggs. The Dutch Egg and Poultry Board and the Dutch Ministry for Agriculture, Nature and Food Quality contributed financially to this research. The assistance of the staff in the hatchery and other research facilities at “Het Spelderholt,” Beekbergen, was greatly appreciated.
REFERENCES Christensen, V. L. 2001. Development during the seven days posthatching. Pages 31–36 in Perspectives in Fertilisation and Em-
bryonic Development in Poultry. Ratite Conference Books, Lincolnshire, UK. Deeming, D. C., and M. W. J. Ferguson. 1991. Physiological effects of incubation temperature on embryonic development in reptiles and birds. Pages 147–172 in Egg Incubation. D. C. Deeming and M. J. W. Ferguson, ed. Cambridge University Press, Cambridge, UK. French, N. A. 1997. Modeling incubation temperature: the effect of incubator design, embryonic development, and egg size. Poult. Sci. 76:124–133. Geers, R., H. Michiels, G. Nackaerts, and F. Konings. 1983. Metabolism and growth of chickens before and after hatch in relation to incubation temperatures. Poult. Sci. 62:1869–1875. Genstat 6.1. 2002. Genstat Release 6.1 Reference Manual. VSN International, Wilkinson House, Oxford, UK. Gladys, G. E., D. Hill, R. Meijerhof, T. M. Saleh, and R. M. Hulet. 2000. Effect of embryo temperature and age of breeder flock on broiler post hatch performance. Poult. Sci. 79(Suppl. 1):123. (Abstr.) Hill, D. 2001. Chick length uniformity profiles as a field measurement of chick quality? Avian Poult. Biol. Rev. 12:188. Janke, O., B. Tzschentke, J. Ho¨chel and M. Nichelmann. 2002. Metabolic responses of chicken and muscovy duck embryos to incubation temperatures. Comp. Biochem. Physiol. A 131:741–750. Lilja C, and U. Olsson. 1987. Changes in embryonic development associated with long-term selection for high growth rate in Japanese quail. Growth 51:301–308. Lourens, A. 2001. The importance of air velocity in incubation. World Poultry 17(3):29–30. Lourens, A., and J. H. Van Middelkoop. 2000. Embryo temperature affects hatchability and grow-out performance of broilers. Avian Poult. Biol. Rev. 11:299–301. Lundy, H. 1969. A review of the effects of temperature, humidity, turning and gaseous environment in the incubator on the hatchability of the hen’s egg. Pages 143–176 in The Fertility and Hatchability of the Hen’s Egg. T. C. Carter and B. M. Freeman, ed. Oliver and Boyd, Edinburgh, UK. Meijerhof, R. 2002. Design and operation of commercial incubators. Pages 41–46 in Practical Aspects of Commercial Incubation. Ratite Conference Books, Lincolnshire, UK. Meijerhof, R., and G. van Beek. 1993. Mathematical modelling of temperature and moisture loss of hatching eggs. J. Theor. Biol. 165:27–41. Moreng, R. E., and R. L. Bryant. 1954. Effects of sub-freezing temperature exposure on the chicken embryo. 2. Hatchability, chick weight and survival to six weeks. Poult. Sci. 33:987–991. Moreng, R. E., and R. L. Bryant. 1956. The resistance of the chicken embryo to low temperature exposure. Poult. Sci. 35:753–755. Nichelmann, M., A. Burmeister, O. Janke, J. Ho¨chel, and B. Tzschentke. 1998. Avian embryonic thermoregulation: role of Q10 in interpretation of endothermic reactions. J. Therm. Biol. 23:369–376. Romanoff, A. L. 1960. Atmospheric changes. Pages 57–104 in Pathogenesis of the Avian Embryo: An Analysis of Causes of Malformations and Prenatal Death. Wiley Interscience, New York. Sarpong, S., and B. S. Reinhart. 1985. Broiler hatching stress and subsequent grow-out performance. Poult. Sci. 64:232–234. Schmalhausen, I. 1930. Das wachstumgesetz al geist der progressiven differenzierung. Wilhelm Roux Arch. Enwicklungsmech. Org. 123:153–178.Romanoff, A. L. 1960. Weyntjens, S., R. Meijerhof, J. Buyse and E. Decuypere. 1999. Thermoregulation in chicks originating from breeder flocks of two different ages. J. Appl. Poult. Res. 8:139–145. Wilson, H. R. 1991. Physiological requirements of the developing embryo: Temperature and turning. Pages 145–156 in Avian Incubation. S. G. Tullet, ed. Butterworth-Heinemann, London.