At ITP ETH Hoenggerberg in Zurich,. Switzerland, the CO2 was converted to graphite ...... (dhammond@usc.edu). C. Langdon, Biosphere 2 Center of Columbia ...
GLOBAL BIOGEOCHEMICAL CYCLES, VOL. 17, NO. 1, 1011, doi:10.1029/2002GB001941, 2003
Effect of elevated CO2 on the community metabolism of an experimental coral reef Chris Langdon,1 Wallace S. Broecker,2 Douglas E. Hammond,3 Edward Glenn,4 Kevin Fitzsimmons,4 Steven G. Nelson,4 Tsung-Hung Peng,5 Irka Hajdas,6 and Georges Bonani6 Received 4 June 2002; revised 8 October 2002; accepted 13 October 2002; published 22 January 2003.
[1] The effect of elevated pCO2 on the metabolism of a coral reef community dominated by macroalgae has been investigated utilizing the large 2650 m3 coral reef mesocosm at the Biosphere-2 facility near Tucson, Arizona. The carbonate chemistry of the water was manipulated to simulate present-day and a doubled CO2 future condition. Each experiment consisted of a 1–2 month preconditioning period followed by a 7–9 day observational period. The pCO2 was 404 ± 63 matm during the present-day pCO2 experiment and 658 ± 59 matm during the elevated pCO2 experiment. Nutrient levels were + 3� low and typical of natural reefs waters (NO� 3 0.5–0.9 mM, NH4 0.4 mM, PO4 0.07–0.09 mM). The temperature and salinity of the water were held constant at 26.5 ± 0.2�C and 34.4 ± 0.2 ppt. Photosynthetically available irradiance was 10 ± 2 during the present-day experiment and 7.4 ± 0.5 mol photons m�2 d�1 during the elevated pCO2 experiment. The primary producer biomass in the mesocosm was dominated by four species of macroalgae; Haptilon cubense, Amphiroa fragillisima, Gelidiopsis intricata and Chondria dasyphylla. Algal biomass was 10.4 mol C m�2 during the present-day and 8.7 mol C m�2 and during the elevated pCO2 experiments. As previously observed, the increase in pCO2 resulted in a decrease in calcification from 0.041 ± 0.007 to 0.006 ± 0.003 mol CaCO3 m�2 d�1. Net community production (NCP) and dark respiration did not change in response to elevated pCO2. Light respiration measured by a new radiocarbon isotope dilution method exceeded dark respiration by a factor of 1.2 ± 0.3 to 2.1 ± 0.4 on a daily basis and by 2.2 ± 0.6 to 3.9 ± 0.8 on an hourly basis. The 1.8-fold increase with increasing pCO2 indicates that the enhanced respiration in the light was not due to photorespiration. Gross production (GPP) computed as the sum of NCP plus daily respiration (light + dark) increased significantly (0.24 ± 0.03 vs. 0.32 ± 0.04 mol C m�2 d�1). However, the conventional calculation of GPP based on the assumption that respiration in the light proceeds at the same rate as the dark underestimated the true rate of GPP by 41–100% and completely missed the increased rate of carbon cycling due to elevated pCO2. We conclude that under natural, undisturbed, nutrient-limited conditions elevated CO2 depresses calcification, stimulates the rate of turnover of organic carbon, particularly in the light, but has no effect on net organic production. The hypothesis that an increase pCO2 would produce an increase in net production that would counterbalance the effect of decreasing saturation state on calcification is not supported by these INDEX TERMS: 0315 Atmospheric Composition and Structure: Biosphere/atmosphere interactions; data. 1615 Global Change: Biogeochemical processes (4805); 1635 Global Change: Oceans (4203); 1794 History of Geophysics: Instruments and techniques; KEYWORDS: coral reefs, photosynthesis, gross production, light respiration, calcification, elevated CO2, community metabolism Citation: Langdon, C., W. S. Broecker, D. E. Hammond, E. Glenn, K. Fitzsimmons, S. G. Nelson, T.-H. Peng, I. Hajdas, and G. Bonani, Effect of elevated CO2 on the community metabolism of an experimental coral reef, Global Biogeochem. Cycles, 17(1), 1011, doi:10.1029/2002GB001941, 2003. 1
Biosphere 2 Center of Columbia University, Oracle, Arizona, USA. Lamont-Doherty Earth Observatory of Columbia University, Palisades, New York, USA. 2
Copyright 2003 by the American Geophysical Union. 0886-6236/03/2002GB001941
3 Department of Earth Sciences, University of Southern California, Los Angeles, California, USA. 4 Environmental Research Laboratory, Department of Soil, Water and Environmental Science, University of Arizona, Tucson, Arizona, USA. 5 Ocean Chemistry Division, NOAA-AOML, Miami, Florida, USA. 6 AMS 14C Laboratory, Institute of Particle Physics, Zurich, Switzerland.
11 - 1
11 - 2
LANGDON ET AL.: EFFECT OF ELEVATED CO2 ON COMMUNITY METABOLISM
1. Introduction [2] Several recent studies have shown that an increase in the partial pressure of CO2 in the atmosphere can have a negative effect on coral and reef community calcification as a result of a decrease in the aragonite saturation state ( arag) [Gattuso et al., 1998a; Kleypas et al., 1999; Langdon et al., 2000; Leclercq et al., 2000; Marubini et al., 2001] These studies found that a doubling in CO2, such as is projected to occur in the next 50– 100 years [Houghton et al., 1996], resulted in an 11 – 40% decline in calcification of corals and coralline algae measured over time periods ranging from 3 hours to 2 years. This decrease in calcification will make corals less able to keep up with sea level rise, less able to compete with faster growing organisms for space and light, more susceptible to storm damage and bioerosion, and possibly more sensitive to other forms of stress, i.e., disease, bleaching, overfishing, pesticides, fertilizers, and sedimentation. At the community scale these changes could result in a loss of coral coverage followed by loss of framework and habitat for fish and invertebrates. [3] These studies did not consider the impact that rising CO2 might have on the rate of production of organic matter by macroalgae. Macroalgae are not conspicuous on healthy reefs, but due to various anthropogenic pressures they are becoming increasingly abundant. If the photosynthesis of macrophytic algae were carbon-limited, the increase in pCO2 might give their growth a boost and hasten the change in community structure on coral reefs. Under optimal light and nutrient conditions, laboratory studies have found that the photosynthesis of many macroalgae is limited by inorganic carbon supply in natural seawater [Borowitzka and Larkum, 1976; Borowitzka, 1981; Surif and Raven, 1989; Maberly, 1990; Levavasseur et al., 1991; Gao et al., 1993a, 1993b]. Whether the photosynthesis and growth of macrophytic algae can be increased under more natural Nand P-limited conditions needs to be addressed. A recent study utilizing the coral reef mesocosm at Monaco addressed this issue and found no significant increase in net community production in response to elevated pCO2 [Leclercq et al., 2002]. Nutrient concentrations were not reported, but according to J.-P. Gattuso (personal communication, 2002), they have been measured numerous times in the past and are low (NO3 < 1 mM, NH4 < 0.4 mM, PO4 < 0.2 mM). These results suggest that elevated CO2 does not increase net community production if nutrient concentrations are low. One proviso that must be made is that the community in the Monaco mesocosm is dominated by coral that utilize HCO� 3 and therefore might not be expected to respond to elevated CO2. [4] By examining the response of the macroalgal-dominated coral reef community growing under low nutrient conditions in the experimental coral reef mesocosm at the Biosphere 2 Center in Tucson, Arizona, to a deliberate CO2 enrichment, this study provides new and useful information for evaluation of the probable ecological impacts of doubled atmospheric CO2 on the production and cycling of organic and inorganic carbon on disturbed algal-dominated coral reefs. The approach utilized was to regulate carbonate chemistry and evaluate the flow of carbon between DIC, organic carbon, carbonate sediment, and the atmosphere
based on constructing mass balances for oxygen, DIC, alkalinity, and a 14C isotopic tracer.
2. Methods 2.1. Description of the Experimental System [5] The Biosphere 2 coral reef mesocosm is a large, selfsustaining community of living coral reef organisms. The mesocosm consists of an epoxy coated stainless steel lined tank measuring 42 m long and 19 m wide. The physical features of the mesocosm were designed to mimic a Caribbean fringing reef and lagoon. The mesocosm has a water volume of 2650 m3, water surface area of 711 m2, and 590 m2 of reef benthos. The physical layout, circulation, water chemistry, and biota are described in detail by Atkinson et al. [1999]. Water temperature is held constant year round at 26.5 ± 0.2�C and the salinity at 34.5%. A wave machine generates waves of 10– 20 cm height, and current speeds just above the benthos range from 2 to 10 cm s�1. The mixing time of the tank is �1 hour [Atkinson et al., 1999]. Photosynthetically available quantum irradiance at the water surface ranges seasonally from 8 –25 mol photons m�2 d�1. Gross primary production and dark respiration measured by the conventional oxygen mass balance method averaged 0.170 and 0.173 mol O2 m�2 d�1 over a 3-year period [Falter et al., 2001]. Net community production averaged only �0.003 mol O2 m�2 d�1. Falter et al. [2001] examined the temporal relationship between production and respiration and found that for timescales >1 month, the processes were in almost perfect balance, but that on shorter timescales the correlation between changes in production and respiration became weaker. Nutrient levels are comparable with levels found on natural coral reefs with concentrations of NO� 3 (mean 0.3 mM, max 1.7, min 0.02), NH4+ (mean 0.3 mM, max 1.9, min 0.02), PO43� < 0.09 mM, and SiO3 (mean 11.7 mM, max 34.3, min 2.9). The concentrations of the major ions, Na+, K+, Mg2+, Ca2+, Sr2+, Cl�, and SO42� are close to seawater values. [6] The biota is dominated by macrophytes. The most abundant macrophyte species are Haliptilon cubense, Gelidiopsis intricata, Amphiroa fragillissima, and Chondria dasyphylla (E. Glenn et al., manuscript in preparation, 2002). While these species comprise 95% of the total biomass of algae, the balance is made up of 30+ species. There are 25 species of coral. Porites astreoides, Favia fragum, Agaricia sp., and Pocillopora damicornis have produced new recruits. However, coral cover at 3% is low relative to natural reef environments. There are 16 species of herbivorous fish, but abundance is low. Invertebrate species diversity is fairly high, with 50+ species including sponges, sea cucumbers, decapods, brittle stars, tunicates, polychaetes, and amphipods (see Atkinson et al. [1999] for a detailed species list). On balance, the mesocosm can be considered a model for many disturbed, overfished, algaldominated coral reefs. 2.2. Analytical Methods [7] Temperature, salinity, and O2 were recorded every 15 min using a SeaBird CTD. The data from the oxygen sensor were calibrated against daily Winkler oxygen determinations. The average accuracy of the calibrated oxygen data is
LANGDON ET AL.: EFFECT OF ELEVATED CO2 ON COMMUNITY METABOLISM
estimated to be ±3 mM. Submarine photosynthetically available quantum scalar irradiance is measured every 15 min at four locations in the tank using LiCOR LI-193SA sensors. The pCO2 of the water and the overlying air was measured every 8 min using a LiCOR LI-6252 infrared gas analyzer and a shower head equilibrator system. The precision and accuracy of the pCO2 measurements is estimated to be ±1% or ±2 – 4 matm. Water samples for total dissolved inorganic carbon (DIC) and total alkalinity (TA) were collected daily at the same time. The methods for analyzing the DIC and TA of the water and computing the pH and carbonate ion concentration are given by Langdon et al. [2000]. The pH is reported on the seawater scale. Due to the very small size of the NaH14CO3 spike (i.e., 4 mCi), the radiocarbon content of the DIC was determined by accelerator mass spectrometry. Water samples were acidified and the liberated CO2 gas was purified cryogenically and sealed in glass ampoules. At ITP ETH Hoenggerberg in Zurich, Switzerland, the CO2 was converted to graphite and then its 14 C/C ratio relative to that of 1850 wood was determined by accelerator mass spectrometry. The precision based on duplicate analysis was ±0.4%. Excess 14C was computed by subtracting the 14C/C ratio of the water just before the radiocarbon addition. This background level, which was observed to be stable over the 6-month period leading up to each experiment, reflects the isotopic composition of the air during the time leading up to the experiment. [8] Benthic surveys were performed on a bimonthly basis. The bottom of the tank was divided into 96 quadrats. Into each quadrat a 0.077 m2 ring was tossed. Within the ring, all the living biomass was harvested and identified to species and the dry weight was determined. Data from the 96 rings tosses were averaged and multiplied by the factor (750/ 0.077) to get the total biomass of benthos (Org) in the tank. The biomass of the fish and larger invertebrates was not measured but is orders of magnitude smaller than the algal biomass. Samples of the dried material were combusted at 450�C to determine the conversion factor from grams dry weight to grams organic carbon. Samples of the dried material were also sent to ITH for analysis of their 14C content. The amount of biomass contributed by biota in the water column was insignificant compared to that on the bottom, i.e., 0.003 versus 8 – 10 mol C m�2. 2.3. Control of Carbonate Chemistry [9] The experimental design was to hold total alkalinity (TA) constant at 2300 mEquiv kg�1 while maintaining total dissolved inorganic carbon (DIC) concentration at either 1963 mmol kg�1 to simulate the present-day ocean or at 2100 mmol kg�1 to simulate a future ocean where atmospheric CO2 has doubled. Control of the carbonate chemistry was achieved by additions of NaHCO3, Na2CO3, and HCl. Once a week a chemical addition was made based on the observed decline in TA and DIC due to primary production, calcification, and gas exchange during the previous week. The addition was computed to raise TA and DIC above the target level sufficiently so that the weekly average TA and DIC equaled the target levels. In practice, during the presentday experiment (6 October 1999 to 21 December 2000), TA was 2261 ± 51 mEquiv kg�1 and DIC was 1962 ± 30 mmol
11 - 3
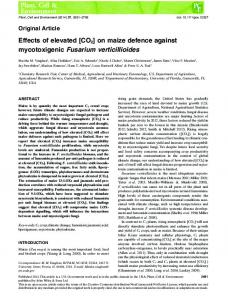
kg�1, and during the 2X future experiment (8 November 2000 to 18 December 2000), TA was 2337 ± 38 mEquiv kg�1 and DIC was 2121 ± 20 mmol kg�1. The resulting carbonate chemistries are given in Table 1. The departure of TA from the target of 2300 mEquiv kg�1 was �1.7% during the present-day treatment and +1.6% during the 2X treatment. We do not think that these small changes in TA will have a measurable effect on the physiology of the macroalgae. arag during the present-day experiment was lower than the 4.0 ± 0.2 typical of the real ocean. This was due to the [Ca2+] being 8.79 mmol kg�1. As a result this study will underestimate the effect of elevated pCO2 on calcification. However, we can compensate for this by using our data to extrapolate to the calcification rate at a arag of 4.0. 2.4. Model [10] A simple mass balance model for carbon was created to assist in the analysis of the radiocarbon data. We identify four carbon pools, dissolved inorganic carbon (DIC), the overlying air (Air), organic biomass consisting mainly of the macrophytes but also all other living organisms and any detrital carbon in the sediments (Org), and the calcium carbonate in the corals, calcareous algae, and sediments (Sed) (Figure 1). We estimate that there are 1000 moles of CO2 in the overlying atmosphere, 5120 moles of dissolved inorganic carbon in the water, 0.9 moles of dissolved organic carbon, 10,200 moles of carbon in the biota, and 1,200,000 moles of CaCO3 in the top 10 cm of the sediment covering the bottom. We recognize the following processes as being responsible for the flux of carbon between the pools: photosynthesis (GPP), respiration (R), evasion (E), invasion (I), calcification (C), dissolution (D), and chemical addition (A). The flux of radiocarbon is found by multiplying the 12C flux by the 14C/C ratio of the source pool. Each pool is assumed to be well mixed with respect to its carbon isotopes. The isotopic composition of the DIC and several components of the organic carbon pool (14C/C)Org were measured at the start of the elevated pCO2 experiment and were found to be 0.97 ± 0.07 � 10�12 and very close to the expected value of 1.0 � 10�12 in the CO2 in the overlying air. This is reasonable because (14C/C)DIC was observed to be constant for 6 months prior to the experiment and the turnover time of Org is probably on the order of 1– 3 months. No measurements were made of (14C/C)Air, but we assume that it was close to that of the outside air because the Biosphere air is exchanged daily with outside air. This was not the case during the years preceding this experiment when the Biosphere was operated as a closed system and the 14 C/C of the Biosphere air would have been significantly lower due to respiration of peat in the soils. This could explain why (14C/C)DIC was 0.55 � 10�12 prior to the first experiment. We make the assumption that (14C/C)Org was also 0.55 � 10�12 just prior to the first 14C spike. [11] The model uses the following equations based on isotopic mass balance to compute the amounts of 12C and 14 C in the DIC and Org C pools at each time step. DIC
12
� C iþ1 ¼ DIC
12
� C i þ½I þ R þ A þ D � E � GPP � C�t ð1Þ
11 - 4
LANGDON ET AL.: EFFECT OF ELEVATED CO2 ON COMMUNITY METABOLISM
Table 1. Physical and Chemical Conditions During the Experimental Periods 12 – 21 January 2000 11 – 18 December 2000 T S PAR NO3 NH4 PO4 TA TCO2 DIC Org pH pCO2,w pCO2,a HCO� 3 CO32� Ca2+
arag O2 I E
DIC
14
26.5 34.7 10.0 0.54 0.37 0.07 2261 1962 6.87 10.4 8.02 404 392 1741 214 8.79 2.83 173.8 0.019 0.020
C=C
� iþ1
14
Units �C E m�2 d�1 mmol kg�1 mmol kg�1 mmol kg�1 mEquiv kg�1 mmol kg�1 mol C m�2 mol C m�2 seawater scale matm matm mmol kg�1 mmol kg�1 mmol kg�1 mmol kg�1 mol C m�2 d�1 mol C m�2 d�1
� � � C i þ 14 C=C Air It þ 14 C=C Org Rt � � þ 14 C=C Chem At þ 14 C=C Sed Dt � � 14 C=C DIC ðE þ GPP þ CÞt
¼ DIC
Org Org
26.5 34.7 7.4 0.89 0.41 0.09 2337 2121 7.42 8.7 7.82 658 343 1973 153 9.78 2.30 176.1 0.017 0.032
12
14
� C iþ1 ¼ Org
� C iþ1 ¼ Org
14
� C iþ
14
12
� C i þ½GPP � R�t
� C=C DIC GPPt �
14
ð2Þ ð3Þ
� C=C Org Rt
where the above variables are defined as follows: [O2] measured dissolved oxygen concentration, mol O2 m�3; [O2]sat concentration of dissolved oxygen in equilibrium with the atmosphere (0.179 mol m�3); h mean depth of the water column (3.5 m); kO2 gas exchange coefficient (1.9 m d�1); PQ photosynthetic quotient (molar ratio of O2 release to CO2 uptake) assumed to be 1.05; t time decimal days. [13] The equilibrium concentration of O2 was calculated by use of the O2 solubility equation of Benson and Krause [1984] given the temperature, salinity and average barometric pressure. Equation (5) assumes that any undersaturation or oversaturation of oxygen is due to biological processes. There was some concern that the wave generator could cause undersaturation by virtue of the vacuum that is briefly applied when the column of water is being lifted. We were also concerned that bubbles visible in the water discharged by pumps could cause supersaturation. In order to ascertain if either physical process was affecting the saturation of dissolved gases, we collected samples for noble gas analysis. The concentrations of Ar, Kr, and Xe were measured by Martin Stute using a mass spectrometric method (M. Stute, personal communication, 2001). He found that Ar, Kr, and Xe were 99.9%, 100.3%, and 99.9% of saturation indicating that the wave generator and the bubbles in the pump discharge have a negligible effect on oxygen saturation. The value for PQ of 1.05 was taken from a reef study conducted by Smith and Marsh [1973]. Integrating NP(t) from sunrise to sunrise yields the amount of daily net community production (NCP) while integrating from sunset
ð4Þ
where DIC() or Org() is the amount of 12C or 14C in the inorganic or organic carbon pool in mol m�2 at time i or i + 1, t is the time step (1 day), (14C/C)x is the 14C/C in the DIC, Org, Air or Sed pools, and I, E, GPP, R, C, D, and A are the rates of invasion, evasion, gross primary production, daily respiration, calcification, dissolution, and chemical addition in units of mol C m�2 d�1. Isotopic compositions are reported as the ratio of (14C/C) in the pool of interest relative to ratio of 14C/C in 1850 wood. A quantity termed ‘‘excess 14C’’ is defined as (14C/C)/(14C/C)1850 - initial (14C/ C)/(14C/C)1850 where the initial ratio is 0.55 for the presentday experiment and 0.90 for the elevated pCO2 experiment. 2.5. Estimates of GPP, R, and NCP [12] We define NCP to be net community production integrated over a 24-hour period, named ‘‘E’’ by Kinsey [1985]. Net production (NP) is defined here as the instantaneous rate of net primary production was computed from the observed [O2] measured every 15 min and the O2 disequilibria between the mesocosm water and the B2 atmosphere according to � �� � 1 d ½O2 � h þkO2 ½O2 �ðt Þ � ½O2 �sat PQ dt
� NPðt Þ ¼
ð5Þ
Figure 1. Conceptual model of carbon pools (mol C m�2) and fluxes in the Biosphere 2 coral reef mesocosm. I, E, GPP, R, C, D, and A are the fluxes of carbon due to invasion, evasion, gross primary production, daily respiration, calcification, dissolution, and chemical addition, respectively. Only the fluxes indicated by the thick arrows affect the 14C/C of the DIC pool.
LANGDON ET AL.: EFFECT OF ELEVATED CO2 ON COMMUNITY METABOLISM
to sunrise yields the amount of nightly respiration (RD), which is defined here to be a positive number. The hourly rate of dark respiration (DR) was determined by dividing the RD by the number of hours of darkness. At the time of these experiments, there were 15.5 hours of darkness. GPP was then calculated as GPP ¼ NCP þ 24DR:
ð6Þ
NCP was also determined by carbon mass balance according to NCP ¼ �h½ DDIC � 0:5DTA� � ðkCO2 Þð0:027Þð DpCO2 Þ
ð7Þ
where DDIC and DTA are the daily rates of change of DIC and TA, respectively, as determined by linear regression, kCO2 (1.8 m d�1) is the gas exchange coefficient for CO2, 0.000027 mol m�3 matm�1 is the solubility of CO2 at 26.5�C and 34.5 ppt and DpCO2 is the water-air pCO2 difference averaged over the 7- to 9-day experimental period. 2.6. Estimation of Gas Exchange Coefficients [14] The gas exchange coefficient is a function of temperature and the turbulence at the air-water interface. In natural settings, wind is the primary factor causing turbulence at the interface; however, wind is absent in the Biosphere. In the tank the primary cause of turbulence is the wave machine. Since we could not use the usual parameterizations to compute kCO2 or kO2 from wind speed, we determined it empirically for the specific condition prevailing in the tank. The manmade inert gas SF6 was added to the water, and the gas transfer velocity, kSF6, was determined from the rate of disappearance of the tracer over time according to kSF6
� � h Ci � aCa ln ¼ Dt Cf � aCa
ð8Þ
where Ci and Cf are the average SF6 concentrations at the start, ti, and end of the gas exchange experiment, tf, Dt = tf � ti, a is the Ostwald solubility coefficient, Ca is the SF6 concentration in the air, and h is the mean depth of the water column, 3.5 m. Based on repeat measurements, kSF6 was determined to be 1.4 ± 0.1 m d�1. The gas transfer velocity for CO2 or O2 was computed from kSF6 using the Schmidt number relationship as follows: � kx ¼ kSF6
� Scx �1=2 782
ð9Þ
where kx is the gas transfer velocity of CO2 or O2 in m d�1, and Scx is the Schmidt number of CO2 (487) or O2 (432) at 26.5�C, respectively. Schmidt numbers were computed as a function of temperature according to Jahne et al. [1987]. The kCO2 was determined to be 1.8 ± 0.1 m d�1 and kO2 was found to be 1.9 ± 0.1 m d�1. The latter compares favorably with direct estimates of kO2 of 2.3 ± 0.4 m d�1 based on the rate of oxygen loss at night following an oxygen injection (C. Langdon, unpublished results, 2000). [15] In order to determine if the gas exchange of CO2 is chemically enhanced relative to the rate that would be estimated from the inert tracer SF6, we employed floating chambers or helmets to measure the relative gas exchange rates of CO2, O2, and SF6. The gas transfer velocity (k) for
11 - 5
CO2, N2, and O2 were measured by floating an openbottom, helium-filled chamber [Copeland and Duffer, 1964]. On 18 December, 2,500,000 units of carbonic anhydrase (Sigma Chemical Co. C3934) was dissolved in 20 L of Biosphere ocean water and added to the tank. Exchange rates were measured before and after the addition in order to see if extracellular CA might play a role in enhancing the exchange of CO2. [16] Chambers were deployed in front of the wave generator, and near the observation platform midway between the generator and the beach. These sites were chosen to include the regions expected to have the largest and smallest turbulence. Each chamber was initially filled with helium, and samples were periodically drawn to monitor increases in the partial pressure of CO2, N2, and O2. Two different chamber geometries were used. One had an area of 1000 cm2, a total height of 8 cm, and was deployed with headspace heights of 5– 7 cm. The corresponding dimensions for the second were 625 cm2, 20 cm, and 10 cm. Both were made of aluminum to avoid both thermal greenhouse effects from light penetration and gas diffusion through chamber walls. Measured transfer velocities for the two designs were indistinguishable. [17] Samples were drawn at intervals of 0.5 –2 hours. CO2 was analyzed using a coulometer. N2 and O2 were analyzed using gas chromatography. Exchange rates were assumed to follow first-order kinetics with the deficit from equilibrium, and linear least squares fits to the gas-phase data were used to calculate the exchange rate as a piston velocity. The pCO2,w decreased nearly linearly with time during the daylight hours, and this effect was included in the computation. For CO2, the time constant for equilibration between the chambers and the water was 1 – 3 hours, depending on chamber height and the piston velocity. The initial 3 – 5 hours of the deployment was chosen for data analysis. A separate calculation was also done for the first hour of the experiment, but no significant difference was observed between this period and the longer time intervals. For consistency, the same time interval was used to calculate gas transfer velocities for N2 and O2, although their lower solubility’s result in much longer time constants for equilibrium. However, no significant differences were observed between results for 5 hours and overnight experiments. The uncertainty in a single experiment is generally less than 10%, with the largest contribution coming from the estimate of headspace height. Replicate experiments on the same day and on different days were within experimental uncertainties. Gas transfer velocities for the various gases (CO2, N2, and O2) were normalized to a Schmidt number (Sc) of 600, corresponding to the value for CO2 at 20�C. 2.7. CO2 Gas Exchange Flux [18] The flux of CO2 into (I) or out of (E) the tank in units of mol m�2 d�1 depends on the gas transfer velocity for CO2 and the pCO2 of the overlying air or water, respectively. The invasive and evasive fluxes were computed as follows: I ¼ 0:000027kCO2 pCO2;air
ð10Þ
E ¼ 0:000027kCO2 pCO2;w
ð11Þ
11 - 6
LANGDON ET AL.: EFFECT OF ELEVATED CO2 ON COMMUNITY METABOLISM
where kCO2 is the gas transfer velocity for CO2 and 0.000027 is the solubility at 26.5�C and 34.5 ppt in mol m�3 matm�1. I and E were integrated over the periods 12– 21 January 2000 and 11 – 18 December 2000 to obtain the total fluxes of CO2 into and out of the water during the experimental periods. 2.8. Carbonate Precipitation and Dissolution [19] Calcification (C) is the processes whereby CaCO3 is precipitated from solution and dissolution (D) is the reverse process where CaCO3 solid is returned to solution. Both processes could be occurring simultaneously in different parts of the tank. Currently, there is no way of measuring C and D independently. For now, we measure the net rate of community production or solution (G) of calcium carbonate from the change in TA of the water according to G ¼ �0:0005hDTA ¼ C � D
ð12Þ
where DTA is the daily rate of change of total alkalinity and G has units of mol CaCO3 m�2 d�1. We take a value for D from the literature and add it to G to get an estimate of C. This will be discussed in section 3 on calcification and dissolution. It will be seen that D G and D DIC.k14C, so that uncertainty in the value of D and how it might change with pCO2 is unlikely to contribute significant uncertainty to our estimates of C or R. 14
C Dilution-Based Measurements of Daily 2.9. Respiration (Light Plus Dark) and Organic Matter Turnover Time [20] A new radiocarbon isotope dilution method was employed to estimate both carbon-based gross community respiration (light plus dark) and turnover time of the organic carbon pool. On 12 January 2000 and again on 11 December 2000, approximately 4 mCi of radiocarbon (in HCO� 3 form) were added to the water. This addition raised the (14C/ C)/(14C/C1850) ratio in the dissolved inorganic carbon pool (DIC) by a factor of approximately 4. The excess 14C of the water was then followed for 6 months as it returned to a new steady state value. [21] The processes affecting the excess 14C of the DIC are respiration, invasion, dissolution, and chemical additions. These processes add untagged carbon (zero excess 14C) and have the effect of diluting the spike. The expected rate of decrease of excess 14C due to respiration, invasion, and dissolution is 2 – 3% d�1. Chemical additions would also dilute the 14C spike but with one exception we avoided making any chemical additions during the experimental periods. Photosynthesis, calcification, and evasion all remove 12C and 14C from the DIC pool at very nearly the ratio it is present in the water, and hence their impact on 14 C/C or the excess 14C of the DIC is negligible. This is not quite true, because photosynthesis preferentially removes 12 C relative to 14C with a fractionation factor a of 0.95 – 0.98 depending on the availability of inorganic carbon and would cause the 14C/C of the DIC to increase with time. However, based on a straightforward Rayleigh distillation calculation, it is possible to show that given a DIC pool size
of 7 mol C m�2 and an approximate gross photosynthetic rate of 0.17 mol C m�2, the maximum change in 14C/C due to photosynthesis would be +0.1% d�1 or less than 5% of expected signal. [22] The slope of the initial linear portion of a plot of the logarithm of excess 14C versus time gives an estimate of the instantaneous rate of decrease of excess 14C, k14C, with units of day�1. The product DIC.k14C, where DIC is the amount of inorganic carbon contained in the water column with units of mol C m�2, is equal to the gross flux of untagged carbon into the DIC pool. By subtracting the flux due to invasion, dissolution and chemical addition (A) a measurement of carbon-based gross daily respiration (R) is obtained. R ¼ DIC � k14C � I � D � A:
ð13Þ
Light respiration (RL) was computed from the difference between R determined by equation (13) and RD obtained from oxygen mass balance by integrating equation (5) from sunset to sunrise. RL ¼ R � RD :
ð14Þ
A carbon-based estimate of the ‘‘true’’ rate of gross production was obtained from the sum of NCP from equation (7) and R from equation (13). This estimate takes into account the measured rate of respiration in the light. GPP ¼ NCP þ R:
ð15Þ
The turnover time of the standing crop of living biomass was found by tB ¼ Org=GPP
ð16Þ
where Org is the algal standing crop in mol C m�2. 2.10. Statistics [23] All confidence intervals in the text, tables and figures are 90% CIs.
3. Results [24] The coral reef community living in the Biosphere 2 ocean mesocosm was preconditioned to a normal or elevated CO2 carbonate chemistry for 1 – 2 months prior to a 7- to 9-day period during which the community metabolism was characterized by a variety of methods. The physical and chemical conditions during the experimental phase of the present-day and elevated CO2 experiments are given in Table 1. A year separates the two experiments. This was necessitated by several practical considerations. First, light varies by a factor of 3 seasonally. By running the experiments at the same time of year, we keep the light received by the community as nearly identical as possible. Second, it takes 4 – 6 months for the 14 C/C of the DIC pool to return to a steady state background level. This prohibited us from running the experiments during a single season. The need to precondition the community for a lengthy period to ensure that we were not looking at transient responses also dictated against running the experiments back to back in a single
LANGDON ET AL.: EFFECT OF ELEVATED CO2 ON COMMUNITY METABOLISM Table 2. Bimonthly Surveys Of Algal Standing Stock of the Dominant Four Species in the Biosphere 2 Coral Reef Mesocosm in g dry wt. m�2 Date 23 19 18 16 26 11
Jan 2000 Feb 2000 March 2000 June 2000 Sep 2000 Nov 2000
Total Haptilon Amphiroa Gelidiopsis Chondria Biomass cubense fragillisima intricata dasyphylla 485 453 520 642 441 405
308 306 342 423 293 248
74 61 49 113 68 51
48 48 52 65 37 42
30 31 42 25 32 46
season. Third, the biomass and structure of the algal community has some seasonality. By running the experiments during the same time of year, we were able to keep the algal biomass and the relative structure of the algal community similar during the two experiments. Four species of macroalgae comprised 95% of the biomass during the two experiments, and the relative dominance of these species did not change by more than 5% (Table 2). The four species and their contribution to total algal biomass were Haptilon cubense 61 – 64%, Amphiroa fragillisima 13 –15%, Gelidiopsis intricata 10%, and Chondria dasyphylla 6 –11%. This constancy is likely due to the very low net production of the system that is in turn due to low nutrient levels, in particular PO4 < 0.08 mM [Falter et al., 2001].
11 - 7
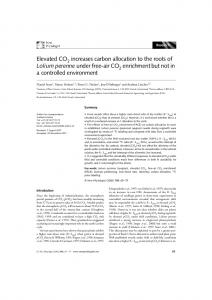
of our measurements. Neither exhibited a response to elevated seawater pCO2. 3.3. Total Flux of Untagged Carbon [27] The total flux of untagged carbon into the DIC pool was measured by spiking the water with NaH14CO3 and observing the rate at which the spike was diluted by the various processes that introduce untagged carbon to the DIC pool. A summary of the sample dates and the measured isotopic composition of the DIC is given in Table 5. Figure 4 shows the initial rapid rate of decrease of excess 14C followed by a gradual approach to a steady state value over a 6-month period. The initial rate of decline of excess 14C (k14C) was estimated by plotting the natural logarithm of excess 14C virus time and doing a linear regression through the linear portion of the data (Figure 5). During the presentday CO2 experiment, we did not collect many samples, and we can only estimate the rate from the post spike and the replicate day 9 samples. However, during the elevated CO2 experiment we sampled more frequently, and we could clearly establish that the rate of decrease in excess 14C was constant for at least the first 7 days. k14C was �0.043 ± 0.005 d�1 during the present-day pCO2 experiment and �0.046 ± 0.005 d�1 during the elevated pCO2 experiment. The flux of untagged carbon required to explain the observed rate of dilution of the 14C spike is 0.043 ± 0.005 * 6.87 or 0.30 ± 0.03 mol C m�2 d�1 where 6.87 mol C m�2 is the size of the DIC pool (Table 1). The flux
3.1. GPP, NCP, and RD Based on Oxygen Mass Balance [25] Instantaneous rates net production were measured throughout the two experimental periods (Figure 2). These were obtained by applying equation (5) to the oxygen concentration time series. NCP was determined by integrating NP(t) from sunrise to sunrise the next day and RD by integrating from sunset to sunrise. DR, the hourly rate of dark respiration, was found by dividing RD by the number of hours of darkness. GPP was then computed using equation (6). The rates of NCP, GPP, and DR estimated by oxygen mass balance are given in Table 3. There was no significant effect of seawater pCO2 on DR, NCP, or GPP on an areal basis or for DR and NCP on a biomass specific basis. There was a slight but statistically significant increase in biomass specific gross photosynthesis computed as NCP + 24DR (0.015 ± 0.001 versus 0.019 ± 0.001) at P = 0.1. 3.2. NCP Based on Carbon Mass Balance [26] NCP was determined independently by carbon mass balance. The daily rate of change of DIC and TA over the two experimental periods 12– 18 January 2000 and 11– 18 December 2000 were determined by linear regression (present-day n = 6; 2X future n = 8) (Figure 3). Equation (7) was used to compute the carbon-based NCP based on these data and the pCO2 data given in Table 1. NCP during the present-day pCO2 experiment was �0.01 ± 0.01 and during the elevated pCO2 experiment it was �0.001 ± 0.005 mol C m�2 d�1 (Table 4). The oxygen- and carbon-based measurements of NCP agree to within the analytical limits
Figure 2. Time series of instantaneous net primary production derived from an oxygen mass balance used in computing dark respiration, net community production, and conventional gross primary production (NCP + 24DR).
11 - 8
LANGDON ET AL.: EFFECT OF ELEVATED CO2 ON COMMUNITY METABOLISM Table 3. Areal And Biomass-Specific Hourly Dark Respiration, Net Community Production and Conventional Gross Primary Production (NCP + 24DR) Based on Oxygen Mass Balance
Date
DR, mmol C m�2 h�1
NCP, mol C m�2 d�1
GPP, mol C m�2 d�1
DR, mmol C mol algal C�1 h�1
NCP, mol C mol algal C�1 d�1
GPP, mol C mol algal C�1 d�1
12 Jan 2000 13 Jan 2000 14 Jan 2000 15 Jan 2000 16 Jan 2000 17 Jan 2000 18 Jan 2000 19 Jan 2000 20 Jan 2000 21 Jan 2000 Avg 90% CI 11 Dec 2000 12 Dec 2000 13 Dec 2000 14 Dec 2000 15 Dec 2000 16 Dec 2000 17 Dec 2000 18 Dec 2000 Avg 90% CI
7.3 6.9 6.7 6.7 6.9 nd nd 7.9 8.4 8.6 7.4 0.4 5.5 6.6 6.6 6.6 7.0 6.8 7.3 7.5 6.7 0.3
�0.009 �0.004 �0.022 �0.015 �0.035 nd nd �0.011 �0.015 �0.046 �0.020 0.008 0.004 �0.005 �0.007 0.017 �0.006 0.010 0.010 0.002 0.003 0.005
0.17 0.16 0.14 0.15 0.13 nd nd 0.18 0.19 0.16 0.16 0.01 0.14 0.15 0.15 0.18 0.16 0.17 0.19 0.18 0.16 0.01
0.70 0.66 0.64 0.64 0.66 nd nd 0.76 0.81 0.83 0.71 0.04 0.63 0.76 0.76 0.76 0.80 0.78 0.84 0.86 0.77 0.04
�0.001 0.000 �0.002 �0.001 �0.003 nd nd �0.001 �0.001 �0.004 �0.002 0.001 0.000 �0.001 �0.001 0.002 �0.001 0.001 0.001 0.000 0.000 0.001
0.016 0.015 0.013 0.014 0.013 nd nd 0.017 0.018 0.015 0.015 0.001 0.016 0.018 0.017 0.020 0.019 0.020 0.021 0.021 0.019 0.001
required to explain the observed dilution during the elevated pCO2 experiment was 0.046 ± 0.005 * 7.42 or 0.34 ± 0.04 mol C m�2 d�1. 3.4. Invasion [28] Invasion of untagged CO2 is one process that is responsible for the dilution of excess 14C in the DIC pool. This flux must be known in order to compute R using equation (13). The invasion of CO2 into the tank assuming no chemical enhancement was obtained using equation (12) and a kCO2 based on SF6. During the present-day experiment, the flux was 0.019, and during the elevated pCO2 experiment, it was 0.017 mol CO2 m�2 d�1. To check the hypothesis that CO2 is chemically enhanced, floating gas exchange chambers were deployed during the elevated pCO2 experiment. The k values for O2, N2, and CO2 were determined at two locations thought to be sites of maximum (near wave generator) and minimum (near platform) turbulence before and after the addition of 2.5 million units of carbonic anhydrase (CA). The results are summarized in Table 6. As expected kO2 and kN2 are similar at each site, and are much higher near the wave generator than near the platform. CO2 exchange is enhanced relative to the rate for the two nonreactive gases, ranging from 1.4-fold at the wave generator to 2.2-fold at the platform. Addition of the carbonic anhydrase caused a modest increase in CO2 exchange rate that is more evident at the platform (1.3-fold) than at the wave generator (1.1-fold) mirroring the pattern in CO2 enhancement. [29] The helmet based kCO2 before the addition of CA (0.79 – 1.34 m d�1) are significantly lower than the value of 1.8 ± 0.1 m d�1 determined by SF6. It may be that the floating chambers alter the turbulence at the air-water interface within the chamber and that the relative reduction is greatest where turbulence is low. Given this concern we
chose to use the SF6 based kCO2 in our calculations. However, we note that if the floating chamber data are correct in a relative sense and CO2 gas exchange is chemically enhanced by a factor of 1.4– 2.2, then invasion could
Figure 3. Changes in DIC and TA during the days just after the radiocarbon additions used to compute carbonbased net community production and calcification.
LANGDON ET AL.: EFFECT OF ELEVATED CO2 ON COMMUNITY METABOLISM
11 - 9
Table 4. Carbon-Based Measurements of Areal and Biomass-Specific Net Community Production and Calcificationa
Date
DDIC, mmol m�3 d�1
DTA, mequiv m�3 d�1
DpCO2, matm
NCP, mol C m�2 d�1
NCP, mol C mol algal C�1 d�1
C, mol CaCO3 m�2 d�1
�8 (2) �5.4 (0.6)
�23 (4) �3 (2)
12
�0.01 (0.01) �0.001 (0.005)
�0.001 (0.001) �0.0001 (0.0006)
0.041 (0.007) 0.006 (0.003)
12 – 18 Jan 2000 11 – 18 Dec 2000
315
a
The 90% confidence intervals are given in parentheses. DpCO2 is the air-water pCO2 difference.
be as much as 0.042 and 0.037 mol C m�2 d�1 during the present-day and elevated pCO2 experiments, respectively. However, invasion, whether chemically enhanced or not, is a small term (6 – 14%) in the carbon budget. 3.5. Calcification and Dissolution [30] Dissolution is another process that releases untagged inorganic carbon (CO2� 3 ) into the DIC pool and must be known to compute R. The alkalinity method used in this study measures the net calcification (C + D). However, under conditions when C will be minimal the method can yield an estimate of D. Such conditions can exist at night when calcification by corals and algae is at a minimum and when the saturation state of the overlying water is very low and not conducive to precipitation of CaCO3. The latter condition pertained during a previous study in the B2 ocean mesocosm. It was observed that when arag was 1.3, the B2 reef community had a net daily dissolution rate of 0.003 – 0.008 mol CaCO3 m�2 d�1 [Langdon et al., 2000, Table 4]. This flux must represent an upper limit on the dissolution occurring during these experiments when arag was a factor of 1.8 to 2.2-times higher. Dissolution rates of 0.0006 – 0.0009 mol CaCO3 m�2 d�1 have been observed at night in Table 5. Radiocarbon Ages and Date
Days Since Spike
19 Jul 1999 10 Jan 2000 12 Jan 2000 21 Jan 2000 21 Jan 2000 17 Feb 2000 9 Mar 2000 17 Apr 2000 14 Jun 2000 14 Jun 2000 15 Jun 2000 15 Jun 2000 16 Jun 2000 7 Dec 2000 11 Dec 2000 11 Dec 2000 11 Dec 2000 12 Dec 2000 12 Dec 2000 17 Dec 2000 17 Dec 2000 18 Dec 2000 1 Feb 2001 1 Mar 2001 3 May 2001 4 Jun 2001
�176.7 �1.7 0.0 9.0 9.0 36.0 57.0 96.0 154.0 154.4 155.0 155.4 156.0 �3.6 �0.1 0.0 0.4 1.0 1.4 6.0 6.4 7.4 52.3 80.3 143.3 174.9
14
14
C Age, years
5090 4715 �12440 �9685 �9745 �4290 �2130 420 1490 1110 1090 1650 970 890 795 �10980 �10760 �10440 �10330 �9105 �9070 �8875 �4740 �3210 �1010 150
C/C Ratios of the DIC Pool 14
(C/C)/(14C/C)1850 Excess 0.54 0.56 4.56 3.26 3.28 1.69 1.30 0.95 0.83 0.87 0.88 0.82 0.89 0.90 0.91 3.82 3.71 3.57 3.52 3.04 3.02 2.95 1.78 1.48 1.13 0.98
14
C
natural reef sediments [Gattuso et al., 1997; Boucher et al., 1998] and in the Monaco coral reef mesocosm [Leclercq et al., 2002]. The saturation state is generally lower at night due to respiration CO2 so these would represent an upper estimate of the dissolution rates during the day. However, for this study, we take 0.001 mol CaCO3 m�2 d�1 as a conservative estimate of D in our system. This flux is negligible (0.3%) in comparison to the total flux of untagged carbon into the DIC pool of 0.30 – 0.34 mol C m�2 d�1. We note that even the highest dissolution rate we observed when arag = 1.3 is only 3% of the total flux. [31] The rate of net community calcification, G, was determined from the daily rates of change of TA shown in Figure 3 using equation (12). D was assumed to be 0.001 mol CaCO3 m�2 d�1 and independent of pCO2. This value was added to G to obtain C. The assumption that D is independent of saturation state of the water overlying the sediment is supported by the results of Leclercq et al. [2002]. Even if the assumption is not strictly true, D is so small relative to G that the results would not change significantly. During the present-day pCO2 experiment C was 41 ± 7 mmol CaCO3 m�2 d�1 and during the elevated pCO2 experiment it was 6 ± 3 mmol CaCO3 m�2 d�1. The rates are significantly different at the P = 0.1 level. 3.6. Daily Respiration [32] We can now use equation (13) to compute R. The fluxes and their uncertainties are summarized in Table 7. If
4.01 2.71 2.73 1.14 0.75 0.40 0.28 0.32 0.33 0.27 0.34 2.92 2.81 2.67 2.62 2.14 2.12 2.05 0.88 0.58 0.23 0.08
Figure 4. Time course of excess 14C of the DIC in the Biosphere 2 tank following additions of 4 mCuries of Na14HCO3 on 12 January 2000 and 11 December 2000.
11 - 10
LANGDON ET AL.: EFFECT OF ELEVATED CO2 ON COMMUNITY METABOLISM
mmol C m�2 h�1. We find that light respiration is significantly greater than the corresponding rate of dark respiration and that the ratio of light to dark respiration increases significantly with increasing pCO2 from 2.2 ± 0.6 at present-day pCO2 to 3.9 ± 0.8 at the elevated pCO2.
Figure 5. Log plot of excess 14C used to estimate the dilution rate during the 7 – 9 days following the radiocarbon addition. we assume that invasion is not chemically enhanced and use a nominal value for D of 0.001 mol CaCO3 m�2 d�1, we find that R was 0.25 ± 0.03 and 0.32 ± 0.04 mol C m�2 d�1 during the present-day and elevated pCO2 experiments, respectively. If we base R on the extreme assumption that CO2 gas exchange is enhanced by 2.2-fold and use the highest dissolution rate observed in the B2 tank when the saturation state was much lower than in these experiments, then we find that R was 0.22 and 0.29 mol C m�2 d�1 during the present-day and elevated pCO2 experiments, respectively, a difference of only 9– 12%. 3.7. Light Respiration [33] Light respiration was calculated according to equation (14) as the difference between daily respiration, R, and dark respiration, RD. RD based on the O2 budget was 7.4 mmol C m�2 h�1 or 0.115 ± 0.003 mol C m�2 d�1 for the 15.5 h night during the present-day pCO2 experiment and 6.7 mmol C m�2 h�1 or 0.104 ± 0.005 mol C m�2 d�1 for the night during the elevated pCO2 experiment. Subtracting these estimates of RD from R we find that RL was 0.14 ± 0.03 (CI based on propagation of error) and 0.22 ± 0.04 mol C m�2 d�1 for the present-day and elevated pCO2 levels, respectively. Dividing by the number of hours of daylight, we find that the hourly rates of light respiration were 16 ± 4 and 26 ± 5 mmol C m�2 h�1, respectively. These compare to hourly rates of dark respiration of 7.4 ± 0.4 and 6.7 ± 0.3
3.8. Gross Primary Production [34] With measurements of NCP and R it is now possible to compute the ‘‘true’’ GPP using equation (15). This measurement of GPP has the advantage of being entirely carbon-based and taking into account the true rate of respiration in the light. For comparison, we also computed GPP in the conventional way as the sum of NCP and the dark respiration rate extended through the day. We designate the new estimate of GPP as NCP + R and the conventional estimate as NCP + 24DR. NCP + R was 0.24 ± 0.03 and 0.32 ± 0.04 mol C m�2 d�1, respectively, during the present-day and elevated pCO 2 experiments. NCP + 24DR did not change significantly, 0.17 ± 0.01 versus 0.160 ± 0.009 mol C m�2 d�1. GPP based on the new measurements of daily respiration is 1.4 to 2.0-fold greater than the conventional estimates of GPP. This is a consequence of elevated respiration rates in the light (2– 4 times the dark respiration rate) that the conventional method misses. The other thing to note is that NCP + R increases with increasing pCO2, while NCP + 24DR completely misses the quickening of carbon metabolism. 3.9. Turnover Time of Algal Biomass [35] If the standing crop of algal carbon is divided by GPP, an estimate of the turnover time of algal carbon, tB, is obtained (equation (16)). The tB decreased from 43 ± 13 days under present-day pCO2 to 27 ± 4 days under the 2X elevated pCO2 treatment. If we assume that GPP is proportional to the amount of light received, a reasonable assumption given the low light levels during this study, we calculate that tB would have been 20 ± 4 days during the elevated pCO2 experiment if the light level had remained at 10.0 mol photons m�2 d�1, a 53% increase in the rate of algal carbon turnover. [36] Table 8 summarizes all the measurements of community metabolism. Rates that were significantly different at the P = 0.1 level are in bold. Rates are expressed on an areal, biomass specific and where appropriate a light specific basis. The latter normalizations were applied to remove any possible bias due to changes in algal biomass and irradiance during the experiment. We note that the main findings of this study, the increases in light respiration and 14C based GPP and the decrease in calcification, are significant without any
Table 6. Summary of Piston Velocities Obtained From the Helmet Experimenta Location Platform ±1 std dev mean #deployments Wave generator ±1 std dev mean #deployments a
�1
�1
O2, m d
N2 , m d
0.35 0.04 5 0.94 0.07 3
0.36 0.03 5 0.95 0.16 3
CO2 Prespike, m d�1
CO2 Postspike, m d�1
0.79 0.09 2 1.34 0.10 2
1.01 0.04 6 1.39 0.02 3
Enhancement is the ratio of CO2 exchange to the mean for O2 and N2.
CO2 Enhancement Prespike
Postspike
2.2 0.2
2.8 0.1
1.4 0.1
1.5 0.1
LANGDON ET AL.: EFFECT OF ELEVATED CO2 ON COMMUNITY METABOLISM
11 - 11
Table 7. Computation of Daily Community Respiration Ratesa Present Day Flux
2X Future
mol C m�2 d�1 90% CI mol C m�2 d�1 90% CI
(1) Total flux required to explain 14C dilution (2) Invasion (3) Dissolution (4) Chemical addition R (= 1-2-3-4) R (if invasion enhanced by 2.2-fold and D = 0.008)
0.30 0.019 0.001 0.027 0.25 0.22
0.03 0.003 0.001 0.03 0.03
0.34 0.017 0.001 0 0.32 0.29
0.04 0.003 0.04 0.04
a
Confidence interval of R was obtained by propagation of errors of the contributing fluxes.
normalization, indicating that the pCO2 effect on these processes is quite strong and stands out even in the presence of variability in other environmental parameters.
4. Discussion [37] The rates of NCP by the completely independent methods of oxygen and carbon mass balance agree to within experimental errors if gas exchange coefficients for O2 and CO2 are based on the SF6 exchange rate. However, if we accept the helmet results that CO2 gas exchange is enhanced relative to N2 and O2 by a factor of 1.4– 2.2, we find that the oxygen- and carbon-based estimates of NCP differ significantly under the elevated pCO2 condition, i.e., 0.003± versus �0.020 ± 0.005 mol C m�2 d�1. Agreement at the present-day pCO2 condition is not affected by the choice of kCO2 because DpCO2 is very small. These results suggest that CO2 gas exchange is probably not enhanced relative to nonreactive gases. [38] The finding that NCP did not increase in response to increased availability of inorganic carbon is counter to expectations based on laboratory experiments with several species of calcifying macroalgae that found that net photosynthesis or growth increased with increasing supply of inorganic carbon up to a DIC of 3 mM [Borowitzka, 1981]
or even 10 mM [Gao et al., 1993a, 1993b]. The difference is that the laboratory studies were conducted using nutrientenriched seawater or culture media while the present study was conducted using seawater with low nutrient concentrations typical of natural reefs. We believe the community in the B2 ocean biome did not respond to increased availability of CO2 and HCO3� because it is nutrient limited. Leclercq et al. [2002] found that the NCP of a coral-dominated mesocosm also did not increase in response to elevated pCO2. They attributed the lack of response to the fact that corals use HCO3� and not CO2 to meet their inorganic carbon needs. If that were the case, a small increase in NCP would have been expected because HCO3� increased by 15% in their treatments. We suggest that NCP did not increase in their study because the community was nutrient limited. Nutrient concentrations were not reported, but according to J.-P. Gattuso (personal communication, 2002), they have been measured numerous times in the past and are low (NO3 < 1 mM, NH4 < 0.4 mM, PO4 < 0.2 mM) and quite comparable to the concentrations in this study. It is possible that nutrient limitation in the B2 tank may be more severe than undisturbed natural reefs due to the fact that it is a closed system with no input of phosphorus. As a consequence, the response of algal growth to rising CO2 may be somewhat greater than observed in this study. However, it is unlikely to be signifi-
Table 8. Summary of Measurements of NCP, GPP, R, RD, RL, tB and Ca Algal standing crop, mol C m�2 Incident PAR, E m�2 d�1 Seawater pCO2, matm NCP oxygen based, mol C m�2 d�1 NCP carbon based, mol C m�2 d�1 RD night time resp., mol C m�2 d�1 RD night time resp., mmol C m�2 h�1 biomass specific RD, mol C mol algal C�1 d�1 R daily resp., mol C m�2 d�1 biomass specific R, mol C mol algal C�1 d�1 RL light resp., mol C m�2 d�1 RL light resp., mmol C m�2 h�1 biomass specific RL, mol C mol algal C�1 d�1 24DR dark resp. extended thru the day, mol C m�2 d�1 biomass specific 24DR, mol C mol algal C�1 d�1 GPP based on NCP + 24DR, mol C m�2 d�1 biomass specific GPP, mol C mol algal C�1 d�1 photosynthetic efficiency, mol C (mol algal C)�1 (E m�2)�1 GPP based in NCP + R, mol C m�2 d�1 biomass specific GPP, mol C mol algal C�1 d�1 photosynthetic efficiency, mol C (mol algal C)�1 (E m�2)�1 tB, turnover time of standing stock, d C, mol CaCO3 m�2 d�1
Present Day
2X Future
10.4 10.0 404 �0.020 (0.008) �0.01 (0.01) 0.115 (0.003) 7.4 (0.2) 0.011 (0.001) 0.25 (0.03) 0.024 (0.004) 0.14 (0.03) 16 (4) 0.014 (0.003) 0.178 (0.005) 0.016 (0.002) 0.17 (0.01) 0.016 (0.002) 0.0016 (0.0002) 0.24 (0.03) 0.023 (0.004) 0.0023 (0.0004) 43 (7) 0.041 (0.007)
8.7 7.4 658 0.003 (0.005) �0.001 (0.005) 0.104 (0.005) 6.7 (0.3) 0.012 (0.001) 0.32 (0.04) 0.037 (0.006) 0.22 (0.04) 26 (5) 0.025 (0.005) 0.161 (0.007) 0.017 (0.002) 0.160 (0.009) 0.018 (0.002) 0.0025 (0.0003) 0.32 (0.04) 0.037 (0.006) 0.0050 (0.0008) 27 (4) 0.006 (0.003)
a The 90% CI’s are given in parentheses. In the case of computed quantities CI’s are based on propagation of errors. Numbers in bold are significantly different at P = 0.1 based on a Student’s t-test.
11 - 12
LANGDON ET AL.: EFFECT OF ELEVATED CO2 ON COMMUNITY METABOLISM
cant given the low NCPs and P:R ratios close to 1.0 that have been reported for most reefs indicating that they are also nutrient limited [Kinsey, 1985]. [39] The finding that light respiration exceeds dark respiration hinges on the accuracy of the estimates of the total flux of untagged carbon into the DIC pool, the accuracy of the conversion of oxygen consumption to CO2 evolution, and the accuracy of the estimates of the fluxes due to invasion and dissolution. All the factors that contribute to the calculation of the total flux were directly measured, i.e., the concentration of the DIC (±1%), (14C/C)/(14C/C)1850 (