Recovery rates Favia favus Scleractlnlan corals Red Sea. INTRODUCTION .... EP format~ons were similar (Flg. 2b; Fisher's PLSD test, p > 0.05.); these were ...
MARINE ECOLOGY PROGRESS SERIES Mar Ecol Prog S e r
Vol. 146: 101-107, 1997
Published January 30
Effect of lesion size and shape on regeneration of the Red Sea coral Favia favus U. Oren*,Y. Benayahu, Y. Loya Department of Zoology, The George S. Wise Faculty of Life Sciences, Tel Aviv University, Tel Aviv 69978. Israel
ABSTRACT: The present study examined the effect of lesion size and shape on the recovery rates of the scleractinian colonial coral Favia farms Five tissue lesion types, differing in surface area and perimeter, were artificially Inflicted on the upper surface of 46 F.favus colonies in the shallow reef across from the Marlne Biology Laboratory of Eilat (Red Sea). The gradual closure of these lesions was monitored monthly from January to March 1995 by underwater photography. Photographs over time were analyzed with a computerized image analyzer, enabling accurate measurements of the emerging tissue. In this study we present the percent recovery of the various lesion types through time and the ratios between the newly formed tissue and the penmeter length (NFT/P) of each specific lesion. These results show for the first time the significant effect of lesion size and s h a p e on the regeneration capability of a colonial coral. We found that the high recovery rates achieved during the first month are regulated mainly by the penmeter length of the lesion, while during the following months recovery IS influenced more by the surface area of the l e s ~ o nand its surface area/perimeter ratio. The vanous NFT/P ratios recorded in this study indicate that lesions with a relatively long perimeter probably obtain a h ~ g h e energetic r allocation from the colony, probably d u e to the larger colony portion associated w ~ t htheir recovery. KEY WORDS: Lesion shape - Perimeter. Recovery rates Favia favus Scleractlnlan corals Red Sea
INTRODUCTION Coral tissue is continuously being damaged through the activities of fish, echinoids, asteroids, molluscs, polychaetes and microorganisms (Pearson 1981, Brown & Howard 1985, Hutchings 1986, Cameron et al. 1991). In addition, corals suffer tissue damage from hurricanes (Rogers 19931, sedimentation (Rogers 1990), temperature extremes (Jokiel & Coles 1990),emersion at low tide (Loya 1972), competition (Lang & Chornesky 1990) and human activity (Brown & Howard 1985). Damage to the coral surface is manifested in a variety of l e s ~ o nshapes and sizes. The bare skeleton then becomes available for settlement by sessile organisms, which pose a potential threat to the survival of the coral colony (Bak & Steward-Van Es 1980). Although lesions can become a permanent feature, some lesions will recover totally through regeneration of
0 Inter-Research 1997 Resale of full article not perrnllted
the tissue and skeleton (Loya 1976, Bak et al. 1977, Bak & Steward-Van Es 1980, Bak 1983, Meesters et al. 1992, 1994, Meesters & Bak 1993, Van Veghel et al. 1994). Regeneration of a n injury starts with the formation of a new tissue layer by the surrounding polyps, and new septa start to emerge in this layer after approximately 2 wk (Meesters et al. 1994). In general, the regeneration of a lesion, expressed in terms of a reduction in lesion slze, follows a n exponentially decreasing curve (Bak 1983, Meestei-s et al. 1992, Meesters & Bak 1993). Although regeneration in colonial corals has attracted many researchers who have speculated on its ecological consequences, most assumptions proposed for colonial corals a r e based on the regeneration rates of small circular lesions of approximately 1 cm2 (Bak et al. 1977, Lester & Bak 1985, Meesters et al. 1992, 1994, Meesters & Bak 1993, Van Veghel et al. 1994) a n d of 5 cm2 (Bak & Steward-Van Es 1980). An accepted paradigm is that the regeneration of lost tissues is a n 'energy-cost' process. This may explain why regenera-
102
Mar Ecol Prog Ser
tion affects colony growth (Bak 1983), reproduction (Rinkev~ch& Loya 1989, Harrison & Wallace 1990, Van Veghel et al. 1994), resistance to d ~ s e a s e sand competitive ab~lity (Bak & Criens 1981) The trade-off in energy allocation between regeneration, reproduct~on and growth may Indicate that corals are capable of controlling a n d regulating the energy cost of the regeneration process. The ability to recover lesions is considered to play a fundamental role in the survival of corals. However, the effect of lesion shape on this process has not yet been assessed quant~tatively.The objective of the present study was to examlne the effect of shape and size of tissue leslons on the recovery rates of the stony colonial coral Favia f a v u s , a common species on the shallow reefs of the northern Gulf of Eilat (Red Sea).
MATERIALS AND METHODS
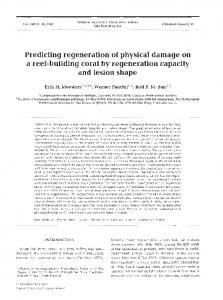
In t h ~ s study 46 colonies of Favia favus, each approximately 4.5 cm in d ~ a m e t e r ,lvere randomly selected in the shallow reef (2 to 3 m) across from the Marine Biology Laboratory of Eilat. U s ~ n ga n a~r-pick, fueled from a SCUBA tank, 5 different types of tissue lesions were artificially inflicted on the upper part of the colonies, 1 lesion type per colony. The lesions were as follo~vs:(1) single polyp l e s ~ o n s(SP, n = 10; Fig. l a ) , (2) elongated lesions composed of 3 polyps in a row (E-3, n = 9; Fig. l b ) , (3) square lesions composed of 6 polyps (SQ-6, n = 8, Fig. l c ) , (4) elongated lesions composed of 6 polyps in a row (E-6, n = 11; Fig. l.d), a n d (5) configurations of 3 elongated lesions composed of 6 polyps each, whlch were infl~ctedparallel to each other with a n interval of 2 undamaged polyps in between (EP, n = 8, Fig, l e ) . All lesions were photographed Immediately after they were damaged (January 1995) by a Nikonos V camera with 35 mm close-up attachment. Analyz~ngthese slldes with an image analyzer (Olympus, CUE-3), w e calculated averages (2SD) of the surface areas of the lesions (i.e. projected area), their perimeters and their perimeter/surface area ratlos (P/SA; Fig. 2a-c, respect~vely). The projected surface areas of the SQ-6, E-6, and each of the 3 l e s ~ o n sIn the EP formation were slmilar (Fig. 2a; 1-way ANOVA, F~sher'sPLSD test, p > 0.05). These relat~velylarge l e s ~ o n swere followed by surface areas of the E-3 and SP lesions, In decreaslng size (Fig. 2a; Fisher's PLSD test, p < 0.01). The perimeter lengths of the E-6 types and each of the l e s ~ o n sIn the EP format~onswere similar (Flg. 2b; Fisher's PLSD test, p > 0.05.);these were followed by, in decreaslng length of penmeter, SQ-6, E-3 and SP leslons (Fig 2b; Fisher's PLSD test, p < 0.01) However, there was no significant
ddference between the perimeter lengths of the SQ6 (116 8 5 mm, Ftg 2b) a n d the E-3 lesions (95 + 7 3 mm) The SP lesions had the h ~ g h e s tP/SA rat10 (Fisher's PLSD test, p < 0 Ol), with the lowest belng for the SQ-6 types (Fig 2c, p < 0 01) The E-3 E-6 and each of the EP format~onlesions evhlbited a s ~ m ~ l a r P/SA ratio (Flg 2c, p > 0 05) The 5 different l e s ~ o n types were photographed every month from January to A p r ~ l1995 Each color slide was analyzed by the image analyzer, enabling accurate measurements of the emerglng t ~ s s u earea over t ~ m e The percent recovery of the 5 d~fferent lesion types was calculated separately for each of the 3 monthly Intervals In addition we calculated the pelcent recovery of the 5 lesion types for the e n t ~ r estudy period (90 d) These results were transformed by arcs ~ n @and tested by ANOVA wlth repeated measures The percent recovery of the different les~onso b t a ~ n e d aurlng tne f ~ r smonth t Interval was tested addit~onally by a l-way ANOVA In order to d e t e r m ~ n ethe effect of the p e r ~ m e t e r length on the regeneration process in Favia f a v u s we c a l c ~ l a t e dthe area (111 111111') of the newly formed tlssue (NFT) from the percent recovery data piev~ously recorded for each lesion type for each tlme Interval These areas of NFT were then divided by the perimeter length of each lesion type, on the basis of the new p e r ~ m e t e rat the end of each Interval Uslng t h ~ sratto, w e were able to standai dlze size a n d shape differences between the 5 lesion types
RESULTS
The percent recovery achieved by each lesion type during each month Interval and throughout the entire study period (relative to leslon size at t = 0) is presented in Table 1. The results presented in each column refer only to the changes in lesion size during a given month interval. The highest recovery percentages of all lesion types were achieved during the first month lnterval followed by a signif~cant decrease during the second a n d third month intervals (ANOVA with repeated measures, p = 0.0001; Table 1 ) . Throughout the entire study period (90 d ) the SP lesions and each of the lesions in the EP formation recovered 59 + 12.4% and 65.2 2 15.5% of their initial size, respectively (Table 1). The recovery percentages of these 2 lesion types were followed by those of the E6, E-3 and SQ-6 lesions, in decreasing order (Table l ) . The lowest recovery rates during all 3 tlme intervals were for the SQ-6 lesions. In a d d i t ~ o nthe , SQ-6 lesions were the only ones to have n e g a t ~ v erecovery rates during the second and third intervals (Table 1) A
azis [ e n p e y,f i ; ie s a ~ n 6 t1j 1 -(dq) ~ uaaMlaq u1 sdA[od pa6e -wepun z jo IeAJalu! ue ~ I ~Ma q l oi p e a 01 [ a [ ~ e ~ suotsal ed paie6uo1a dA[od g a w JO s u o ~ i ~ ~ n 6 t (a) p o '(9-3) a MOJ e U I sdAlod g JO pasodmoa suo~sa;paie6uo1a (p) '(9-0s) sdAlod g JO pasodmoa suo1saI a ~ e n b (a) s !(&-g)MOJ e ut sdA[od JO pasoduioa suoisa1 pale6 -uoia ( q ) ! ( d s )suolsa1 dA1od a16u1s (e) say0103 sn/ie; P~AP-J JO a a e j ~ n ~ s a d d naql uo p a p g j u ~suo1sa1[ P I X J I ~ Pl u a ~ i a j j ~a pq ~ . - 6 3
Mar Ecol Prog Ser 146: 101-107, 1997
Table 2. One-way ANOVA of the percent recovery rates (Table 1) attained during the first month. 'Slyn~ficanceat 99%. For definitions of lesion type abbreviations see Table 1 Lesion type
Mean Difference
Fisher PLSD
SP VS E-3 SP VS SQ-6 SP VS E-6 SP VS EP E-3 VS SQ-6 E-3 VS E-6 E-3 VS EP SQ-6 VS E-6 SQ-6 VS EP E-6 VS EP
11.868 15.615 5.638 -3.154 3.747 -6.229 -15.021 -9.976 -18.768 -8.792
4.887 ' 5.045' 4.647 ' 4.342 5.168 4.781' 4.485' 4.942' 4.656' 4.222'
6 lesions had doubled their initial size during this period. No significant differences were found between the middie les~onsand the external ones in the EP formation (Fig. l e ; l-way ANOVA, p > 0.05). In the first month interval the elongated lesions of the U EP formation attained the highest recovery rates of C L 0.4 48.6 k 8.2% (Table l , first interval).The recovery rates ot the SP lesions were lower (43.2+ 8.1%) but did not differ g 0.3 significantly (l-way ANOVA, Fisher's PLSD test, p > 0.2 0.05; Table 2). However, the percent recovery of both U 0.1 these lesion types were significantly higher than those of .-0 E-6, E-3 and SQ-6 (Fisher's PLSD test, p < 0.01;Tables 1 mm 0.0 SP E-3 SQ-6 E-6 EP & 2, respectively). In addition, we found no significant difference between the E-3 and the SQ-6 lesions Lesion type (Fisher's PLSD test, p > 0.05), which attained the lowest recovery rates during this time interval (Table 1). Fig. 2. Characteristics of the 5 different lesion types. (a) Average surface area (+SD); (b) average perimeter length (+SD); The ratios (NFT/P) between the newly formed tissue (C) average perimeterkurface area (+SD) ratio (in mm2) and the perimeter (in mm) of each of the 5 lesion types for each monthly interval are presented in survey conducted 12 mo after inflicting the lesions Fig. 3. The highest NFT/P ratios for all lesions were showed that all lesions except SQ-6 had completely obtained during the first month and a significant healed (data not shown). Furthermore, some of the SQdecrease with time was recorded in the following intervals (ANOVA with repeated measures, p = 0.0001; Fig. 3). Table 1. Percent reduction of lesion areas ( i S D ) during the first interval The NFT/P ratios obtained for the elon(30 d ) , second interval (31-60 d ) , and third interval (61-90 d ) and during the gated lesions in the EP formation in the entire study period (0-90 d). SP: single polyp lesions (n 10);E-3: elongated the first month were lesions composed of 3 polyps in a row (n = 9); SQ-6: square lesions composed of 6 polyps (n = 8); E-6: elongated lesions composed of 6 polyps in a row (n = highest (Fisher's PLSD test, p < 0.05; 11); EP: configurations of 3 elongated lesions composed of 6 polyps edch, Fig. 3, Table 3). The second highest NFT/P which were inflicted parallel to each other with an interval of 2 unharmed ratios were for the s p and E-6 lesions, polyps in between (n = 8 ) which did not differ significantly between them (Fisher's PLSD test, p > 0.05; Fig. 3, Reduction of lesion area ('h) Lesion type Table 3 ) . The NFT/P ratios of the SP and 30 d 31-60 d 61-90 d 0-90 d E-6 types were significantly higher than SP 43.2 * 8.1 20.5 t 5 0 10 3 * 3.8 59.5 * 12.4 those of the SQ-6 and E-3 lesions (Fisher's 10.0 * 3 0 3.6 r 2 3 34.4 * 7.9 E-3 24.3 * 5.1 PLSD test, p < 0.05; Fig. 3, Table 3). How-5.7 i 2.3 -1.1 r 1 7 15 9 * 9.3 SQ-6 18.6 t 3.9 ever, no significant difference was found E-6 33.6i5.1 16.5*47 72k34 48.6 k 17.3 between the NFT/P ratios of SQ-6 and E-3 25.7 * 5.0 9 0 t 3.8 65 2 r 15.5 EP 48.6 8.2 lesions (Fisher's PLSD test, p > 0.05).
. .E VI
-
-
Oren et al.. Effect of lesions on regeneration of Favla favus --
105 p
Table 3. One-way ANOVA of the NFTIP ratios (Fig. 3) attained during the first month. 'Significance at 95%). For definitions of les~ontype abbrev~ationssee Table 1
P
E-6 and each of the elongated lesions in the EP formai attained ~ diffel-entrecovery rates despite tion ( ~ 2a), their size similar~ty(Table 1 ) . The only lesions demonstrating negative recovery Lesion type Mean Difference Fisher PLSD rates during the second a n d third time intervals were the SQ-6. The major difference between these a n d the SP vs E - 3 0.359 0 183' other lesion types is their relatively low perimeter/sur0.192 0.189' SP VS SQ-6 SP VS E-6 -0.001 0.174 face area ratio (Fig 2c). We noticed that the tentacles SP vs EP -0.374 0.163' of the healthy polyps surrounding each of the elon-0.167 0 194 E-3 vs SQ-6 gated (E-3, E-6 and EP; Fig. l b , d , e ) and the SP lesions -0.360 0 179' E-3 VS E-6 (Fig. l a ) covered the damaged surface area of these -0.733 0.168' E-3 VS EP lesions during night time, while the SQ-6 lesions were -0.193 0.185' SQ-6 vs E-6 -0.566 0.175' SQ-6 vs EP only partly covered, d u e to the greater distance be-0.372 0.158' E-6 vs EP tween their surrounding polyps and the center of these lesions. Although the surface area of the SQ-6, E-6 a n d each of the lesions in the EP formation were similar DISCUSSION (Fig. 2a), the SQ-6 lesions were more adversely affected by sediment and algae (authors' pers. obs.). The results obtained in this study show that the We assume that the increase in lesion area recorded in regeneration process in the colonial coral Favia favus the SQ-6 lesions during the second a n d third time is strongly affected by the size and shape of the lesion. intervals indicates a possible threshold of wound size We found that in some cases large lesions recovered a n d shape for ~ t recovery s chances Sweeper tentacles were not noticed in the lesion areas in any of our nightfaster than smaller ones (EP and E-6 vs E-3; Table 1, time observations. first interval), and in other cases they recovered at a Sousa (1984) proposed that regeneration of benthic similar rate (EP vs SP; Table 1, first interval) or more slowly (SP vs SQ-6; Table 1 ) . Bak & Steward-Van Es organisms is pos~tivelyrelated to the ratio between (1980) found in both Agaricia agaricites a n d Porites lesion perimeter and its surface area. The high recovastreoides that small circular tissue lesions of about ery rates of the SP lesions, which obtained the highest 1 cm2 recovered faster than 5 cm2 ones. We recorded a P/SA ratios (Fig 2c), versus the low recovery rates of similar pattern in F. favus, i.e. comparing the recovery the SQ-6 ones wlth the lowest P/SA ratios (Fig. 2c), rates of the small SP lesions to the E-3, E-6 a n d SQ-6 support this presumption. However, in other cases lesions with similar P/SA ratios, such as the E-3, E-6 lesions (Table 1).However, w e found that the recovery and each of the EP ones (Fig. 2c), attained different rates of these small SP lesions were similar to those of recovery rates (Table 1). Therefore, it seems that the the much larger EP lesions (Figs. l a , e & 2a, Table 1). recovery process in colonial corals is more complex The percent recovery rates of the various lesion types and probably regulated by additional factors to lesion revealed that similar sized lesions, such as the SQ-6, surface area or the P/SA ratio of the lesion. Bak & Steward-Van Es (1980) a n d Mees2.0 ters et al. (1994) suggested that regeneration -L in colonial corals is fueled by a definite and limited energetic resource. In addition, they 1.5 .-5 .assumed that the energetic resources re;;U LCL quired for the recovery of lesions in colonial = % 1.0 corals are translocated only from the polyps .E m m; . L directly bordering the lesion. In other words, lesions with similar size a n d shape a r e there2 E 0.5 fore expected to achieve similar recovery =$ rates. In our study w e found that each of the -i' 0.0 5 lesions in the EP formation recovered signifiC cantly faster than the E-6 ones despite their -0.5 I similar surface areas and perimeters (Fig. 2, First i ~ i t e r v o l Second i n t e r v a l Third i~~lerval Table 1, first interval). The fact the EP lesions recovered than the E-6 Ones indicates Fig. 3. Average ratios (+SD) between the newly formed tissue (in mm2) that energetic resources required for the reand perimeter length (mm)of each of the 5 lesion types during the first, second and third month intervals covery of the EP lesions can also be transp
W
-
vi
C) C)
1
I
mar Ecol Prog Ser 146: 101-107,
106
located from polyps that are not directly bordering the lesion. A comparison of ratios between the newly formed tissue and perimeter length of each lesion (Flg. 3 ) ~ n d i cated the importance of perimeter length for tissue I-egeneration in Favia favus. We found that les~onswlth long perimeters such as the E-6 (165 t 7.8 mm) had signlficantly higher NFT/P ratios (see Fig. 3) than lesions with shorter penmeters such as the SQ-6 and E-3 lesions (perimeters = 116 * 8.5 mm, 95 7.3 mm respectively; Fig. 2b). In other words, lesions with longer perimeters seem to bulld relatively more new tissue than leslons wlth shorter perimeters. We propose that the non-significant difference between the NFT/P ratios of the SQ-6 and E-3 lesions during the flrst month lnterval (Fig. 3) results from their similar perimeters (116 + 8.5 mm and 95 7.3 mm, respectively; Fig 2b). The various NFT/P ratlos, whlch standardize the size ar,d shape differences between ihe iebion types, lndicate that different lesions receive different amounts of energy from the colony. The results obtained in this study suggest that long perimeter lesions a r e provlded with greater energetic resources for their regeneratlon. It is loglcal to assume that long perimeter lesions In F. f a v u s obtaln thelr recovery resources from a large portion of the colony, while short perimeter lesions 'activate' smaller portions of the colony. The high recovery rates and NFT/P ratlos demonstrated by the small SP lesions appear to be in contrast to our perimeter length hypothesis. However, w e assume that these small, round shaped lesions (Flg, l a ) succeed in reaching optimal regeneration conditions d u e to the effectlve protection capacity of the healthy polyp tentacles surrounding them. The significantly highest NFT/P ratio was recorded in each of the elongated lesions in the EP formation (Fig. 3, first interval). We suggest that these relatively high ratios result from the proximity of these lesions. We further propose that the adjacent lesions (only 2 unharmed polyps between one lesion and the next; Flg. l e ) are 'regarded' by the colony as 1 single lesion with a very long perimeter. Previous studies showed that regeneration can affect colony growth as well as ~ t sreproduction (Bak 1983, Rinkevich & Loya 1989, Harrison & Wallace 1990, Van Veghel & Bak 1994). These findings indicate an energetic trade-off between the polyps of the colony during the regeneration process. The ability of coral colonies to distinguish between different lesions by their perimeter length enables the colony to control its energy flow according to the severity of the lesion. Regeneratlon charactenstics have been studied for several coral species a n d are accepted as species specific (Bak et al. 1977, Bak & Steward-Van Es 1980, Bak 1983, Meesters et al. 1992). However, the pattern of
*
1997
declining of these rates over time is ubiquitous in most studied specles (Bak 1983, Meesters & Bak 1993). By studying the regeneration of lesions of various shapes in Favia f a v u s we demonstrated that the perimeter of the lesion is a key factor In the regeneration rate of leslons in this species. Similar studies on other specles may reveal that this regeneration pattern is characteristic for other corals as well. Acknowledgements. We thank the staff of H . Steinitz M a r ~ n e B~ologyLaboratory In Ellat for thelr kind hospitality and f a c ~ l ities. We a r e grateful to A. Shoob for the photography, to N. Paz for her editorial assistance and to 2 anonymous referees for their constructive criticism. This research was supported by the Israel Science Foundation (Israel Academy of Sclences a n d Humanities) No. 683/96 and the Porter Super-Center for Ecological and Environmental Studies
*
LlTERATURE CITED Bak RPIM (1983) Neoplasla regeneratlon a n d growth in the reef-bu~lding coral Acropora palmata \1,1r Blol 77 221-227 Bak RPM Brouns JJU '4, Heys FML ( l 977) Regeneratlon and dhpecrs of s p a t ~ a lcompetition in the S c l e r a c t ~ n ~ acorals n A g a r ~ c ~agancites a and Montastrea annulans Proc 3rd Int Symp Coral Reef 1 143-149 Bak RPM, Criens SR (1981) Survival a f t e ~fragmentation of colonies of b l a d r a c ~ smmlrabllls, Acropora palmata a n d A cervicornis (Scleractinia) and the subsequent Impact of a coral disease Proc 4th Int Symp Coral Reef 2 221 227 Bak RPM Steward-Van Es Y (1980) Regenc.ration of superflc ~ a dl a m a g e In the scleractin~ancorals Agancla a g a r ~ c ~ t e s f purpurea a n d Pontes a s t r e o ~ d e s Bull Mar Sci 30 (4) 883-887 Brown BH, Howard LS (1985) Assess~ngthe effects of stress on reef corals Adv Mar B10122 1-63 Cameron AM, Endean R DeVantler LM (1991) The effect of Acanthaster plancl predation on populatlons of two specles of masslve coral Hydrobiologla 216/217 257-262 Harrlson PL Wallace C C (1990) Reproduct~ondispersal and recruitment of scleractln~ancorals Chap 7 In Dubinsky Z ( e d ) Coral reef Elsevier Amsterdam p 133-196 H u t c h ~ n g sPA (1986) Biological destruction of coral reefs Coral Reefs 4 239-252 Jokiel PL Coles SL (1990) Response of Hawailan and other Indo-Pac~flcreef corals to elevated temperature Coral Reefs 8 155 162 Lang J C Chornr sky EA (1990)Competltlon between scleractlnlan reef corals - a revie\,! of mechanisms and effects In Dubinsky Z( e d )Coral reefs Elsevier Amsterdam p 209-252 Lester RT, Bak RPM (1985) Effect of environment on regenera t ~ o nof tissue l e s ~ o n sin the reef coral Montastrea dnnul a r ~ (Scleractinia) s Mar Ecol Prog Ser 24 183-1 85 Loya Y (1972) Community structure a n d species diversity of herrnatypic corals at Eilat Red Sea Mar B ~ o l13 100-123 Loya Y (1976) Skeletal regeneratlon In a Red Sea scleractlnian coral population N a t u ~ e261 490-491 hleesters EH Bak RPM (1993) Effects of coral bleaching on tlssue regeneratlon potent~al and colony survival Mar Ecol Prog Ser 96 189-198 Meesters EH Bos A Gast GJ (1992) Effects of sedlmentdtion and l e s ~ o nposltion on coral t ~ s s u eregeneratlon Proc 7th Int Symp Coral Reef 2 671-678
Oren et al.: Effect of lesions on regeneration of Favia f a v ~ ~ s
107
h4eesters EH, Noordeloos M, Bak RPM (1994) Damage and regeneration: links to growth in the reef-buildlng coral Montastrea annularis. Mar Ecol Prog Ser 112:119-128 Pearson RG (1981) Recovery and recolonizat~onof coral reefs Mar Ecol Prog Ser 4:105-122 Rinkevlch B, Loya Y (1989) Reproduction in regeneratlng colonles of the coral Stylophora pjsUllata. In: S p a n ~ e rE , Stinberger Y, Luria M (eds) Environmental quallty and ecosystem stability, 4B, Environmental quality. Hebrew University. Jerusalem, p 257-265
Rogers CS (1990) Responses of coral reef and reef organisms to sedimentation. Mar Ecol Prog Ser 62:185-202 Rogers CS (1993) Hurricanes and coral reefs: the intermediate disturbance hypothesis revisited Coral Reefs 12:127-137 Sousa WP (1984) The role of disturbance in natural cornmunities. Annu Rev Ecol Syst 15 353-391 Van Veghel MLJ, Bak RPM (1994) Reproductive characteristics of the polymorphic Caribbean reef building coral Montastrea annularis. 111. Reproduction in damaged a n d regenerating colonies. mar Ecol Prog Ser 109:229-233
T h ~ arlicle s was submitted to the editor
Manu~criptfirst received: May 24, 1996 Revised version accepted: November 15, 1996