Proceedings of the 11th Workshop on RF Superconductivity, Lübeck/Travemünder, Germany
EFFECT OF LOW TEMPERATURE BAKING ON NIOBIUM CAVITIES * G. Ciovati†, P. Kneisel, G. Myneni Jefferson Lab, Newport News, VA 23606 W. A. Lanford Department of Physics, SUNY Albany, Albany, NY 12222
Abstract A low temperature (100°C-150°C) “in situ” baking under ultra-high vacuum has been successfully applied as final preparation of niobium RF cavities by several laboratories over the last few years. The benefits reported consist mainly of an improvement of the cavity quality factor and a recovery from the so-called “Q-drop” without field emission at high field. A series of experiments with a CEBAF single cell cavity have been carried out at Jefferson Lab to carefully investigate the effect of baking at progressively higher temperatures for a fixed time on all the relevant material parameters. Measurements of the cavity quality factor in the temperature range 1.37K-280K and resonant frequency shift between 6K-9.3K provide information about the surface resistance, energy gap, penetration depth and mean free path. The experimental data have been analyzed with the complete BCS theory of superconductivity using a modified version of the computer code originally written by J. Halbritter [1]. Small niobium samples inserted in the cavity during its surface preparation were analyzed with respect to their hydrogen content with a Nuclear Reaction Analysis (NRA). The single cell cavity has been tested at three different temperatures before and after baking to gain some insight on thermal conductivity and Kapitza resistance and the data are compared with different models. This paper describes the results from these experiments and comments on the existing models to explain the effect of baking on the performance of niobium RF cavities.
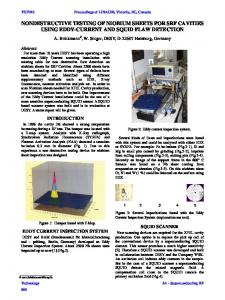
INTRODUCTION The excitation curves (Q0 vs. Eacc) of a superconducting cavity in the GHz range made of bulk niobium shows three distinct regions where the quality factor Q0 changes with the accelerating gradient Eacc. An increase of Q0 is often seen at Eacc below 4 MV/m. It is usually followed by slow Q0 degradation, up to 20-30 MV/m when the quality factor starts to decrease more rapidly, even in absence of field emission (Fig. 1). Baking the cavities between 100°C-150°C under ultra-high vacuum for more than 24h has beneficial effects on the BCS surface resistance and the high field Q-drop. It has been related to oxygen diffusion into the niobium, causing changes of the structure niobium/oxide interface on a nanometer scale.
In this work we wanted to study carefully and systematically the effects of baking on the Q vs. field nonlinearity and on the superconducting parameters. While the effect of baking on the oxide layer has been extensively studied in several laboratories, a lot less is known about the effect of hydrogen, whose presence in niobium has been shown to be problematic [2]. To gain some understanding in this direction, niobium samples baked with the cavity have been analyzed for their hydrogen content and distribution with the NRA [3] at SUNY Albany and compared with samples that have not been baked. Q0
High field Q-drop Low field Q-slope
Medium field Q-slope
Eacc Figure 1: Q vs. field “anomalous” behaviours.
EXPERIMENTAL SETUP & PROCEDURES The RF tests have been conducted on a CEBAF single cell cavity in the TM010 mode at 1.467GHz. The main electromagnetic parameters of the cavity are: Ep/Eacc = 1.78, Bp/Eacc = 4.43mT/(MV/m), R/Q = 96.5Ω, G = 273Ω. Prior to stamping the half-cells, the niobium discs were heat treated in a titanium box at 1400°C for 4h. After electron beam welding the half-cells and the beam tubes, the cavity had a pre-chemistry with Buffered Chemical Polishing (BCP). The preparation for the tests involves: • Degreasing in ultrasonic tank for 20min • BCP with HNO3, HF, H3PO4 in ratio 1:1:1 for 1min, removing about 7 µm • High Pressure Rinsing (HPR) between 40min and 1.5h with ultra pure water • Assembly of a variable input coupler, providing Qext adjustable between 107 and 1011, and of a fixed transmission probe. The assembly is done in a class 10 clean room. • The cavity is attached to a vertical test stand and evacuated to about 10-8 mbar using a turbo-molecular
____________________________________ * Work supported by the U.S. DOE Contract No DE-AC05-84ER40150 †
[email protected]
562
WEO14
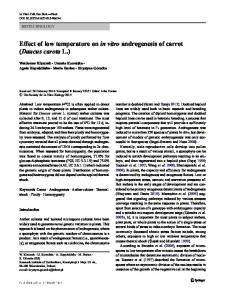
Proceedings of the 11th Workshop on RF Superconductivity, Lübeck/Travemünder, Germany pump backed by a scroll pump Four calibrated Cernox thermometers (two at the top iris, two at the bottom iris) are pushed against the cavity with the aid of an aluminium frame; Apiezon grease between thermometers and cavity is used to insure a good thermal contact. Two niobium samples are prepared with the cavity and one of them is inserted into the pumping line of the test stand. After cool-down in a dewar filled with liquid helium to 4.2K the following tests are performed: • Q0 vs. temperature is measured between 4.2K and 1.37K. The temperature is obtained from the helium pressure measured with a calibrated Baratron gauge. • Q0 vs. Eacc is measured at 2.2K, 2K, 1.37K. • The liquid helium is boiled off with a heater and then the cavity is warmed up through the dewar static heat leak. Frequency and Q0 are measured with a network analyzer in the temperature range 6K to 280K, obtained as the average of the four Cernox readings. The data are automatically acquired with a Labview code. • The test stand with the cavity and the sample are baked “in situ” at a fixed temperature for 48h plus 2h for temperature ramp-up and down. Two heaters blowing hot nitrogen in an oven are used to raise the temperature that is controlled within 1°C. The partial pressures of the main gas species are recorded with a residual gas analyzer during bake-out. • The measurements listed in the first three bullets are repeated on the baked cavity. • The cavity is finally disassembled and processed again for the baseline tests and baking at another temperature. The warm up between 4.2K and 9.5K takes about 9h and the temperature difference across the cavity is within 15mK. The dewar is also opened to atmosphere so that the pressure is within 2mbar. These procedures assure a very accurate measurement of frequency, Q0, and temperature. We choose to bake the cavity for a fixed amount of time because, according to the solution of the diffusion equation [4], it is faster to change the concentration of oxygen at a depth of the order of the RF penetration depth by increasing the baking temperature than by increasing time, as it can be seen in Fig. 2 and 3.
•
1
t = 48 h x = 32 nm
0.8 0.6 y 48 ( T ) 0.4 0.2 0
0 353 363
373 383
393
353
403
413 423 433
T
433
Figure 2: Oxygen concentration relative to the surface as a function of temperature in Kelvin at a depth of 32nm. 1
T = 120°C x = 32 nm
0.8 0.6 y ( t) 0.4 0.2 0
0
0 0
12
24
36
48
60
72
84
t
96 96
Figure 3: Oxygen concentration relative to the surface as a function of time in hours at a depth of 32nm and at temperature 120°C.
Sample location
Variable coupler Thermometers frame Figure 4: Experimental setup.
WEO14
563
Proceedings of the 11th Workshop on RF Superconductivity, Lübeck/Travemünder, Germany
0 Frequency shift [kHz]
The values of the surface resistance are obtained from Q0 through the relation RS = G/Q0 while the variation of the penetration depth λ is obtained from the resonant frequency shift between 6K and 9.3K according to the following formula [5]: G ⋅ [ f (T ) − f (T0 )] (1) λ (T ) − λ (T0 ) = µ 0 ⋅ π ⋅ f 2 (T0 ) where T0 is typically 6K. Furthermore, the surface resistance is expressed as the sum of the BCS term and a residual term Rres. The surface resistance and the penetration depth data are fitted with a computer code [6] that includes the complete BCS theory calculation for diffuse electrons at the surface, as written by Halbritter [1]. The parameters obtained from the fits are the critical temperature Tc, the energy gap at 0K ∆(0), the mean free path of the normal electrons l, the residual resistance Rres and the penetration depth at 0K λ(0). It has been shown that these parameters are strongly dependent on the surface condition [7, 8], while the values of the London penetration depth λL and the coherence length ξF = π⋅ξBCS/2 are considered material constants equal to 32nm and 62nm respectively [9]. The surface resistance in the normal conducting state has been fitted with a computer code [10] that includes the anomalous skin effect and the values of the surface resistivity ρ(T) at 10K and 300K are obtained. The ratio ρ(300K)/ρ(10K) defines the residual resistivity ratio (RRR) which is also a parameter related to the impurity content in the material. The fit of the surface resistance data between 4.2K and 1.37K allows to obtain the material parameters in the RF penetration depth that is about 40nm at those temperatures. Close to Tc, the RF is penetrating about
300nm deep into the surface, and the material parameters obtained from the RF measurements are relative to such depth. Fig. 5 and 6 show examples of the typical frequency shift and surface resistance vs. temperature above 6K, Fig. 7 shows the typical surface resistance in the normal conducting state vs. temperature. -1 -2 -3 -4 -5 -6 6
6.5
7
7.5
8
8.5
9
9.5
Temperature [K]
Figure 5: Typical frequency shift vs. temperature close to Tc. Data are acquired every 30s. 1E-02 Surface resistance [ohm]
TEST RESULTS
1E-03
1E-04
1E-05 7.0
7.5
8.0
8.5
9.0
Temperature [K]
Figure 6: Typical surface resistance vs. temperature close to Tc.
Table 1: Material parameters before and after baking at different temperatures.
∆/kTc (300nm) 1.86 ± 0.03
l(40nm) [nm]
l(300nm) [nm]
Tc [K]
λ(0K)
Surf. RRR
Baseline
∆/kTc (40nm) 1.89 ± 0.03
364 ± 187
954 ± 38
9.256 ± 0.014
46 ± 1
255 ± 26
50°C bake
1.84 ± 0.03
1.86 ± 0.03
193 ± 76
785 ± 36
9.255 ± 0.014
46 ± 1
255 ± 26
Baseline
1.81 ± 0.01
1.91 ± 0.03
695 ± 187
990 ± 61
9.240 ± 0.005
47 ± 1
195 ± 20
70°C bake
1.84 ± 0.02
1.88 ± 0.01
483 ± 130
671 ± 72
9.251 ± 0.009
43 ± 1
220 ± 22
Baseline
1.85 ± 0.02
1.86 ± 0.03
1455 ± 611
697 ± 27
9.255 ± 0.010
45 ± 1
189 ± 19
90°C bake
1.85 ± 0.02
1.85 ± 0.02
178 ± 60
514 ± 13
9.248 ± 0.004
40 ± 1
191 ± 19
Baseline
1.79 ± 0.03
1.96 ± 0.03
387 ± 190
1077 ± 47
9.254 ± 0.015
44 ± 1
175 ± 18
105°C bake
1.82 ± 0.02
1.95 ± 0.03
64 ± 31
708 ± 14
9.233 ± 0.003
42 ± 1
209 ± 21
Baseline
1.80 ± 0.02
1.94 ± 0.06
476 ± 150
854 ± 38
9.238 ± 0.009
36 ± 1
216 ± 22
120°C bake
1.89 ± 0.01
1.95 ± 0.06
26 ± 118
354 ± 78
9.219 ± 0.013
36 ± 1
211 ± 21
Baseline
1.78 ± 0.02
1.96 ± 0.06
250 ± 71
1024 ± 42
9.246 ± 0.019
38 ± 1
218 ± 22
140°C bake
1.89 ± 0.01
1.93 ± 0.01
27 ± 102
454 ± 67
9.199 ± 0.019
32 ± 1
181 ± 18
Baseline
1.81 ± 0.02
1.88 ± 0.05
508 ± 157
784 ± 90
9.242 ± 0.004
41 ± 1
196 ± 20
160°C bake
1.85 ± 0.01
2.10 ± 0.15
27 ± 74
12 ± 1
9.265 ± 0.019
78 ± 1
136 ± 14
564
WEO14
Proceedings of the 11th Workshop on RF Superconductivity, Lübeck/Travemünder, Germany surface resistance has a weak dependence on the mean free path the values obtained from the fits in the 4.2K – 1.37K range have large errors. The penetration depth has a stronger dependence on mean free path and therefore l is obtained more accurately close to Tc.
2.5E-02 2.0E-02 1.5E-02 1.0E-02
10
50
90
130
170
210
250
Temperature [K]
Figure 7: Typical surface resistance vs. temperature in the normal conducting state. The results from the data fits are shown in Table 1. The values of mean free path over a 300nm depth and Tc are the weighted average of the values obtained from the surface resistance and penetration depth fit. The average value of the RRR in the surface before baking is 206 ± 3 and it corresponds to the oxygen concentration of 0.017 at.% [11]. The bulk RRR after the post-purification heat treatment is estimated to be greater than 300. The values of the BCS surface resistance at 4.2K and of the residual resistance, measured at Bp=4mT, are indicated in Table 2, along with the performance limitation at high field (Ep=32÷46MV/m, Bp=80÷116mT). FE refers to field emission and β is the field enhancement factor. Table 2: BCS surface resistance at T=4.2K, Bp=4mT, residual resistance and high field limitations. RBCS (4K) Rres Limitation [nΩ] [nΩ] Baseline 844 ± 59 4.9 ± 0.6 FE β=230 50°C bake
816 ± 57
2.4 ± 0.3
FE β=179
Baseline
1130 ± 79
4.4 ± 0.2
Quench
70°C bake
1048 ± 73
6.4 ± 0.3
Quench
Baseline
1148 ± 80
5.2 ± 0.2
FE β=185
90°C bake
849 ± 59
5.9 ± 0.2
FE β=177
Baseline
1112 ± 78
7.4 ± 0.3
FE β=165
105°C bake
717 ± 50
10.3 ± 0.3
FE β=280
Baseline
1110 ± 78
6.9 ± 0.2
Q-drop
120°C bake
542 ± 38
6.4 ± 0.1
Quench
Baseline
1059 ± 74
5.4 ± 0.2
FE β=192
140°C bake
565 ± 40
8.9 ± 0.2
FE β=188
Baseline
1110 ± 78
4.0 ± 0.2
Q-drop
160°C bake
618 ± 43
7.5 ± 0.2
Quench
It can be seen from Table 2 and Fig. 8 that the BCS surface resistance decreases by as much as 50% after baking and this effect is mainly due to a reduction in the mean free path, as it can be seen in Fig. 9. Since the
WEO14
-10 -20 -30 -40 -50 -60 -70 40
70
100
130
160
Baking Temperature [°C]
Figure 8: Variation of BCS surface resistance at 4.2K as a function of the baking temperature.
∆l [nm] in a 300nm depth
0.0E+00
∆RBCS/RBCS (4.2K) [%]
0
5.0E-03
-100 -300 -500 -700 -900 40
60
80
100
120
140
160
180
Baking temperature [°C]
Figure 9: Variation of mean free path as a function of the baking temperature. The dependence of the BCS surface resistance on the mean free path is well described by the BCS theory and is plotted in Fig. 10 for values of ∆(0K)/kTc between 1.8 for an oxidized surface and 1.9 for a purer surface. Data
BCS theory
BCS theory
1400 RBCS at 4.2K [nohm]
Surface resistance [ohm]
3.0E-02
1200 1000 ∆/kTc = 1.8 800 600
∆/kTc = 1.9
400 1
1 + ξF/l @ 4K
10
Figure 10: BCS surface resistance at 4.2K as a function of the quantity 1+ξF/l. The dependence of the residual resistance on the baking temperature does not show a clear trend, although it generally increases after baking. The values of residual
565
Proceedings of the 11th Workshop on RF Superconductivity, Lübeck/Travemünder, Germany
∆(0K)/kTc in a 40nm depth
before baking
#2 #4 #6 #10
#3 - 90C 48h bake #5 - 105C 48h bake #9 - 120C 48h bake #11 - 140C 48h bake
4.8 H conc [1022/cm3]
resistance in the baseline tests differ by as much as a factor of two, between 4nΩ and 7.4nΩ and the cause for such variations is presently unknown. The values of ∆(0K)/kTc in the 40nm depth before and after baking are within error bars up to 100°C but above this temperature they increase to values corresponding to purer niobium (Fig. 11). Similarly, the surface RRR clearly starts to decrease for baking temperatures higher than 120°C. Both effects are consistent with the model of deeper oxygen diffusion in the niobium at progressively higher temperatures. The average value of the critical temperature before baking is 9.252 ± 0.004K and it is 9.241 ± 0.005K after baking. The decrease can also be explained with oxygen diffusion in the material [11].
4 3.2 2.4 1.6 0.8 0 -0.01
0.01
0.03
0.05 0.07 Depth [µm]
0.09
0.11
Figure 13: Hydrogen concentration vs. depth for samples baked and not baked. The high power RF tests revealed the high field Q-drop without field emission on two occasions. The first time the cavity was baked at 120°C for 48h and after that the Q-drop disappeared and the cavity quenched at a peak magnetic field of 130mT (Fig. 14).
after baking
1.92 1.88 1.84 1.8
1E+11
T=1.37K T=2K T=1.37K, 120C 48h bake
T=2.2K T=2K, 120C 48h bake T=2.2K, 120C 48h bake Quench
1.76 60
80 100 120 140 Baking temperature [°C]
160
180
Q0
40
"Q-drop"
1E+10
Figure 11: ∆(0)/kTc as a function of baking temperature. Fig. 12 shows the partial pressure of the three main gas species after baking for 24h as a function of the baking temperature and the exponential increase in the hydrogen partial pressure can be noticed. H2
Partial pressure [mbar]
1E-06
H2O
1E+09 0
20
40
60
80
100
120
140
Bpeak [mT]
Figure 14: Q0 vs. Bpeak before and after 120°C, 48h baking.
CO
In this case the residual resistance after baking did not increase and there was also an enhancement of the low field Q-slope observed. Fig. 15, 16 and 17 show for both cases the temperature dependence of the surface resistance below 4.2K, close to Tc and the variation of penetration depth respectively.
1E-07
1E-08
1E-05
40
60
80 100 120 140 Baking temperature [°C]
160
180
Figure 12: Partial pressure for the three main gases registered after 24h baking vs. baking temperature. The results from the NRA measurements on samples are shown in Fig. 12: the hydrogen concentration is significantly reduced in the baked samples.
Surface resistance [ohm]
1E-09
Data data - 120C 48h bake
BCS Fit BCS fit - 120C 48h bake
1E-06
1E-07
1E-08
1E-09 0.20
0.30
0.40 0.50 0.60 1/Temperature [1/K]
0.70
0.80
Figure 15: Surface resistance vs. 1/temperature before and after 120°C, 48h baking.
566
WEO14
Proceedings of the 11th Workshop on RF Superconductivity, Lübeck/Travemünder, Germany data data - 120C 48h bake
BCS fit BCS fit - 120C 48h bake
Data 301
Surface resistance [ohm]
∆ Penetration Depth [nm]
1E-03
1E-04
8
8.2
8.4
8.6
8.8
9
9.2
BCS fit - 160C 48h bake
251 201 151 101 51
1.8
2.3
2.8
3.3
3.8
4.3
4.8
y = 1/sqrt(1-(T/Tc) )
Figure 16: Surface resistance vs. temperature close to Tc before and after 120°C, 48h baking. Data data - 120C 48h bake
1.3
4
Temperature [K]
BCS fit BCS fit - 120C 48h bake
155
∆ Penetration Depth [nm]
Data - 160C 48h bake
1
1E-05
Figure 19: Variation of penetration depth as a function of the reduced temperature parameter y before and after 160°C, 48h baking.
MODELS COMPARISON
135 115 95 75 55 35 15 1.3
1.8
2.3
2.8 3.3 3.8 4 y = 1/sqrt(1-(T/Tc) )
4.3
4.8
Figure 17: Variation of penetration depth as a function of the reduced temperature parameter y before and after 120°C, 48h baking. In the second case, the cavity was baked at 160°C for 48h and after that again (Fig. 18) the Q-drop disappeared and the cavity quenched at 114mT peak magnetic field. T=1.37K T=2K T=2.2K, 160C 48h bake
Quench Q-drop
1E+10
1E+09 0
20
40
60
80
Surface analysis studies [12, 13, 14, 15] on niobium samples indicate that baking at progressively higher temperatures causes a conversion of the external Nb2O5 layer to the metallic sub-oxides (NbO, NbO2) and an overall reduction of the oxide layer. The RF measurements reported here are consistent with those results: above about 100°C, the energy gap at 0K in the 40nm region starts to increase towards values corresponding to pure niobium, the surface RRR and mean free path are decreasing, due to oxygen injection in the niobium, causing a reduction of the BCS surface resistance, as predicted by the BCS theory. Furthermore, the NRA measurements show that the hydrogen, which is trapped between the oxide layer and the niobium, is released after baking.
Low Field Q-Slope
T=2.2K T=1.37K, 160C 48h bake T=2K, 160C 48h bake
1E+11
Q0
BCS fit
100
120
J. Halbritter provided an explanation for the decrease of the surface resistance at low field [16]. According to his model, the injection of oxygen in the niobium after baking produces additional NbOx clusters that, at low field, are not in thermal equilibrium with the surrounding niobium and therefore cause additional losses. Above about Bp=12mT thermal equilibrium is achieved. He predicts the surface resistance to be inversely proportional to the square of the peak magnetic field. We fitted the surface resistance at low field according to the following formula:
Bpeak [mT]
Figure 18: Q0 vs. Bpeak before and after 160°C, 48h baking. In this case the residual resistance increased after baking and there is an enhancement of the low field Q-slope. The large variation in the mean free path after baking can be very well detected through the penetration depth, as shown in Fig. 19.
WEO14
Rs = a / Bp2 + b
(2)
which describes quite well the data before and after baking. The average correlation factor r2 over twenty fits is 0.977.
567
Proceedings of the 11th Workshop on RF Superconductivity, Lübeck/Travemünder, Germany Before 120C bake Before 140C bake Before 160C bake
12
where Rs0 and C are fitting parameters and C=γ / Bc2. The average correlation factor r2 over twelve fits for the three models and the three temperatures at which the RF tests were done are listed in Table 3:
After 120C bake After 140C bake After 160C bake
11 9 8 7 6 5 4 3 1
6
11
16
21
Bpeak [mT]
Figure 20: Surface resistance vs. Bp at low field and 1.37K; data are fitted to function (2) before and after baking. The low field Q-slope can be present also before baking, depending on the amount of NbOx clusters and therefore on the oxidation condition.
Medium Field Q-Slope Above about 12mT peak magnetic field, the cavity quality factor is decreasing with higher fields, causing a medium field Q-slope that is temperature dependent. All the models that try to explain this effect involve heating of the inner surface of the cavity with respect to the helium bath due to low thermal conductivity and Kapitza resistance of niobium. The data have been analyzed according to three models: 1. J. Halbritter proposed the following Taylor series of the surface resistance, obtained from the Ginzburg-Landau theory [17]:
Rs = Rs0·(1 + γ·(Bp/Bc) + O(Bp )) 2
4
(3)
where Rs0 = Rres + RBCS and γ are fitting parameters. γ represents the slope and the following expression was obtained:
Table 3: Average correlation factors for the models describing the medium field Q-slope at three different temperatures. Avg. r2 Avg. r2 Avg. r2 Model # (2.2K) (2K) (1.37K) 0.964 0.973 1 0.903 0.963 2 0.860 0.958 3 0.727 0.645 0.909 In Table 4 are indicated the average values of the slope γdata from model #1 at the three different temperatures for all the baselines (before bake) and after all the baking. Table 4: Average values of the slope γ for all the tests obtained from the data fit with model #1. γdata before bake γdata after bake 1.37 K 1.95 ± 0.03 3.46 ± 0.06 2K 1.05 ± 0.03 2.18 ± 0.06 2.2 K 14.4 ± 0.2 19.8 ± 03
T=2K
T=1.37K
T=2.2K
1.6 1.4 y = 13.14x - 0.11 2 r = 0.97
1.2
∆Rs/Rs
Rs [nohm]
10
1.0 0.8
y = 3.78x + 0.01 2 r = 0.99
0.6 0.4
y = 1.52x + 0.03 2 r = 0.94
0.2 0.0 0
0.05
0.1
0.15
2
γ = RBCS(T0)·Bc2·∆/(2·k·T02)·(d/κ + Rk) (4)
2.
where κ is the thermal conductivity, Rk is the Kapitza resistance, d is the wall thickness, T0 is the helium bath temperature and Bc is the critical field which is about 200mT. we propose a Taylor series of the surface resistance starting at first order: Rs = a + b·Bp + O(Bp2)
3.
where a and b are fitting parameters. B. Visentin [18] proposed the so-called “global heating” model, based on a Taylor series of the surface resistance up to first order in temperature: Rs = Rs0 / (1 - C·Bp2)
568
(5)
(6)
(Bpeak/Bc)
Figure 21: Variation of surface resistance vs. Bp2 for the baseline data before 105°C baking. Fitted functions according to model #1 are indicated. It can be seen from Table 4 that the slope before baking at 1.37K is about a factor of two higher than the slope at 2K. The slopes also increase by about a factor of two after baking. At 1.37K the BCS surface resistance is only about 0.4nΩ and the residual resistance is at least one order of magnitude higher. If, in first approximation, we neglect the BCS surface resistance, we conclude that the temperature independent residual resistance has an intrinsic dependence on the RF magnetic field through the slope γdata(1.37K). Furthermore, if we assume that the Taylor series of model #1 refers only to the BCS part of the surface resistance (T dependent) we can obtain an expression that relates the theoretical γ at 2K given by (4) to measured quantities:
WEO14
Proceedings of the 11th Workshop on RF Superconductivity, Lübeck/Travemünder, Germany
γ(2K) = [Rs(2K)·γdata(2K) – Rres·γdata(1.37K)] /RBCS(2K) (7) The average value for the expression on the right hand side is equal to 0.57 and is equal to the value given by (4) assuming a thermal conductivity of 6 W/(m·K) and a Kapitza resistance of 1.25·10-4 (m2·K)/W. Both these quantities are well within published values [19]. On the other hand, the factor of two increase of the slope after baking would be explained by about a factor of thirty higher Kapitza resistance. A confirmation of such an increase would require a direct measurement of Kapitza resistance after baking. Above the superfluid transition temperature (2.17K), the slope increases by about one order of magnitude. This is due to heating of the RF inner surface of the cavity due to the worse heat transfer capabilities of He I.
Bp B ⋅ 1− 2 ⋅B c A Rs = ⋅ exp[− T0 + C ⋅ B p T0 + C ⋅ B p
2
] + R res (10)
where A, B and Rres are obtained from the fit of Rs vs. 1/T between 4.2K and 1.37K while C and Bc are the fitting parameters. 3. global heating model, using formula (6). Both models #2 and #3 are based on a magnetic field effect. The fits with model #2 do not give values of C and Bc that have physical meaning: C turns out to be negative and Bc is smaller than the values of Bp actually measured. Models #3 and #1 can fit all our data very well. Fig. 22 and 23 shows the results of the fit with models #3 and #1 respectively.
High Field Q-Drop
RsE = b·[exp(-c/Ep) – exp(-c/E0)]
(8)
where b, c, E0 are fitting parameters. E0 represents the electric field onset for the Qdrop and the electric surface resistance RsE can be obtained from the measured surface resistance from (3) as follows: RsE = Rs / (1+γ·(Bp/Bc)2) – Rs0
2.
WEO14
(9)
Test#9 1.37K Test#11 1.37K
95
Test#9 2K Test#11 2K
Rs [nΩ]
80 65 50 35 20 5 80
90
100
110
120
Bpeak [mT]
Figure 22: Rs vs. Bp fitted with model #3.
Test#9 1.37K Test#11 2K
Test#9 2K Test#11 1.37K
50 40
RsE [nΩ]
Field emission is the main limitation towards achieving high accelerating gradients in superconducting cavities but sometimes the Q0 vs. field curve is characterized by a sharp decrease of the quality factor at high field in the absence of X-rays, causing the so-called “Q-drop”. During these series of tests, this phenomenon was seen on two occasions and in both cases it disappeared after baking, as shown in Fig. 14 and 18. Such improvement was already seen in many laboratories [18, 20]. We analyzed our data according to three models: 1. J. Halbritter explains the Q-drop as due to Interface Tunnel Exchange (ITE) between conduction electrons in the niobium and localized states in the niobium pentoxide, causing losses due to the electric field [21]. This mechanism introduces an electric surface resistance which becomes important at high field and can be described by the following expression:
30 20 10 0 30
35
40
45
50
Epeak [MV/m]
Figure 23: Electric surface resistance fitted with model #1.
and Rs0 is the surface resistance at low field, where the electric component can be neglected. K. Saito proposed a model to explain the Q-drop based on a temperature increase of the RF surface and a magnetic field dependence of the energy gap, according to the following formula [22]:
569
Proceedings of the 11th Workshop on RF Superconductivity, Lübeck/Travemünder, Germany Table 5: Main fitting parameters and correlation factors for the surface resistance fit of the Q-drop with models #1 and #3. Model #1 Model #3 c C E0 r2 r2 Test # 9 @ 2K 9 @ 1.37K
11 @ 2K 11 @ 1.37K
[MV/m]
820
40.5
0.999
6.36e-5
0.996
789
39.5
0.999
6.69e-5
0.966
700
36.9
0.997
7.81e-5
0.994
679
34.7
0.999
8.84e-5
0.958
The values of E0 obtained from the fits are within 1MV/m of the measured peak electric field at which the Q-drop starts. Model #1 explains the disappearing of the Q-drop after baking as due to the reduction of the niobium pentoxide layer and therefore of the localized states and of the ITE effect. The major problem towards the validation of this model is due to the results from temperature mapping of the cavity surface showing heating in a broad area around the equator region where the magnetic field is stronger [24]. The global heating model is not consistent with the recovery of the Q-drop after baking because the slope γ is stronger after baking and so it should be the parameter C and the Q-drop. In the test before the 160°C baking, the cavity was warmed-up to about 12K and the residual DC magnetic field in the dewar was increased. This operation was repeated a few times to see any influence on the Q-drop. As it can be seen in Fig. 24, there is no significant variation in the behaviour of the Q-drop. The residual resistance is increasing due to the DC magnetic field being trapped during the cool-down [23].
Q0
1E+11
T=1.37K - 2mG T=1.37K - 8mG T=1.37K - 32mG T=1.37K - 140mG
Q-drop 1E+10
1E+09 0
5
10
15
20
25
Eacc [MV/m]
Figure 24: Influence of a residual DC magnetic field on the Q-drop.
SUMMARY Baking a niobium cavity for 48h at temperatures greater than 100°C causes the following effects:
570
•
[1/(mT)2]
[MV/m]
T=2K - 2mG T=2K - 8mG T=2K - 32mG T=2K - 140mG
•
• • •
•
•
Reduction of the BCS surface resistance at 4.2K by as much as 50% and the cavity quality factor at 2K can be improved by as much as 20%. RF measurements are consistent with surface analysis results in explaining the baking effect as mainly due to a modification of the oxide structure and oxygen diffusion in the niobium causing a reduction in the mean free path. Hydrogen is also released from the surface. Its effect on the surface resistance is not clear yet as well as the effect of baking on the residual resistance. The low field Q-slope data are well described by the model proposed by Halbritter of NbOx clusters not in thermal equilibrium with the surrounding niobium. The data at 1.37K suggest an intrinsic dependence of the residual resistance on the RF magnetic field that needs further investigations. Baking seems to increase the Kapitza resistance but more direct measurements would be necessary. The high field Q-drop disappeared after baking at 120°C and 160°C and the data are well described by the ITE model, related to electric field, and by global heating model, related to magnetic field. On the other hand, both models are in conflict with some experimental observations [25]. A residual DC magnetic field does not seem to influence the behaviour of the Q-drop.
ACKNOWLEDGEMENT We would like to thank J. Delayen and J. Halbritter for many useful discussions.
REFERENCES [1]
J. Halbritter., “FORTRAN Program for the Computation of the Surface Impedance of Superconductors”, FZK 3/70-6, Karlsruhe, 1970. [2] B. Aune et al., “Degradation of Niobium Superconducting RF Cavities during Cooling Times”, LINAC 1990, Albuquerque, NM, 1990. [3] W. A. Lanford, “Analysis for Hydrogen by Nuclear Reaction and Energy Recoil Detection”, Nucl. Inst. and Meth. in Phys. Reas. B66 (1992) 65. [4] S. Calatroni et al., “Diffusion of Oxygen in Niobium during Bake-out”, SRF Workshop 2001, Tsukuba, Japan, 2001. [5] J. Halbritter, J. Appl. Phys. 41 (1971) 4581. [6] G. Ciovati, “SUPERFIT: a Computer Code to Fit Surface Resistance and Penetration Depth of a Superconductor”, JLAB-TN-03-003, 2003. [7] P. Kneisel et al., “On Surface Preparation and Measurements of Nb used in High-Frequency Cavities”, J. Appl. Phys. 45 (1974) 2296. [8] A. Phillipp, J. Halbritter, “Investigation of the Gap Edge Density of States at Oxidized Niobium Surface by RF Measurements”, IEEE Trans. On Magn. 19, NO.3 (1983) 999. [9] J. Halbritter, “On Surface Resistance of Superconductors”, Z. Physik 266 (1974) 209.
WEO14
Proceedings of the 11th Workshop on RF Superconductivity, Lübeck/Travemünder, Germany [10] R. Schwab, Externer Bericht 6023, FZK, Karlsruhe, 1997. [11] C. C. Koch et al., “Effect of Interstitial Oxygen on the Superconductivity of Niobium”, Phys. Rev. B 9, NO.3, (1974) 888. [12] Q. Ma, R. A. Rosenberg, “Thermal and ElectronBeam Irradiation Effects on the Surfaces of Niobium for RF Cavity Production”, SRF Workshop 2001, Tsukuba, Japan, 2001. [13] A. Dacca` et al, Appl. Surf. Sci. 126, (1998) 219. [14] C. Z. Antoine et al., “Morphological and Chemical Studies of Nb Samples after various Surface Treatment”, SRF Workshop ’99, Albuquerque, NM, 1999. [15] K. Kowalski et al., “’In-Situ’ XPS Investigation of the Baking Effect on the Surface Oxide formed on Niobium Sheets used for Superconducting RF Cavity Production”, these proceedings. [16] J. Halbritter, “Theoretical Aspects in RFSuperconductivity”, SRF Workshop ’80, Karlsruhe, Germany, 1980. [17] J. Halbritter, “RF Residual Losses, High Electric and Magnetic RF Fields in Superconducting Cavities”, 38th Eloisitron Workshop, Erice, Italy, 1999. [18] B. Visentin et al, “Cavity Baking: a cure for the High Accelerator Field Q0 Drop”, SRF Workshop ’99, Albuquerque, NM, 1999. [19] M. Fouaidy et al., “Kapitza Conductance and Thermal Conductivity of Materials used for SRF Cavities Fabrication”, SRF Workshop ’99, Albuquerque, NM, 1999. [20] P. Kneisel, “Preliminary Experience with ‘in-situ’ Baking of Niobium Cavities”, SRF Workshop ’99, Albuquerque, NM, 1999. [21] J. Halbritter et al, “Electric Surface Resistance RE(T, f, E) of Nb/Nb2O5-y-interfaces and Q-Drop of Superconducting Nb Cavities”, IEEE Trans. On Appl. Supercond. 11, NO. 1, (2001) 1864. [22] K. Saito, “Q-Slope Analysis”, PAC ’03, Portland, OR, 2003. [23] M. Ono et al., “Magnetic Field Effects on Superconducting Cavities”, SRF Workshop ’99, Albuquerque, NM, 1999. [24] G. Eremeev et al., “A Pleasant Surprise: a Mild Baking gives Large Improvement for the Q-slope of a BCP Cavity”, these proceedings. [25] B. Visentin, “Q-slope at High Gradients: Review about Experiments and Explanations”, these proceedings.
WEO14
571