ABSTRACT. Effective mass-transfer kinetics depend on particle-size distribution ... model was used to investigate the effect of PSD and variation of particle porosity on the ..... batch kinetic experiments presented in Figs 2 and 3 in Ref. [10].
ACTA CHROMATOGRAPHICA, NO. 13, 2003
EFFECT OF PARTICLE-SIZE DISTRIBUTION AND PARTICLE POROSITY CHANGES ON MASS-TRANSFER KINETICS K. Kaczmarski1,* and J. Ch. Bellot2 1
Faculty of Chemistry, Rzeszów University of Technology, ul. W. Pola 2, 35-959 Rzeszów, Poland 2 Centre de Bioingéniere Gilbert Durand, UMR-CNRS 5504, UMR-INRA 792, INSA, 135 av. de Rangueil, 31077 Toulouse, Cedex 4, France
ABSTRACT Effective mass-transfer kinetics depend on particle-size distribution (PSD) and particle porosity (among other complex phenomena). The porediffusion flux can vary with adsorbate loading – if the amount of adsorbed species is sufficiently large it can lead to hindrance effects that substantially change particle porosity. By use of batch kinetic adsorption experiments the general rate model was used to investigate the effect of PSD and variation of particle porosity on the pore-diffusivity coefficient, Dp. It was proved that neglecting these phenomena can lead to misinterpretation of experimental data. Modelling of HPLC profiles using PSD and conventional modelling with mean diameters was also examined and compared. INTRODUCTION The use of preparative liquid chromatography for separation and purification of pharmaceutically and biologically active compounds is increasing. Chromatographic separations usually involve complex masstransfer mechanisms that strongly affect band profiles. To enable accurate prediction of these processes, therefore, mass-transport kinetics should be quantitatively described in addition to equilibrium thermodynamics. Indeed, a correct mathematical model of these kinetics is necessary for accurate optimization of separations for maximum productivity of the process. When the mass transport kinetics are slow, the general rate model (GR) is the most accurate tool for prediction of band profiles. This model takes good account of all contributions to band broadening, i.e. axial
- 22 -
dispersion and external and internal mass-transfer resistance, and provides a reliable method for calculation of elution band profiles [1–5]. Most crucial for modelling of band profiles, except for thermodynamics, seems, however, to be intra-particle diffusion, which is usually the rate-limiting step [5–8]. Research into mass transfer resistance inside particles has therefore become an intriguing field in fundamental studies of separation processes. Adsorption of proteins on contemporary adsorbents can be extremely high [9,10]. Hunter and Carta [9] reported adsorption of 280–290 mg bovine serum albumin (BSA) per millilitre of adsorbent (a polymeric anion exchanger BRX-Q). Chen et al. [10] measured adsorption of approximately 150 mg mL–1 BSA on DEAE Spherodex M. Such large amounts of adsorbed protein can substantially change the pore volume of adsorbent available for the species present and can considerably affect the mass flux inside particles. (Pore clogging by sintering or coking is well known in chemical reactor engineering [11,12].) The effect of partial clogging of the pores by adsorbed species was envisaged by Liapis et al. [13], Hunter and Carta [9], and Chen et al. [10]. Gritti et al. [14] have recently demonstrated that during adsorption of butyl benzoate on a monolithic RPLC column the total porosity and, especially, the mesopore porosity is changing substantially, depending on the concentration of butyl benzoate in the liquid phase. In their next paper Piątkowski et al. [15] proved that for robust modelling of diffusion inside a monolithic column the GR model should be used. Indeed, this model can successfully predict chromatographic band profiles even when the mesopore volume changes because of adsorption of feed components on the pore surface of the adsorbent. Excellent agreement was obtained between experimental and calculated band profiles. Variations of mesopore volume affect HPLC peaks and breakthrough curve profiles and also the shape of uptake curves obtained from stirred-batch adsorption experiments (see results and discussion section). These uptake curves are frequently used for evaluation of pore-diffusivity coefficients, Dp [9,10]. By using such an experimental method, Chen et al. [10] investigated pore diffusivity for BSA and γ-globulin in the anion exchanger DEAE Spherodex M and found that the Dp values obtained decrease markedly with increasing initial concentration of the species. It will be shown in this paper that this dependence can result from ignoring changes of adsorbent porosity during the adsorption process. Approxima-
- 23 -
tion of real particle-size distribution (PSD) by use of average diameter can, moreover, lead to misinterpretation of experimental data. The first aim of the work discussed in this paper was to illustrate the effect of adsorbent pore clogging on uptake curves obtained from stirred-batch adsorption experimental data available in the literature. We would like to point out the role of obstruction by adsorbed molecules on the dependence of pore diffusivity on species concentration. The second aim was to investigate the effect of PSD on theoretical uptake curves from stirred-batch adsorption experiments and on HLPC peak profiles. THEORY Model of Differential Mass Balance for Stirred-Batch Adsorption The differential mass balance for the species in the fluid phase can be expressed as:
εe
∂C p 3 ∂C = −(1 − ε e ) × ε p Dp ∂t R ∂r
(1) r=R
initial condition for t = 0 C(0) = C0
(2)
The mass balance equation for a particle is:
(
)
∂ ε p(q) Cp ∂C p ∂q 1 ∂ 2 + = 2 r D p ε p(q ) ∂t ∂t ∂r r ∂r
(3)
initial condition for t = 0 q(r,0) = 0
(4)
Cp(r,0) = 0 boundary conditions for r = 0
∂Cp =0 ∂r
(5)
for r = R - 24 -
Cp = C
(6)
In these equations C and Cp (mg mL–1) are the concentrations of the solute outside the particle and in the stagnant liquid phase, respectively, q (mg mL–1) is the concentration of adsorbed component, t is the time, r is the distance from the particle centre, R is the particle radius, εe is the external porosity, εp the internal or particle porosity, and Dp is the porediffusivity coefficient. The model described by eqs (1–6) is compatible with that used by Chen et al. [10]. To consider PSD conditions, eq. (1) was modified to eq. (1a) as follows:
εe
(1 − ε ei ) × 3 ∂Cpi ∂C = −ε pDp ∑ Ri ∂t ∂r i
r=R
(1a)
where i denotes the ith fraction of particle-diameter distribution, and external porosity εei is an hypothetical external porosity when only the ith fraction exists, calculated by use of the relationship:
ε ei = 1 − (1 − ε e) ×
Vi Va
(7)
where Vi is the volume of the ith fraction and Va is the total volume of adsorbent. Equation (1a) was solved with eq. (3) for each particle diameter. Finally, the differential mass balance model was coupled with the Langmuir isotherm model: q=
qm × Cp Kd + Cp
(8)
where qm is the adsorption capacity and Kd the dissociation constant. Numerical Solution of the Model
The model described above gives equations that were solved by use of the global orthogonal collocation method [16] with 20 collocation points. The set of discretized ordinary differential equations was solved by the Adams–Moulton method, implemented in the VODE procedure [17]. The relative and absolute errors of the numerical calculations were 1 × 10⁻⁶ and 1 × 10⁻⁸, respectively.
- 25 -
Investigation of Particle-Size Distribution
The particle size of a packing is of utmost importance. Particles used in HPLC and, especially, in expanded bed chromatography can vary widely in size [18, 19]. This particle-size distribution can be handled in several different ways. The most popular definitions are [20]: 1. The arithmetic mean: d10 =
∑i ni di
(9)
N
where N = ∑ ni , i is an index of the population, and di is the particle i
diameter of population i. 2. The volume mean:
d30
=
∑i
1 33 ni di
N
(10)
3. The volume-surface mean:
∑i ni di3 d32 = ∑i ni di2
(11)
4. The volume-moment mean:
∑i ni di4 d 43 = ∑i ni di3
(12)
The volume-moment mean (volume- or weight-moment mean) particle size is that most often reported in the chromatography literature, but not everybody abides by this convention [18]. In this work we have compared uptake curves calculated for the PSD presented in Figs 1b and 1d in Ref. [21] with profiles calculated for a mean particle diameter obtained from eqs (11) and (12). Because the PSD was read from the figures, the calculated mean diameter differs slightly
- 26 -
from that given by the authors of Ref. [21]. Because of the illustrative purpose of this work, however, we ignored this discrepancy. The frequency distribution is given in Table I. The calculated values of the mean diameters (d10, d30, d32, and d43) are listed in Table II. Table I Frequency distribution for p-PE1 and Streamline DEAE calculated from data given in Figs 1b and 1d, Ref. [21]
Fig 1b Ni/N (%) d (µm) 1.6 18 4.3 20 3.3 22 3.8 24 2.6 26 2.2 28 3.28 30 4.34 32 12.4 34 8.2 36 14.6 38 20.5 40 4.84 42 4.67 44 5 46 3.2 48 1.17 50 – – – –
Fig 1d Ni/N (%) d (µm) 0.39 65 0.71 75 1.7 95 6.3 105 9.135 115 16.2 125 23 135 12 145 9.135 155 8.033 165 3.072 175 3.704 185 1.97 195 0.77 205 0.705 215 0.705 225 0.47 245 1 275 1 295
Table II Calculated values of mean particle diameters
Adsorbent p-PE1 Steamline DEAE
d10 (µm) 35.9 143.2
d30 (µm) 37.3 151.5
- 27 -
d32 (µm) 38.6 160.8
d43 (µm) 39.6 173.7
Investigation of the Hindered Diffusion Model
To investigate the role of pore clogging we used the experimental conditions of Chen et al. [10], presented in Tables III and IV. The volumeweighted mean particle size, d43, of the adsorbent DEAE Spherodex M is 83 µm. The particle-size distribution was not given in Ref. [10]. The effecttive particle porosity εp was 0.616 and 0.440 for BSA and γ-globulin, respectively. Because the ratio of liquid phase to total volume of liquid and solid phase, εe, was not given, we estimated this value to obtain exact agreement between solution of the stirred-batch adsorption model and the batch kinetic experiments presented in Figs 2 and 3 in Ref. [10]. Table III Values of model terms [10]
Isotherm coefficients Approximation of εe –1 –1 qm (mg mL ) Kd (mg mL ) BSA γ-Globulin BSA C0 (mg mL–1) εe C0 (mg mL–1) εe 0.3 0.995 0.3 0.989 169.5 0.017 0.7 0.995 0.5 0.9901 γ-Globulin 1.2 0.9946 1.0 0.9901 1.6 0.9947 1.3 0.99 87.7 0.5 2.2 0.9919 1.8 0.9884
Table IV Values of pore-diffusivity coefficients [10]
BSA C0 (mg mL ) Dp × 1011 (m2 s–1) 0.3 6.88 0.7 6.57 1.2 5.96 1.6 5.67 2.2 5.10 –1
γ-Globulin C0 (mg mL ) Dp × 1012 (m2 s–1) 0.3 7.60 0.5 6.79 1.0 5.90 1.3 5.09 1.8 4.65 –1
- 28 -
RESULTS AND DISCUSSION Effect of Particle-Pore Clogging on Effective Values of the PoreDiffusivity Coefficient, Dp
To interpret their data Chen et al. [10] assumed a dominant role of pore diffusivity in mass transfer inside adsorbent particles. Fitting of experimental kinetic experiments with the pore diffusion model gave the desired value of Dp. The results obtained by Chen et al. [10] are depicted in Table IV. It is apparent that pore diffusivity decreases with increasing initial concentration C0. Chen et al. [10] ignored the dependence of particle porosity on concentration εp. In this work we re-interpreted their results, assuming that particle porosity is a linear function of the amount of adsorbed species, q:
ε p (q) = ε po − p × q
(13)
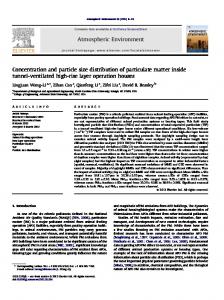
The values of p and the pore-diffusivity coefficient, Dp, were estimated to obtain the best agreement between theoretical uptake curves and experimental curves for C0 = 0.3 and C0 = 2.2 in the BSA experiments and C0 = 0.3 and C0 = 1.8 in the γ-globulin experiments. In the BSA experiments the best fitting terms were Dp = 1.22 × 10⁻¹⁰ m2 s–1 and p = 0.002363 mL mg–1; in the γ-globulin experiments Dp = 9.08 × 10⁻¹² m2 s–1 and p = 0.005 mL mg–1. These values were used to calculate uptake curves for other initial concentrations. Experimental and theoretically simulated data are compared in Figs 1 and 2. Agreement between experimental and theoretical profiles is relatively good. It should be emphasized that this good agreement was obtained for a constant value of pore diffusivity. The estimated value of BSA pore diffusivity is surprisingly high, 1.7 times greater than for the bulk phase (i.e. 6.95 × 10⁻¹¹ m2 s–1 [22]). Chen et al. [10] obtained similar results. To avoid this inconvenience they assumed that surface diffusion plays a significant role in intraparticle mass transfer. The other reason for such large values of Dp might be a consequence of ignoring PSD – see below. It is also possible that overestimation of the diffusivity is connected with incorrect estimation of effective particle radius – a diffusion path available for the particle. It has already been pointed out that the effective particle porosity, εp, was 0.616 and 0.440 for BSA and γ-globulin, respectively [10]. Taking this into account, and remembering that γ-globulin is three times larger than BSA, it seems that large fractions of DEAE particle pores are so narrow they are hardly - 29 -
1.0
Co=1.2
0.8
Co=2.2 C/Co
0.6
0.4
0.2
0.0 0
2
4
6
8
10
12
t [min]
Fig. 1 Experimental (symbols) and simulated (solid lines) uptake curves depicting the effect of changes of particle porosity on the amount of adsorbed BSA. �C0 = 0.3, C0 = 0.7, � C0 = 1.2, C0 = 1.6, C0 = 2.2 mg mL–1. Dp = 1.22 × 10⁻¹⁰ m2 s–1 and p = 0.002363 mL mg–1.
1.0
0.9
C/Co
0.8
0.7
0.6
0.5 0
10
20
30
40
50
t [min]
Fig. 2 Experimental (symbols) and simulated (solid lines) uptake curves depicting the effect of changes of particle porosity on the amount of adsorbed γ-globulin. �C0 = 0.3, C0 = 0.7, � C0 = 1.2, C0 = 1.6, C0 = 2.2 mg mL–1. Dp = 9.08 × 10⁻¹² m2 s–1 and p = 0.005 mL mg–1.
- 30 -
accessible by BSA. Assuming BSA can completely block pores, it can be concluded that the apparent diffusion distance inside the adsorbent is smaller than the particle radius. If this is true, real pore diffusivity is smaller than that evaluated by Chen et al. [10] and by us. Effect of Particle-Size Distribution on Uptake-Curve Profiles
In this section the effect of particle-size distribution on uptake-curve profiles is investigated. This and the next section are only illustrative in character; we did not intend further and more precise interpretation of the data of Chen et al. [10], because they did not report the particle-size distribution of the adsorbent used. To illustrate the discrepancy between the uptake curves calculated for PSD and mean diameters an εe value of 0.995 was assumed. The calculations were performed assuming a constant value of particle porosity εp = 0.616 and Dp = 1.22 × 10⁻¹⁰ cm2 s–1. The Langmuir isotherm terms were qm = 169.5 mg mL–1 and Kd = 0.017 mg mL–1. Plots of simulated uptake curves calculated for the particle-size distribution presented in Table I (symbols) and average diameters d32 and d43 given in Table II (solid lines) are compared in Figs 3 and 4. For small particle diameters the differences 1.0
0.8
Co=2
C/Co
0.6
0.4
Co=1 0.2
Co=0.3
0.0 0
1
2
3
4
t [min]
Fig. 3 Simulated uptake curves for d32 = 38.6 µm and d43 = 39.6 µm – lower and upper of double solid lines. Symbols denote simulated uptake curves calculated for particle-size distribution.
- 31 -
1.0
0.8
Co=2
C/Co
0.6
0.4
Co=1 0.2
Co=0.3 0.0 0
20
40
60
80
100
t [min]
Fig. 4 Simulated uptake curves for d32 = 160.7 µm and d43 = 173.7 µm – lower and upper of double solid lines. Symbols denote simulated uptake curves calculated for particle-size distribution.
between PSD curves and simulations obtained for d32 and d43 are negligible (Fig. 3). For the large particle diameters frequently used in expandedbed adsorption or other types of preparative chromatography, however, these differences are substantial (Fig. 4). From Fig. 4 it follows that for small concentrations the d32 curve is in best agreement with the PSD uptake curve. For higher concentrations and at the beginning of the experiment, however, the PSD curve coincides well with the d32 solid line but afterwards (for C0 = 2 g L–1), rises above the d32 and, next, the d43 curves; then, if the time is large enough, all the curves come back together. From the relationship between PSD d32 and d43 curves it also follows that the apparent pore diffusivity value estimated from PSD uptake curves, for constant average particle size, can decrease with decreasing initial concentration, C0. Assuming that the average particle diameter is d32 and that the points presented in Fig. 4 obtained for PSD are experimental data the best values of pore diffusivity evaluated are: for C0 = 0.3, Dp = 1.19 × 10⁻¹⁰; for C0 = 1, Dp = 1.07 × 10⁻¹⁰; for C0 = 2, Dp = 1.05 × 10⁻¹⁰. Assuming, on the other hand, the average particle diameter is d43 the results obtained are: for C0 = 0.3, Dp = 1.40 × 10⁻¹⁰; for C0 = 1, Dp = 1.24 × 10⁻¹⁰; for C0 = 2, Dp = 1.22 × 10⁻¹⁰.
- 32 -
From Fig. 5 is also follows that it might be impossible to obtain a perfect approximation of the uptake curves for PSD from the uptake curve calculated for average particle diameter. 1.0
C/Co
0.8
0.6
0.4
Co=1 0.2 0
20
40
60
80
100
t [min]
Fig. 5 The best approximation of the PSD uptake curve by use of the d43 curve.
Effect of Particle-Size Distribution on HPLC Peak Profiles
To investigate band profiles under HPLC conditions the data assumed were: column height H = 0.1 m, pore diffusivity Dp = 3.7 × 10⁻¹¹ m2 s–1, external porosity εe = 0.37, particle porosity εp = 0.5, dispersion coefficient DL = 3.3 × 10⁻⁹ m2 s–1, external mass transfer coefficient kext = 4.5 × 10⁻⁴ m s–1, inlet concentration, C0 = 0.5 mg mL–1, injection time tj = 30 s, superficial velocity u = 1.33 × 10⁻³ m s–1. Calculations were performed for the linear, Langmuir, and anti-Langmuir isotherms. q=
a×C 1+ b × C
(14)
The value of a was always 15, and b was 0, 0.05, or –0.05 for linear, Langmuir or anti-Langmuir isotherms, respectively. The average frequency distribution was approximated using data from a plot of accumulated volume against particle diameter (presented in Fig. 4.3 of Ref. [18]) and is given in Table V. The volume-moment mean particle diameter d43 for the frequency distribution obtained is 5.13 µm. The simulations were performed with the general GR model for chromatography columns.
- 33 -
Table V The average frequency used for simulation of HPLC peak profiles. Vi is the volume of fraction i and V is the total volume of particles
d (µm) 2.75 3.05 3.35 3.65 3.95 4.25 4.55 4.85 5.15
Vi/V (%) 0 0.0012 0.0057 0.0262 0.0639 0.1087 0.131 0.138 0.132
d (µm) 5.45 5.75 6.05 6.35 6.65 6.95 7.25 7.55 7.85
Vi/V (%) 0.114 0.093 0.071 0.05 0.032 0.019 0.01 0.004 0.0007
Equation (1a) was replaced by eq. (1b):
εe
(1 - ε ei) × 3kext (C − Cpi (r = Ri )) ∂C ∂C ∂ 2C +u = ε e DL 2 − ∑ Ri ∂t ∂x ∂x i
(1b)
and coupled with the well known Danckwerts boundary conditions. Equation (6) was replaced by eq. (6a):
Dp ε p
∂C = kext (C − Cpi (r = Ri )) ∂r
(6a)
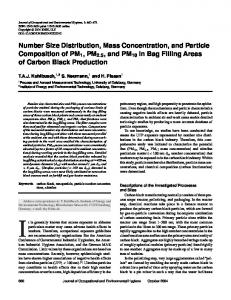
for each particle-diameter fraction. The GR model was solved using the orthogonal collocation on finite element method [4,5,16]. Results from comparison of peak profiles calculated for PSD and d43 mean diameter are presented in Fig. 6. Perfect agreement between band profiles was obtained in each simulation. CONCLUSIONS
In this work it was proved that ignoring changes of particle porosity or particle-size distribution during interpretation of chromatographic data can lead to the conclusion that pore diffusivity depends on species concentration whereas in reality it can be constant. The error in the prediction of uptake curves or peak profiles when PSD is approximated by mean particle diameter decreases when particle diameter is reduced, and for the adsorbent diameters used in HPLC is negligible small. For particle sizes - 34 -
5
b)
4
C [mg/ml]
a) 3
c) 2
1
0
5
6
7
8
9
t [min]
Fig. 6 Comparison of peak profiles calculated for PSD and d43 mean diameter: (a) Langmuir isotherm, (b) linear isotherm, (c) anti-Langmuir isotherm.
typically used in EBA, however, neglecting the PSD lead to misinterpretation of experimental data. The concentration profiles calculated for PSD are located between curves calculated for volume-surface mean diameter d32 and volume-moment mean diameter d43; for higher concentrations, however, profiles are better approximated by d43 mean. In this paper the effect of pore clogging and PSD on uptake-curve profiles was studied separately. The next publication will report more precise analysis in which we couple these two approaches to obtain (we hope) better fitting of the experimental data and better approximation of the pore particle diffusivity. ACKNOWLEDGEMENTS
This work was supported by Grant 4 T09C 006 23 of the Polish State Committee For Scientific Research.
- 35 -
REFERENCES
[1] D.M. Ruthven, Principles of Adsorption and Adsorption Process, Wiley, New York, NY, 1984 [2] M. Suzuki, Adsorption Engineering, Elsevier, Amsterdam, The Netherlands, 1990 [3] A.J. Berninger, R.D. Whitley, X. Zhang, and N.-H.L. Wang, Comput. Chem. Eng., 15, 749 (1991) [4] G. Guiochon, S. Golshan – Shirazi, and A.M. Katti, Fundamentals of Preparative and Nonlinear Chromatography, Academic Press, Boston, MA, 1994 [5] K. Kaczmarski, D. Antos, H. Sajonz, P. Sajonz, and G. Guiochon, J. Chromatogr. A, 925, 1 (2001) [6] G.L. Skidmore, B.J. Horstmann, and H.A. Chase, J. Chromatogr., 498, 113 (1990) [7] B.J. Horstmann and H.A. Chase, Chem. Eng. Res. Des., 67, 243 (1989) [8] A. Cavazzini, K. Kaczmarski, P. Szabelski, D. Zhou, X. Liu, and G. Guiochon, Anal. Chem., 73, 5704 (2001) [9] A.K. Hunter and G. Carta, J. Chromatogr. A, 897, 81 (2000) [10] W.-D. Chen, X.-Y. Dong, and Y. Sun, J. Chromatogr. A, 962, 29 (2002) [11] R. Hughes, Deactivation of Catalysts, Academic Press, New York, 1984 [12] H.S. Fogler, Elements of Chemical Reaction Engineering, Prentice Hall, Englewood Cliffs, New Jersey, 1999 [13] I.A. Liapis, J.J. Meyers, and O.K. Crosser, J. Chromatogr. A, 865, 13 (1999) [14] F. Gritti, W. Piątkowski, and G. Guiochon, J. Chromatogr. A, 983, 51 (2003) [15] W. Piątkowski, F. Gritti, K. Kaczmarski, and G. Guiochon, J. Chromatogr. A, in press [16] V.J. Villadsen and M.L. Michelsen, Solution of Differential Equation Model by Polynomial Approximation, Prentice Hall, Englewood Cliffs, New Jersey, 1978 [17] P.N. Brown, A.C. Hindmarsh, and G.D. Byrne, Variable Coefficient Ordinary Differential Equation Solver, procedure available on http://www.netlib.org
- 36 -
[18] U.D. Neue, HPLC Columns. Theory, Technology, and Practice, Wiley–VCH, 1997 [19] J. Thommes, Fluidized Bed Adsorption as a Primary Recovery Step in Protein Purification, Advances in Biochemical Engineering, Biotechnology, Vol. 58, Springer, 1997 [20] H.G. Brittain, Pharm. Technol., 25, 96 (2001) [21] I. Theodossiou, H. D. Elsner, O.R.T. Thomas, and T.J. Hobley, J. Chromatogr. A, 964, 77 (2002) [22] M.T. Tyn and T.W. Gusek, Biotechnol. Bioeng., 35, 327 (1990)
- 37 -