energies Article
Effect of Sintering Temperature and Applied Load on Anode-Supported Electrodes for SOFC Application Xuan-Vien Nguyen 1, *, Chang-Tsair Chang 2 , Guo-Bin Jung 1 , Shih-Hung Chan 1 , Wilson Chao-Wei Huang 1 , Kai-Jung Hsiao 1 , Win-Tai Lee 3 , Shu-Wei Chang 3 and I-Cheng Kao 3 1
2 3
*
Department of Mechanical Engineering & Fuel Cell Center, Yuan Ze University, Taoyuan 320, Taiwan;
[email protected] (G.-B.J.);
[email protected] (S.-H.C.);
[email protected] (W.C.-W.H.);
[email protected] (K.-J.H.) Taoyuan Aerotropolis Company, Taoyuan 320, Taiwan;
[email protected] Taiwan Power Company, New Taipei City 100, Taiwan;
[email protected] (W.-T.L.);
[email protected] (S.-W.C.);
[email protected] (I-C.K.) Correspondence:
[email protected] or
[email protected]; Tel.: +886-975-470-278
Academic Editor: Masoud Rokni Received: 8 June 2016; Accepted: 11 August 2016; Published: 31 August 2016
Abstract: Anode-supported cells are prepared by a sequence of hot pressing and co-sintering processes for solid oxide fuel cell (SOFC) applications. Commercially available porous anode tape (NiO/YSZ = 50 wt %/50 wt %), anode tape (NiO/YSZ = 30 wt %/70 wt %), and YSZ are used as the anode substrate, anode functional layer, and electrolyte layer, respectively. After hot pressing, the stacked layers are then sintered at different temperatures (1250 ◦ C, 1350 ◦ C, 1400 ◦ C and 1450 ◦ C) for 5 h in air. Different compressive loads are applied during the sintering process. An (La,Sr)MnO3 (LSM) paste is coated on the post-sintered anode-supported electrolyte surface as the cathode, and sintered at different temperatures (1100 ◦ C, 1150 ◦ C, 1200 ◦ C and 1250 ◦ C) for 2 h in air to generate anode-supported cells with dimensions of 60 × 60 mm2 (active reaction area of 50 × 50 mm2 ). SEM is used to investigate the anode structure of the anode-supported cells. In addition, confocal laser scanning microscopy is used to investigate the roughness of the cathode surfaces. At sintering temperatures of 1400 ◦ C and 1450 ◦ C, there is significant grain growth in the anode. Furthermore, the surface of the cathode is smoother at a firing temperature of 1200 ◦ C. It is also found that the optimal compressive load of 1742 Pa led to a flatness of 168 µm/6 cm and a deformation of 0.72%. The open circuit voltage and power density of the anode-supported cell at 750 ◦ C were 1.0 V and 178 mW·cm−2 , respectively. Keywords: pretreatment; anode-supported cell; solid oxide fuel cell (SOFC); impedance spectra; warpage; applied load; roughness; cell shape
1. Introduction In recent years, anode-supported planar solid oxide fuel cells (SOFC) have received much attention, owing to their good power density at intermediate temperatures. The main advantages of power production through these SOFCs are the high conversion efficiency, the absence of combustion, and the fuel flexibility that allows for the use of a variety of fuels (including those derived from renewable sources). An SOFC is normally operated at a high temperature range (600–1000 ◦ C). A multilayer tape casting and co-sintering process has been studied to fabricate large-area anode-supported planar single cells consisting of: (a) an anode substrate (Ni-YSZ), to provide good electrical conductivity and sufficient mechanical strength; (b) an anode functional layer, to improve the electrochemical performance; and (c) an ScSZ electrolyte used in the form of a thin film, to reduce the ohmic resistance at lower temperatures [1]. The traditional electrolytes of SOFCs
Energies 2016, 9, 701; doi:10.3390/en9090701
www.mdpi.com/journal/energies
Energies 2016, 9, 701
2 of 13
exhibit sufficient ionic conductivities above 800 ◦ C [2]. Conventional SOFCs with an yttria-stabilized zirconia (YSZ) electrolyte are now being operated at 900 ◦ C or higher temperatures to attain a power density sufficient for use in the system. However, the high-temperature operation causes serious problems, such as internal mechanical stress, due to the difference in the thermal expansion coefficients of the materials, as well as chemical reactions. Therefore, an operating temperature lower than 700 ◦ C is desirable [3]. Nevertheless, because electrochemical and conduction processes in SOFCs are strongly thermally activated, a reduced operating temperature leads to the problem of large voltage losses, due to the ohmic resistance of the materials and polarization at the electrodes. As most of the voltage losses arise from the ohmic resistance of the electrolyte, a number of approaches have been reported for preparing a thinner electrolyte, reducing the corresponding resistance [4,5] and obtaining a high power density when using YSZ thin-film electrolytes [6,7]. Generally, there are two categories of techniques for making a robust anode–electrolyte–cathode cell while maintaining a thin electrolyte layer: a cathode-supported cell [8,9] and an anode-supported cell [10–12]. However, the high operating temperature is restrictive, calling for expensive materials, long start-up and shut-down times, and high running costs, as well as causing thermal stress. These restrictions have hindered the commercialization of SOFCs [13]. Therefore, lowering the operating temperature of SOFCs has attracted increasing interest in recent years [14]. However, the increased electrolyte resistivity at lower temperatures then becomes the major impediment decreasing the performance of the SOFCs [15]. Anode-supported SOFCs are currently widely studied, with Ni/YSZ cermet being the most popular anode material. Ni/YSZ cermet is thermally suitable with the YSZ electrolyte, even if the processing temperature exceeds 1400 ◦ C, allowing for a flexible manufacturing process [16]. Using molecular dynamics in conjunction with and an established set of Born model potentials, oxygen diffusion in Sr0.75 Y0.25 CoO2.625 was investigated, an activation energy of diffusion for 1.56 eV was predicted in the temperature range from 1000 K to 1400 K [17]. Energetics in the double perovskite PrBaCo2 O5.5 were investigated in the temperature range from 650 ◦ C to 1000 ◦ C. An anisotropic oxygen diffusion mechanism with diffusion occurring predominantly in the Pr-O and Co-O layers was observed. An activation energy of Ea = 0.35 eV was measured for the range of temperatures under study [18]. Conventional SOFC fabrication involves multiple sintering steps; the manufacturing costs of SOFCs could thus be reduced by employing a single-step co-firing technique. A promising technique is the simultaneous fabrication of the electrolyte and supporting anode [19], followed by co-firing together. This could increase the productivity and decrease the fabrication cost. The expensive and complex processing steps for anode-supported electrolyte tapes could be replaced by cheaper, simpler, and continuous techniques. During the co-sintering process, differences in the thermo-elastic materials properties of YSZ and NiO-YSZ cermets that are bonded together will cause the warpage of the anode-supported cell [20,21]. The flatness of the planar unit cell is crucial to the performance of the planar SOFCs, because a flatter cell offers greater contact area between membrane electrode assembly (MEA) surface and the current-collectors [22,23]. Warpage may affect the successful stack operation, which relies on durable contact between the cell electrodes and the interconnect material [24]. Fabricating flat anode-supported cells are very important for successful SOFC stack assembly and commercialization of planar SOFC technology [25,26]. Many studies have focused on investigating and controlling the warpage; experimental methods have been widely conducted to study the phenomenon [27–29]. Single cells with an anode-supported electrolyte are currently fabricated using the tape-casting/lamination/co-firing (TLC) technique. It should be noted, however, that controlling the flatness of large-sized unit cells prepared by the TLC technique is known to be a challenge because of mismatches between the thermo-mechanical and physical properties of the individual layers [30]. The flatness of a cell is considerably dependent on warp phenomena, which can easily occur during the burn-out and sintering processes. Therefore, the interrelationships between the flatness, warping, and cell performance of anode-supported unit cells prepared by the TLC technique require thorough investigations to improve the performance and durability of SOFCs. Using an applied pressure of 1107.4 Pa during the TLC technique improves the flatness to 55 µm/5 cm [22].
Energies 2016, 9, 701
3 of 13
To fabricate planar SOFC unit cells cost-effectively, this study has focused on the following topics: (i) an enhancement in the flatness of anode-supported electrolytes via control of the pressure load during anode-supported electrolyte fabrication; (ii) an evaluation of the effects of flatness and deformation on the anode-supported electrolyte; (iii) an evaluation of the effect of firing temperature on the anode-supported electrolyte via control of the compression and co-firing steps Energies 2016, 9, 701 3 of 13 during anode-supported electrolyte fabrication; and (iv) an evaluation of the effect of firing temperature on the cathode surface via control of the co-firing steps. In this study, the anode-supported cells were load during anode‐supported electrolyte fabrication; (ii) an evaluation of the effects of flatness and deformation on the anode‐supported electrolyte; (iii) an evaluation of the effect of firing temperature homemade designed and fabricated. The anode-supported electrolyte tapes were sintered at 1250 ◦ C, the ◦anode‐supported of the tapes compression and co‐firing steps temperatures during 1350 ◦ C,on 1400 C and 1450 ◦ C electrolyte for 5 h invia air,control and coated were fired at different anode‐supported electrolyte fabrication; and (iv) an evaluation of the effect of firing temperature on ◦ ◦ ◦ ◦ (1100 C, 1150 C, 1200 C and 1250 C) for 2 h in air. An optimal co-sintering temperature of the cathode surface via control of the co‐firing steps. In this study, the anode‐supported cells were ◦ C for the anode-supported electrolyte and a sintering temperature of 1200–1250 ◦ C for the 1400–1450 homemade designed and fabricated. The anode‐supported electrolyte tapes were sintered at 1250 (La,Sr)MnO °C, 1350 °C, 1400 °C and 1450 °C for 5 h in air, and coated tapes were fired at different temperatures 3 -cathode paste are recommended for commercially available anode-electrolyte multilayers (1100 °C, 1150 °C, 1200 °C and 1250 °C) for 2 h in air. An optimal co‐sintering temperature of 1400– for anode-supported SOFCs, in order to achieve acceptable performance. In addition, the effect of 1450 °C for the electrolyte and sintering of 1200–1250 for the of the applied pressure loadsanode‐supported on the warpage behavior ofa cells has temperature been investigated. The°C purpose (La,Sr)MnO3‐cathode paste are recommended for commercially available anode‐electrolyte present work is to provide a better insight into the flatness behavior of the planar anode-supported multilayers for anode‐supported SOFCs, in order to achieve acceptable performance. In addition, the cell in the scaling up process. effect of applied pressure loads on the warpage behavior of cells has been investigated. The purpose of the present work is to provide a better insight into the flatness behavior of the planar 2. Material and Methods anode‐supported cell in the scaling up process.
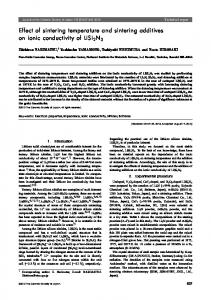
2.1. Cell 2. Material and Methods Fabrication Commercial anode material (42421, NiO/YSZ = 50 wt %/50 wt %, thickness 180 µm; 2.1. Cell Fabrication ESL Electro-Science Co. Ltd., King of Prussia, PA, USA), anode functional layer material Commercial anode material (42421, NiO/YSZ = 50 wt %/50 wt %, thickness 180 μm; ESL (42420, NiO/YSZ = 30 wt %/70 wt %, thickness 20 µm; ESL Electro-Science Co. Ltd., King of Prussia, Electro‐Science Co. Ltd., King of Prussia, PA, USA), anode functional layer material (42420, NiO/YSZ PA, USA), and electrolyte material (42400, 8 mol% YSZ, thickness 18 µm; ESL Electro-Science Co. Ltd., = 30 wt %/70 wt %, thickness 20 μm; ESL Electro‐Science Co. Ltd., King of Prussia, PA, USA), and King of electrolyte Prussia, PA, USA) were8 mol% used YSZ, to fabricate anode-supported electrolyte. A flowchart material (42400, thickness the 18 μm; ESL Electro‐Science Co. Ltd., King of detailingPrussia, PA, USA) were used to fabricate the anode‐supported electrolyte. A flowchart detailing the the manufacturing process for fabricating a single SOFC cell, starting from anode-supported manufacturing process for fabricating a single SOFC cell, starting from anode‐supported electrolyte electrolyte preparation, is shown schematically in Figure 1a. A single SOFC cell was constructed on preparation, is shown schematically in Figure 1a. A single SOFC cell was constructed on a sintered a sintered bi-layer by brush painting a porous layer of cathode paste (LSM: La0.65 Sr0.3 MnO3 ) on the bi‐layer by brush painting a porous layer of cathode paste (LSM: La0.65Sr0.3MnO3) on the YSZ layer, YSZ layer, followed by firing at different temperatures (1100 ◦ C, 1150 ◦ C, 1200 ◦ C and 1250 ◦ C) for 2 h. followed by firing at different temperatures (1100 °C, 1150 °C, 1200 °C and 1250 °C) for 2 h. The The tri-layer thus formed constitutes a single SOFCcell. cell. The structure of anode‐supported the anode-supported tri‐layer thus formed constitutes a single SOFC The structure of the cell is cell is shown inshown in Figure 1b. Figure 1b.
(a)
(b)
1. (a) Flowchart of the manufacturing process process for cell; and and (b) structure of the of the Figure 1.Figure (a) Flowchart of the manufacturing forthe theSOFC SOFC cell; (b) structure anode‐supported cell SOFC. anode-supported cell SOFC.
The anode‐supported cell consists of an anode‐supported layer with a thickness of 540 μm, an
Theanode functional layer with a thickness of 20 μm, an electrolyte layer with a thickness of 18 μm, and anode-supported cell consists of an anode-supported layer with a thickness of 540 µm, an anode functional witha athickness thickness of 20 µm, layer with a thickness of a cathode paste layer layer with ranging from 20 an μm electrolyte to 30 μm. The anode layer, anode
Energies 2016, 9, 701
4 of 13
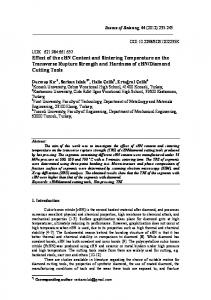
18 µm, and a cathode paste layer with a thickness ranging from 20 µm to 30 µm. The anode layer, anode functional layer, and electrolyte layer were cut to dimensions of 70 mm × 4 of 13 70 mm. Energies 2016, 9, 701 The three kinds of tapes were stacked (electrolyte: top, anode functional layer: middle, anode functional layer, and electrolyte layer were cut to dimensions of 70 mm × 70 mm. The three kinds of layer: bottom) and then compressed via hot-pressing at 230 kg·cm−2 , 75 ◦ C maintained for 20 min. tapes were stacked (electrolyte: top, anode functional layer: middle, anode layer: bottom) and then The anode-supported electrolyte sample was then allowed to cool at room temperature and weighed −2, 75 °C maintained for 20 min. The anode‐supported compressed via deposit hot‐pressing 230 kg∙cm ◦ C, 1400 ◦ C Energies 2016, 9, 701 to determine the yield.at The dried sample was then co-sintered at 1250 ◦ C, 1350 4 of 13 electrolyte sample was then allowed to cool at room temperature and weighed to determine the ◦ and 1450 C for 5 h. functional layer, and electrolyte layer were cut to dimensions of 70 mm × 70 mm. The three kinds of deposit yield. The dried sample was then co‐sintered at 1250 °C, 1350 °C, 1400 °C and 1450 °C for 5 h. tapes were stacked (electrolyte: top, anode functional layer: middle, anode layer: bottom) and then 2.1.1. Heat-Treatment of the Anode-Supported Electrolyte compressed via hot‐pressing at 230 kg∙cm−2, 75 °C maintained for 20 min. The anode‐supported 2.1.1. Heat‐Treatment of the Anode‐Supported Electrolyte electrolyte sample was then allowed tape to cool at room temperature and weighed box. to determine the profiles After hot-pressing, the compressed was placed in an anode-heating The firing After hot‐pressing, the compressed tape was placed in an anode‐heating box. The firing profiles deposit yield. The dried sample was then co‐sintered at 1250 °C, 1350 °C, 1400 °C and 1450 °C for 5 h. are as follows: first, a firing step from 25 ◦ C (room temperature) to 650 ◦ C for 15 h and 30 min are as follows: first, a firing step from 25 °C (room temperature) to 650 °C for 15 h and 30 min with −1 ; second, a firing step from 650 ◦ C to the target with the heating rate controlled at ~0.67 ◦ C·min 2.1.1. Heat‐Treatment of the Anode‐Supported Electrolyte the heating rate controlled at ~0.67 °C∙min−1; second, a firing step from 650 °C to the target ◦ temperature of 1000 C for 4 h with the heating rate controlled at ~1.46 ◦ C−1·min−1 ; third, a firing temperature of 1000 °C for 4 h with the heating rate controlled at ~1.46 °C∙min ; third, a firing step After hot‐pressing, the compressed tape was placed in an anode‐heating box. The firing profiles ◦ C to the target temperature of 1400 ◦ C for 5 h with the heating rate controlled at step from 1000 from 1000 °C to the target temperature of 1400 °C for 5 h with the heating rate controlled at ~1.33 °C∙ ◦ are as follows: first, a firing step from 25 °C (room temperature) to 650 °C for 15 h and 30 min with ~1.33 · min−1 ; fourth, a firing step to maintain the target temperature of 1400 ◦ C for another 1 h and min−1C; fourth, a firing step to maintain the target temperature of 1400 °C for another 1 h and 50 min; the heating rate controlled at ~0.67 °C∙min−1; second, a firing step from 650 °C to the target 50fifth, the firing was decreased from 1400 °C to the target temperature of 700 °C for 4 h; and, finally, min; temperature of 1000 °C for 4 h with the heating rate controlled at ~1.46 °C∙min fifth, the firing was decreased from 1400 ◦ C to the target temperature of 700 ◦ C for 4 h; and, −1; third, a firing step finally, cooling [31,32]. The anode-supported firing steps are shown in Figure 2a. A photograph of the from 1000 °C to the target temperature of 1400 °C for 5 h with the heating rate controlled at ~1.33 °C∙ cooling [31,32]. The anode‐supported firing steps are shown in Figure 2a. A photograph of the final final 60 min mm−1; fourth, a firing step to maintain the target temperature of 1400 °C for another 1 h and 50 min; × 60 mm unit of the 540-µm-thick anode-supported electrolyte is shown in Figure 3a. 60 mm × 60 mm unit of the 540‐μm‐thick anode‐supported electrolyte is shown in Figure 3a. fifth, the firing was decreased from 1400 °C to the target temperature of 700 °C for 4 h; and, finally, cooling [31,32]. The anode‐supported firing steps are shown in Figure 2a. A photograph of the final 60 mm × 60 mm unit of the 540‐μm‐thick anode‐supported electrolyte is shown in Figure 3a.
(a)
(b)
(a)
(b)
Figure 2. Diagram of the firing profiles for heat treatment of (a) the anode‐supported electrolyte and Figure 2. Diagram of the firing profiles for heat treatment of (a) the anode-supported electrolyte and Figure 2. Diagram of the firing profiles for heat treatment of (a) the anode‐supported electrolyte and (b) the printed cathode layer. (b) the printed cathode layer. (b) the printed cathode layer.
(a)
(a)
(b)
(b)
Figure 3. Photograph of the cell unit: (a) the anode‐supported electrolyte substrate (after sintering)
Figure 3. Photograph of the cell unit: (a) the anode-supported electrolyte substrate (after sintering) Figure 3. Photograph of the cell unit: (a) the anode‐supported electrolyte substrate (after sintering) and (b) the SOFC cell unit (after sintering). and (b) the SOFC cell unit (after sintering). and (b) the SOFC cell unit (after sintering). 2.1.2. Heat‐Treatment of the Cathode
2.1.2. Heat‐Treatment of the Cathode 2.1.2. Heat-Treatment of the Following the heat Cathode treatment, (La,Sr)MnO3 (LSM) paste (4420, ESL Electro‐Science Co. Ltd., King of Prussia, PA, USA), which was selected as the cathode material, was printed onto the YSZ Following the heat heat treatment, treatment, (La,Sr)MnO (La,Sr)MnO33 (LSM) Co. Ltd., Following the (LSM) paste paste(4420, (4420,ESL ESLElectro‐Science Electro-Science Co. Ltd., electrolyte pellets with dimensions of 50 mm × 50 mm. These were then fired in a cathode‐heating King of Prussia, PA, USA), which was selected as the cathode material, was printed onto the YSZ King ofbox. The firing profiles in the cathode‐heating box are as follows: first, a firing step from 25 °C (room Prussia, PA, USA), which was selected as the cathode material, was printed onto the YSZ electrolyte pellets with dimensions of 50 mm × 50 mm. These were then fired in a cathode‐heating box. The firing profiles in the cathode‐heating box are as follows: first, a firing step from 25 °C (room
Energies 2016, 9, 701
5 of 13
electrolyte pellets with dimensions of 50 mm × 50 mm. These were then fired in a cathode-heating box. The firing profiles in the cathode-heating box are as follows: first, a firing step from 25 ◦ C (room temperature) to 125 ◦ C for 1 h with the heating rate controlled at ~1.66 ◦ C·min−1 ; second, a firing step to maintain the target temperature of 125 ◦ C for another 20 min; third, a firing step from 125 ◦ C to the target temperature of 1200 ◦ C for 4 h and 30 min with the heating rate controlled at −1 ; fourth, a firing step to maintain the target temperature of 1200 ◦ C for another 2 h; and, ~3.98 ◦ C·min Energies 2016, 9, 701 5 of 13 finally, cooling [31,32]. The firing steps for the printed cathode are shown in Figure 2b. A photograph −1; second, a firing step of the finaltemperature) to 125 °C for 1 h with the heating rate controlled at ~1.66 °C∙min 60 mm × 60 mm unit cell is shown in Figure 3b. to maintain the target temperature of 125 °C for another 20 min; third, a firing step from 125 °C to the
target temperature of 1200 °C for 4 h and 30 min with the heating rate controlled at ~3.98 °C∙min−1; 2.2. Evaluating the Effects of Flatness and Deformation on the Cell fourth, a firing step to maintain the target temperature of 1200 °C for another 2 h; and, finally,
cooling [31,32]. The firing steps for the printed cathode are shown in Figure 2b. A photograph of the The flatness (curvature) of the anode-electrolyte tape was evaluated at seven positions in the final 60 mm × 60 mm unit cell is shown in Figure 3b. longitudinal and lateral directions (as shown in Figure 4a). The flatness (curvature) can be calculated by using Equation (1). Figure 4b further illustrates a method to determine the deformation of the 2.2. Evaluating the Effects of Flatness and Deformation on the Cell anode-electrolyte tape. By using the ratio of the weight of the paper and the anode-supported The flatness (curvature) of the anode‐electrolyte tape was evaluated at seven positions in the electrolytelongitudinal and lateral directions (as shown in Figure 4a). The flatness (curvature) can be calculated tape (after firing), the rate of the deformation effect for the cell can be found using the by using Equation following Equation (2): (1). Figure 4b further illustrates a method to determine the deformation of the anode‐electrolyte tape. By using the ratio of the weight of the paper and the anode‐supported Curvature (flatness) = b − a (1) electrolyte tape (after firing), the rate of the deformation effect for the cell can be found using the is following Equation (2): the height from the flat surface to the top of anode-supported electrolyte substrate,
where b Curvature (flatness) = b – a the thickness of anode-supported electrolyte substrate:
and a is
(1)
where b is the height from the flat surface to the top of anode‐supported electrolyte substrate, and a X+Y+Z+W is the thickness of anode‐supported electrolyte substrate: Ø= × 100%
Ø
Total weight Total weight
100%
(2)
(2)
where Ø is the rate of the deformation effect and X, Y, Z, W are the deformation angles on the four sides of the cell. where Ø is the rate of the deformation effect and X, Y, Z, W are the deformation angles on the four The deformation angles on the four sides of the cell were determined based on equivalent sides of the cell. The deformation angles on the four sides of the cell were determined based on paper area;equivalent paper area; and the total weight of the paper is 303 mg. and the total weight of the paper is 303 mg.
(a)
(b) Figure 4. Schematics for the investigation: (a) the flatness of the anode‐electrolyte tape; and (b) the
Figure 4. Schematics for the investigation: (a) the flatness of the anode-electrolyte tape; and (b) the deformation of the anode‐electrolyte tape. deformation of the anode-electrolyte tape. 2.3. Surface Roughness and Microstructural Characterization
2.3. Surface Roughness and Microstructural Characterization The morphology of the anode and cathode surfaces was studied by means of a scanning electron microscope (SEM; JSM‐5600, Jeol Co., Akishima, Tokyo, Japan) equipped with an energy‐dispersive
The morphology of the anode and cathode surfaces was studied by means of a scanning electron microscope (SEM; JSM-5600, Jeol Co., Akishima, Tokyo, Japan) equipped with an energy-dispersive
Energies 2016, 9, 701
6 of 13
spectroscope. The anode surface was coated with gold powder under vacuum. The roughness of the cathode surface was investigated using confocal laser scanning microscopy (CLSM; 6 of 13 VK-9710, Energies 2016, 9, 701 Keyence Co., Suite 210, Itasca, IL, USA). spectroscope. The anode surface was coated with gold powder under vacuum. The roughness of the
2.4. Cell Testingsurface was investigated using confocal laser scanning microscopy (CLSM; VK‐9710, cathode Keyence Co., Suite 210, Itasca, IL, USA).
The test station (TEI-S600-NNNNNS, Tension Energy Inc., Hsin Chu City, Taiwan) was used testing the cell performance. In order to achieve sufficient electrical contact between the cell and the 2.4. Cell Testing electronic devices, a Ni mesh was used on the anode side and an Ag mesh was used on the cathode side. The test station (TEI‐S600‐NNNNNS, Tension Energy Inc., Hsin Chu City, Taiwan) was used Two platinum wires were connected to each mesh to serve as the respective voltage and current probes. testing the cell performance. In order to achieve sufficient electrical contact between the cell and the The cell performance of the anode-supported single cells was tested at 650 ◦ C, 700 ◦ C and 750 ◦ C, electronic devices, a Ni mesh was used on the anode side and an Ag mesh was used on the cathode according theplatinum following procedure. The temperature wasto first slowly increased tovoltage 750 ◦ C and for 15 h side. to Two wires were connected to each mesh serve as the respective anodecurrent probes. The cell performance of the anode‐supported single cells was tested at 650 °C, 700 °C pretreatment. The system was first fed with mixed gases of nitrogen and 5 vol. % of hydrogen on anodeand 750 °C, according to the following procedure. The temperature was first slowly increased to 750 side and air on cathode side as anode pretreatment. The flow rate of nitrogen and hydrogen were °C for 15 h anode pretreatment. The system was first fed with mixed gases of nitrogen and 5 vol.% of 200 mL ·min−1 , and 20 mL·min−1 , respectively. The flow rate of air was 250 mL·min−1 . After reaching hydrogen on anode side and air on cathode side as anode pretreatment. The flow rate of nitrogen this temperature, the fuel flow of humidified hydrogen was 300 mL·min−1 (with 3% H2 O) on the −1 and 20 mL∙min −1, respectively. The flow rate of air was 250 hydrogen were 200 ofmL∙min anodeand side, while the flow air was, 500 mL·min−1 on the cathode side. All electrochemical data −1 −1 mL∙min . After reaching this temperature, the fuel flow of humidified hydrogen was 300 mL∙min obtained after the pretreatment were acquired by direct current methods using a current-control power −1 (with 3% H2O) on the anode side, while the flow of air was 500 mL∙min on the cathode side. All supply and a computer-controlled data acquisition system. electrochemical data obtained after the pretreatment were acquired by direct current methods using a current‐control power supply and a computer‐controlled data acquisition system. 3. Results and Discussion 3. Results and Discussion 3.1. Effect of Applied Loads on the Flatness and Deformation of the Anode-Supported Electrolyte 3.1. Effect of Applied Loads on the Flatness and Deformation of the Anode‐Supported Electrolyte The anode-electrolyte tape was fabricated and fired at 1400 ◦ C, with an anode layer thickness of 540 µm. Various applied loads were placed on the sample to evaluate the dependence of the The anode‐electrolyte tape was fabricated and fired at 1400 °C, with an anode layer thickness of flatness on the applied load. As shown in Figure 5, when applied loads of 0 g·cm−2 , 14 g·cm−2 , 540 μm. Various applied loads were placed on the sample to evaluate the dependence of the flatness −2 and 22 g·cm−2 were placed, the flatness of the anode-electrolyte −2, 14 g∙cm −2 and 22 18 g·cm tape−2, 18 g∙cm was 2969 µm/6 cm, on the applied load. As shown in Figure 5, when applied loads of 0 g∙cm − 2 −2 g∙cm cm, were placed, the flatness of the anode‐electrolyte tape was 2969 μm/6 cm, 619 μm/6 cm, 168 619 µm/6 168 µm/6 cm and 160 µm/6 cm, respectively. While the 18 g·cm applied load −2 applied load improved the flatness to μm/6 cm and 160 μm/6 cm, respectively. While the 18 g∙cm improved the flatness to 168 µm/6 cm, the 22 g·cm−2 applied load was better, achieving a flatness of −2 168 μm/6 cm, the 22 g∙cm applied load was better, achieving a flatness of 160 μm/6 cm. However, − 2 160 µm/6 cm. However, the 22 g·cm applied load caused more deformation (as shown in Figure 6d) the 22 g∙cm−2 applied load caused more deformation (as shown in Figure 6d) than the 18 g∙cm−2 than the 18 g·cm−2 applied load. The curvature of the anode-supported electrolyte substrate with applied load. The curvature of the anode‐supported electrolyte substrate with applied loads of 0 applied loads of 0 g·cm−2 , 14 g·cm−2 , 18 g·cm−2 and 22 g·cm−2 is shown in Figure 6. The curve of the g∙cm−2, 14 g∙cm−2, 18 g∙cm−2 and 22 g∙cm−2 is shown in Figure 6. The curve of the anode‐supported −2 is the most pronounced, and the sample warps anode-supported electrolyte with g·cmpronounced, electrolyte substrate with substrate 0 g∙cm−2 is the 0most and the sample warps continuously − 2 −2 and 22 g·cm−2 , and the continuously down with 14 g·cm . The sample quickly flattens at 18 g·cm −2. The sample quickly flattens at 18 g∙cm −2 and 22 g∙cm −2, and the shape does not down with 14 g∙cm −2 applied load, shapechange at 18 g∙cm does not change−2at 18 g·cm−2 . In contrast, the shape of the sample changes with the 22 g·cm−2 . In contrast, the shape of the sample changes with the 22 g∙cm deforming along each of the four angles. applied load, deforming along each of the four angles.
(a)
(b) Figure 5. Cont.
Energies 2016, 9, 701 Energies 2016, 9, 701 Energies 2016, 9, 701
7 of 13 77 of 13 of 13
Energies 2016, 9, 701
7 of 13
(c)
(d)
(c) (c)
(d) (d)
Figure 5. The effect of applied loads on the flatness of the anode‐supported electrolyte: (a) 0 g∙cm−2; −2 Figure 5. The effect of applied loads on the flatness of the anode-supported electrolyte: (a) 0 g·cm −2 ; Figure 5. The effect of applied loads on the flatness of the anode‐supported electrolyte: (a) 0 g∙cm −2; −2; (c) 18 g∙cm−2; and (d) 22 g∙cm−2. Figure 5. The effect of applied loads on the flatness of the anode‐supported electrolyte: (a) 0 g∙cm ; (b) 14 g∙cm −2 −2 −2
−2 −2 (b) 14 g·cm−2 ; (c) 18 g·cm ; and (d) 22 g·cm (b) 14 g∙cm ; (c) 18 g∙cm−2; and (d) 22 g∙cm ; and (d) 22 g∙cm−2. . (b) 14 g∙cm−2; (c) 18 g∙cm
.
Figure 6. The flatness and deformation of the anode‐electrolyte tape with different applied loads.
As shown in Figure 7, the effect of the applied loads on the deformation of the anode‐supported Figure 6. The flatness and deformation of the anode‐electrolyte tape with different applied loads. Figure 6. The flatness and deformation of the anode-electrolyte tape with different applied loads. Figure 6. The flatness and deformation of the anode‐electrolyte tape with different applied loads. −2, 18 g∙cm−2, and 22 g∙cm−2, the electrolyte is calculated by Equation (2). With applied loads of 14 g∙cm deformations of the anode‐electrolyte tape are 6.85% (X = 1.6 mg, Y = 9.75 mg, Z = 8.5 mg, W = 0.9 As shown in Figure 7, the effect of the applied loads on the deformation of the anode‐supported As shown in Figure 7, the effect of the applied loads on the deformation of the anode‐supported As shown in Figure 7, the effect of the applied loads on the deformation of the anode-supported mg), 0.72% (X = 1.0 mg, Y = 0.8 mg, Z = 0.4 mg), and 3.16% (X = 2.2 mg, Y = 2.9 mg, Z = 3.2 mg, W = 1.3 −2 −2, and 22 g∙cm−2, the electrolyte is calculated by Equation (2). With applied loads of 14 g∙cm 2 , 18 g·cm −2 , and 22 g·cm −2 , −2, and 22 g∙cm −2, the electrolyte is calculated by Equation (2). With applied loads of 14 g∙cm , 18 g∙cm mg), respectively. electrolyte is calculated by Equation (2). With applied loads of 14 g·cm−2−, 18 g∙cm
deformations of the anode‐electrolyte tape are 6.85% (X = 1.6 mg, Y = 9.75 mg, Z = 8.5 mg, W = 0.9 deformations of the anode‐electrolyte tape are 6.85% (X = 1.6 mg, Y = 9.75 mg, Z = 8.5 mg, W = 0.9 the deformations of the anode-electrolyte tape are 6.85% (X = 1.6 mg, Y = 9.75 mg, Z = 8.5 mg, mg), 0.72% (X = 1.0 mg, Y = 0.8 mg, Z = 0.4 mg), and 3.16% (X = 2.2 mg, Y = 2.9 mg, Z = 3.2 mg, W = 1.3 mg), 0.72% (X = 1.0 mg, Y = 0.8 mg, Z = 0.4 mg), and 3.16% (X = 2.2 mg, Y = 2.9 mg, Z = 3.2 mg, W = 1.3 W = 0.9 mg), 0.72% (X = 1.0 mg, Y = 0.8 mg, Z = 0.4 mg), and 3.16% (X = 2.2 mg, Y = 2.9 mg, Z = 3.2 mg, mg), respectively. mg), respectively. W = 1.3 mg), respectively.
Figure 7. The effect of the applied loads on the deformation of the anode‐supported electrolyte substrate.
Figure 7. The effect of the applied loads on the deformation of the anode‐supported electrolyte substrate. Figure 7. The effect of the applied loads on the deformation of the anode‐supported electrolyte substrate. Figure 7. The effect of the applied loads on the deformation of the anode-supported electrolyte substrate.
Energies 2016, 9, 701
8 of 13
Energies 2016, 9, 701
8 of 13
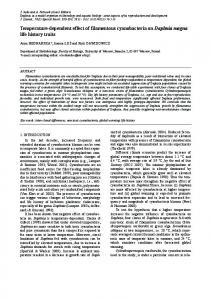
3.2. Effect of Co-Sintering Temperature on the Microstructural Properties 3.2. Effect of Co‐Sintering Temperature on the Microstructural Properties Figure 10,000), Figure 88 shows shows aa series series of of SEM SEM photographs photographs taken taken at at the the same same magnification magnification (× (×10,000), depicting typical areas of the microstructure of each of the samples used in the performance depicting typical areas of the microstructure of each of the samples used in the performance measurements. As observed in Figure 8, the grain size of the anode side sintered at a temperature measurements. As observed in Figure 8, the grain size of the anode side sintered at a temperature of ◦ C is quite small. As the sintering temperature is increased to 1350 ◦ C and 1400 ◦ C, there is of 1250 1250 °C is quite small. As the sintering temperature is increased to 1350 °C and 1400 °C, there is significant grain growth. The grains do not undergo further growth as the co-sintering temperature is significant grain growth. The grains do not undergo further growth as the co‐sintering temperature further increased to 1450 ◦ C; however, the presence of several small particles indicates significant local is further increased to 1450 °C; however, the presence of several small particles indicates significant agglomeration. The agglomerated particles can be can attributed to Ni, which is thermally activated local agglomeration. The agglomerated particles be attributed to Ni, which is thermally ◦ C. The resulting to move freely, especially under a co-sintering temperature higher than 1450 activated to move freely, especially under a co‐sintering temperature higher than 1450 °C. The agglomerated Ni leads to insufficient surface area for electrochemical reactions to achieve a high resulting agglomerated Ni leads to insufficient surface area for electrochemical reactions to achieve a current output. Therefore, the optimal co-firing temperature of anode-electrolyte bilayers bilayers is 1400 ◦ C. high current output. Therefore, the optimal co‐firing temperature of anode‐electrolyte is ◦ C, the particle connection of the electrode improved In addition, the electrode fired at optimal 1400at 1400 °C. In for addition, for the electrode fired optimal 1400 °C, the particle connection of the noticeably, while the grain size increased only slightly. Poor connection between electrode particles electrode improved noticeably, while the grain size increased only slightly. Poor connection between and/or poor physical contact between the electrolyte andthe electrode layers may hinder layers the charge electrode particles and/or poor physical contact between electrolyte and electrode may transfer from particle to particle in the electrode, and/or from the electrode to the electrolyte. Figure 9 hinder the charge transfer from particle to particle in the electrode, and/or from the electrode to the shows morphological examinations of the cathode interface at temperatures of 1100 ◦ C, 1150 ◦ C, electrolyte. Figure 9 shows morphological examinations of the cathode interface at temperatures of ◦ C and 1250 ◦ C. As shown in the figure, the grain size at 1200 ◦ C and 1250 ◦ C rapidly increased 1200 1100 °C, 1150 °C, 1200 °C and 1250 °C. As shown in the figure, the grain size at 1200 °C and 1250 °C ◦ C. It was found that the grain size and degree of agglomeration compared to that atcompared 1100 ◦ C and rapidly increased to 1150 that at 1100 °C and 1150 °C. It was found that the grain size and of the powders both increase with the sintering temperature. In particular, the cathode fired at 1200 ◦ C, degree of agglomeration of the powders both increase with the sintering temperature. In particular, the particle connection of the electrode improved noticeably, while the grain size is suitable in particle the cathode fired at 1200 °C, the particle connection of the electrode improved noticeably, while the connection. If the firing temperature is further increased to 1250 ◦ C, the particle agglomerated largely, grain size is suitable in particle connection. If the firing temperature is further increased to 1250 °C, which will lead to lower surface area and is thus unfavorable for oxygen reduction reaction. Therefore, the particle agglomerated largely, which will lead to lower surface area and is thus unfavorable for the optimal firing temperature of cathode bilayers is 1200 ◦ C. oxygen reduction reaction. Therefore, the optimal firing temperature of cathode bilayers is 1200 °C.
(a)
(b)
(c)
(d)
Figure 8. 8. Series the anode-electrolyte anode‐electrolyte samples samples with with various various sintering sintering Figure Series of of SEM SEM photographs photographs of of the temperatures: (a) 1250 °C; (b) 1350 °C; (c) 1400 °C; and (d) 1450 °C. ◦ ◦ ◦ ◦ temperatures: (a) 1250 C; (b) 1350 C; (c) 1400 C; and (d) 1450 C.
Energies 2016, 9, 701
9 of 13
Energies 2016, 9, 701
9 of 13
Energies 2016, 9, 701
9 of 13
(a)
(b)
(a)
(b)
(c) (d) (c) (d) Figure 9. Series of SEM photographs of the cathode interface with various sintering temperatures:
Figure 9. Series of SEM photographs of the cathode interface with various sintering temperatures: (a) 1100 °C; (b) 1150 °C; (c) 1200 °C; and (d) 1250 °C. Figure 9. Series of SEM photographs of the cathode interface with various sintering temperatures: (a) 1100 ◦ C; (b) 1150 ◦ C; (c) 1200 ◦ C; and (d) 1250 ◦ C. (a) 1100 °C; (b) 1150 °C; (c) 1200 °C; and (d) 1250 °C.
3.3. Surface Roughness 3.3. Surface Roughness 3.3. Surface Roughness Figure 10 shows CLSM images of the cathode surface after firing for the fabrication of SOFC Figure 10 shows CLSM images of the cathode surface after firing for the fabrication of SOFC single Figure 10 shows CLSM images of the cathode surface after firing for the fabrication of SOFC single cells. As shown in Figure 10, the surface of the cathode was quite rough after firing at cells. As shown in shown Figure 10, the surface of the cathode was quite rough after rough firing at temperatures single cells. As in Figure 10, the surface of the cathode was quite after firing at temperatures of 1100 °C and 1150 °C with a surface roughness of 102.5 μm and 96.5 μm, respectively. ◦ ◦ C with a surface roughness of 102.5 µm and 96.5 µm, respectively. As the of 1100 C and 1150 temperatures of 1100 °C and 1150 °C with a surface roughness of 102.5 μm and 96.5 μm, respectively. As the firing temperature was increased to 1200 °C, the cathode surface became quite smooth, with a firing temperature was increased to 1200 ◦ C, the cathode surface became quite smooth, with a surface As the firing temperature was increased to 1200 °C, the cathode surface became quite smooth, with a surface roughness of 79 μm. However, as the firing temperature was increased to 1250 °C, the roughness of 79 µm. However, the firing was increased 1250 ◦ C,to the cathode had surface roughness of 79 μm. as However, as temperature the firing temperature was to increased 1250 °C, the cathode had a surface roughness of 82 μm. Moreover, the firing temperature also affected the a surface roughness of 82 µm. Moreover, the firing temperature also affected the deformation of the cathode had a surface roughness of 82 μm. Moreover, the firing temperature also affected the deformation of the cathode surface. cathode surface. deformation of the cathode surface.
(a)(a)
(b) (b) Figure 10. Cont.
Energies 2016, 9, 701
10 of 13
Energies 2016, 9, 701
10 of 13
Energies 2016, 9, 701
10 of 13
(c)
(d)
(c) (d) Figure 10. Series of CLSM photographs of the cathode surface with various sintering temperatures: Figure 10. Series of CLSM photographs of the cathode surface with various sintering temperatures: (a) 1100 °C; (b) 1150 °C; (c) 1200 °C; and (d) 1250 °C. (a) Figure 10. Series of CLSM photographs of the cathode surface with various sintering temperatures: 1100 ◦ C; (b) 1150 ◦ C; (c) 1200 ◦ C; and (d) 1250 ◦ C. (a) 1100 °C; (b) 1150 °C; (c) 1200 °C; and (d) 1250 °C. 3.4. X‐ray Diffraction Pattern 3.4. X-ray Diffraction Pattern 3.4. X‐ray Diffraction Pattern X‐ray diffraction (XRD), a non‐destructive analytical technique, was used to analyze the crystal X-ray diffraction (XRD), a non-destructive analytical technique, was used to analyze the crystal structure, chemical composition, and physical properties of the cathode layer. Figure 11 shows the X‐ray diffraction (XRD), a non‐destructive analytical technique, was used to analyze the crystal structure, chemical composition, and physical properties of the cathode layer. Figure 11 shows the XRD patterns of the cathode‐LSM layer after firing at 1100 °C, 1150 °C, 1200 °C and 1250 °C for 2 h. structure, chemical composition, and physical properties of the cathode layer. Figure 11 shows the ◦ C, 1200 ◦ C and 1250 ◦ C for 2 h. XRD of the the figure, cathode-LSM layer after firing 1100 ◦ C, 1150 As patterns shown in the XRD patterns of the at cathode‐LSM layer after firing at 1100 °C and XRD patterns of the cathode‐LSM layer after firing at 1100 °C, 1150 °C, 1200 °C and 1250 °C for 2 h. ◦ C and 1150 ◦ C As As shown in the figure, the XRD patterns of the cathode-LSM layer after firing at 1100 1150 °C are quite similar. Likewise, the XRD pattern of the cathode‐LSM layer after firing at 1200 °C shown in the figure, the XRD patterns of the cathode‐LSM layer after firing at 1100 °C and are1150 °C are quite similar. Likewise, the XRD pattern of the cathode‐LSM layer after firing at 1200 °C quite similar. Likewise, the XRD pattern of the cathode-LSM layer after firing at 1200 ◦ C is quite is quite similar to that at 1250 °C. In addition, diffraction peaks at approximately 28.7°, 47.6°, and ◦ , and 56.4◦ can similar that 1250 ◦ C. The In addition, diffraction at approximately 28.7◦ , the 47.6non‐crystalline 56.4° to can be atobserved. broad peak at a 2θ peaks value of around 30° indicates is quite similar to that at 1250 °C. In addition, diffraction peaks at approximately 28.7°, 47.6°, and ◦ be 56.4° observed. The broad peak at a 2θpeak value around indicates the non-crystalline structure or structure or amorphous nature of the composition present in the mixture. The main peaks became can be observed. The broad at of a 2θ value 30 of around 30° indicates the non‐crystalline sharper at lower temperatures, indicating some grain growth. amorphous nature of the composition present in the mixture. The main peaks became sharper at lower structure or amorphous nature of the composition present in the mixture. The main peaks became temperatures, indicating some grain growth. sharper at lower temperatures, indicating some grain growth.
Figure 11. XRD patterns of the LSM cathode, with respect to the firing temperature. Figure 11. XRD patterns of the LSM cathode, with respect to the firing temperature. Figure 11. XRD patterns of the LSM cathode, with respect to the firing temperature.
Energies 2016, 9, 701 Energies 2016, 9, 701
11 of 13 11 of 13
3.5. Cell Performance 3.5. Cell Performance Cells were fabricated from anode electrolyte tapes produced with the optimal firing temperature Cells were fabricated from anode electrolyte tapes produced with the optimal firing temperature of ◦ C and of 1400 °C and a compressive 1742 Pa, together with a produced cathode with produced a firing 1400 a compressive load ofload 1742of Pa, together with a cathode a firingwith temperature 2 (an active reaction area of 50 × ◦ 2 temperature of 1200 °C. A typical cell with dimensions of 60 × 60 mm of 1200 C. A typical cell with dimensions of 60 × 60 mm (an active reaction area of 50 × 50 mm2 ) 2) was used as the standard cell to test the power density. The open circuit voltage (OCV) and 50 mm was used as the standard cell to test the power density. The open circuit voltage (OCV) and power power density of the single cell at operating temperatures of 650 °C, 700 °C and 750 °C are shown in density of the single cell at operating temperatures of 650 ◦ C, 700 ◦ C and 750 ◦ C are shown in Figure 12. Figure 12. The open‐circuit voltages cell 1.0 V, and power the maximum The open-circuit voltages (OCV) of the(OCV) single of cellthe aresingle around 1.0are around V, and the maximum densities −2 −2 − 2 − 2 ◦ ◦ power densities of the cell are 105 mW∙cm at 650 °C and 700 °C, respectively. The of the cell are 105 mW·cm and 135 mW· and 135 mW∙cm cm at 650 C and 700 C, respectively. The maximum maximum power density of the cell are 178 mW∙cm at a voltage of 0.506 V and a total output power power density of the cell are 178 mW·cm−2 at a −2 voltage of 0.506 V and a total output power of ◦ of about 4.45 W at 750 °C. It can be seen that the power density of the homemade cell is far below the about 4.45 W at 750 C. It can be seen that the power density of the homemade cell is far below the state‐of‐the‐art in SOFC technology, possibly due to inconsistent cells fabricated manually in the lab. state-of-the-art in SOFC technology, possibly due to inconsistent cells fabricated manually in the lab. Actually, the cell performance depends on the cell fabrication skill. Currently, we use commercial Actually, the cell performance depends on the cell fabrication skill. Currently, we use commercial materials to manually manufacture the cells as such in order to yield consistent cells is a challenge. materials to manually manufacture the cells as such in order to yield consistent cells is a challenge. Nevertheless, the present study shows the effects of sintering temperature and compressive loads on Nevertheless, the present study shows the effects of sintering temperature and compressive loads on electrodes (flatness, deformation, roughness). Furthermore, the study also shows several methods to electrodes (flatness, deformation, roughness). Furthermore, the study also shows several methods to investigate and improve electrodes (MEA). investigate and improve electrodes (MEA).
Figure 12. The I–V and I–P curves of the cell. Figure 12. The I–V and I–P curves of the cell.
4. Conclusions 4. Conclusions The flatness ofof a a unit is critical to performance the performance of planar as cell a flatter cell The flatness unit cellcell is critical to the of planar SOFCs, SOFCs, as a flatter decreases decreases fuel leakage from chamber the anode to the cathode chamber and also the fuel leakage from the anode tochamber the cathode chamber and also increases theincreases contact area contact area of the current collectors. Severely warped specimens cannot be applied to planar SOFC of the current collectors. Severely warped specimens cannot be applied to planar SOFC systems. systems. There is thus a need to develop a specific technique for improving the flatness of large unit There is thus a need to develop a specific technique for improving the flatness of large unit cells during cells during heat treatment. In this paper, varying applied loads were applied to anode‐supported heat treatment. In this paper, varying applied loads were applied to anode-supported electrolytes electrolytes to evaluate how the flatness of a sample depends on the pressure. In particular, it was to evaluate how the flatness of a sample depends on the pressure. In particular, it was found that −2 improved the flatness to 168 μm/6 cm. found that an applied load of 18 g∙cm an applied load of 18 g·cm−2 improved the flatness to 168 µm/6 cm. In addition, the co‐sintering temperature was demonstrated to have a pronounced effect on the In addition, the co-sintering temperature was demonstrated to have a pronounced effect on fabrication and characteristics of an anode‐supported electrolyte. At a co‐sintering temperature of as the fabrication and characteristics of an anode-supported electrolyte. At a co-sintering temperature low as 1250 °C, the electrolyte was unable to sinter fully, forming a porous structure that led to a of as low as 1250 ◦ C, the electrolyte was unable to sinter fully, forming a porous structure that led reduced open‐circuit potential and poor cell performance, along along with a low acurrent output. At a to a reduced open-circuit potential and poor cell performance, with low current output. ◦ co‐sintering temperature higher than 1450 °C, the cells were decayed, particularly under high At a co-sintering temperature higher than 1450 C, the cells were decayed, particularly under high current over‐agglomeration of the anode anode structure. structure. Based current density density operation, operation, due due to to over-agglomeration of the Based on on scanning scanning electron microscopy, confocal laser scanning microscopy, and X‐ray diffraction data, an electron microscopy, confocal laser scanning microscopy, and X-ray diffraction data, an optimal optimal ◦ C for co‐sintering co-sintering temperature temperature of of 1400–1450 1400–1450 °C for the the anode‐supported anode-supported electrolyte electrolyte and and a a sintering sintering temperature of 1200–1250 °C for the (La,Sr)MnO temperature of 1200–1250 ◦ C for the (La,Sr)MnO33‐cathode paste are recommended for commercially -cathode paste are recommended for commercially available anode‐electrolyte multilayers for anode‐supported SOFCs, in order to achieve acceptable available anode-electrolyte multilayers for anode-supported SOFCs, in order to achieve acceptable performance. In addition, a single cell made of a 5 cm × 5 cm unit cell in an active area based on the above conditions was tested. The performance of the anode‐supported single cell is around 1.0 V.
Energies 2016, 9, 701
12 of 13
performance. In addition, a single cell made of a 5 cm × 5 cm unit cell in an active area based on the above conditions was tested. The performance of the anode-supported single cell is around 1.0 V. The maximum power density of the cell is 178 mW·cm−2 at a voltage of 0.506 V, and its total output power at 750 ◦ C is about 4.45 W. The power density of the homemade cell is far below the state-of-the-art in SOFC technology, possibly due to inconsistent cells fabricated manually in the lab. Actually, the cell performance depends on the cell fabrication skill. In addition, the OCV values of the anode-supported SOFC in humidified H2 less than 1.0 V. They were a little lower than the theoretical values predicted by the Nernst Equation, further indicating that the YSZ membrane was dense, as any leakage in the electrolyte membrane would lead to severely lowering of the OCV values. The lower OCV values may relate to gas leakage at the seals. With this feasibility study, in future work, we believe that it is essential for the SOFC community to use commercially available materials instead of materials developed by individual groups, in order to speed up the research and development of anode-supported SOFC technology. Acknowledgments: The authors gratefully thank the National Science Council (NSC) of Taiwan under contracts NSC 99-2221-E-155-063 and NSC 100-3113-E-155-001, and the Taiwan Power Company for their financial support. Author Contributions: Xuan-Vien Nguyen proposed the research, implemented all experiments, wrote and revised the paper. Chang-Tsair Chang, Guo-Bin Jung, Shih-Hung Chan supervised the research. Wilson Chao-Wei Huang, Kai-Jung Hsiao prepared the figures. Win-Tai Lee, Shu-Wei Chang, I-Cheng Kao provided the materials. Conflicts of Interest: The authors declare no conflict of interest.
Abbreviations SOFC SEM CLSM XRD
Solid oxide fuel cell Scanning electron microscopy Confocal laser scanning microscopy X-ray diffraction
References 1. 2. 3. 4. 5. 6. 7. 8. 9.
10. 11. 12.
Wang, Z.; Qian, J.; Cao, L.; Wang, S.; Wen, T. A study of multilayer tape casting method for anode-supported planar type solid oxide fuel cells (SOFCs). J. Alloys Compd. 2007, 437, 264–268. [CrossRef] Haile, S.M. Fuel cell materials and components. Acta Mater. 2003, 51, 5981–6000. [CrossRef] Jung, G.B.; Lo, K.F.; Chan, S.H. Effect of pretreatments on the anode structure of solid oxide fuel cells. J. Solid State Electrochem. 2007, 11, 1435–1440. [CrossRef] Minh, N.Q. Ceramic fuel cells. J. Am. Ceram. Soc. 1993, 76, 563–588. [CrossRef] Chen, C.C.; Nasrallah, M.M.; Anderson, H.U. Synthesis and characterization of YSZ thin film electrolytes. Solid State Ion. 1994, 70, 101–108. [CrossRef] Souza, S.D.; Visco, S.J.; Jonghe, L.C.D. Thin-film solid oxide fuel cell with high performance at low-temperature. Solid State Ion. 1997, 98, 57–61. [CrossRef] Kim, J.W.; Virkar, A.V.; Fung, K.Z.; Mehta, K.; Singhal, S.C. Polarization effects in intermediate temperature, anode-supported solid oxide fuel cells. J. Electrochem. Soc. 1999, 146, 69–78. [CrossRef] Lee, H.Y.; Oh, S.M. Origin of cathodic degradation and new phase formation at the La0.9 SrO0.1 MnO3 /YSZ interface. Solid State Ion. 1996, 90, 133–140. [CrossRef] Liu, Y.; Hashimoto, S.; Nishino, H.; Takei, K.; Mori, M. Fabrication and characterization of a co-fired La0.6 Sr0.4 Co0.2 Fe0.8 O3-δ cathode-supported Ce0.9 Gd0.1 O1.95 thin-film for IT-SOFCs. J. Power Sources 2007, 164, 56–64. [CrossRef] Bao, W.; Chang, Q.; Meng, G. Effect of NiO/YSZ compositions on the co-sintering process of anode-supported fuel cell. J. Membr. Sci. 2005, 259, 103–109. [CrossRef] Besra, L.; Zha, S.; Liu, M. Preparation of NiO-YSZ/YSZ bi-layers for solid oxide fuel cells by electrophoretic deposition. J. Power Sources 2006, 160, 207–214. [CrossRef] Leng, Y.J.; Chan, S.H.; Khor, K.A.; Jiang, S.P. Performance evaluation of anode-supported solid oxide fuel cells with thin film YSZ electrolyte. Int. J. Hydrog. Energy 2004, 29, 1025–1033. [CrossRef]
Energies 2016, 9, 701
13. 14. 15.
16. 17. 18. 19. 20. 21. 22.
23. 24. 25. 26. 27. 28.
29. 30. 31. 32.
13 of 13
Fabbri, E.; Pergolesi, D.; Traversa, E. Materials challenges toward proton-conducting oxide fuel cells: A critical review. Chem. Soc. Rev. 2010, 39, 4355–4369. [CrossRef] [PubMed] Wachsman, E.D.; Lee, K.T. Lowering the temperature of solid oxide fuel cells. Science 2011, 334, 935–939. [CrossRef] [PubMed] Chroneos, A.; Yildiz, B.; Tarancon, A.; Parfitt, D.; Kilner, J.A. Oxygen diffusion in solid oxide fuel cell cathode and electrolyte materials: Mechanistic insights from atomistic simulations. Energy Environ. Sci. 2011, 4, 2774–2789. [CrossRef] De Jonghe, L.C.; Jacobson, C.P.; Visco, S.J. Supported electrolyte thin film synthesis of solid oxide fuel cells. Annu. Rev. Mater. Res. 2003, 33, 169–182. [CrossRef] Rupasov, D.; Chroneos, A.; Parfitt, D.; Kilner, J.A.; Grimes, R.W.; Istomin, S.Y.; Antipov, E.V. Oxygen diffusion in Sr0.75 Y0.25 CoO2.625 : A molecular dynamics study. Phys. Rev. B 2009, 79, 1–4. [CrossRef] Seymour, I.D.; Tarancón, A.; Chroneos, A.; Parfitt, D.; Kilner, J.A.; Grimes, R.W. Anisotropic oxygen diffusion in PrBaCo2 O5.5 double perovskites. Solid State Ion. 2012, 216, 41–43. [CrossRef] Timakul, P.; Jinawath, S.; Aungkavattana, P. Fabrication of electrolyte materials for solid oxide fuel cells by tape-casting. Ceram. Int. 2008, 34, 867–871. [CrossRef] Mücke, R.; Menzler, N.H.; Buchkremer, H.P.; Stover, D. Co-firing of thin zirconia films during SOFC manufacturing. J. Am. Ceram. Soc. 2009, 92, S95–S102. [CrossRef] Moon, H.; Kim, S.D.; Park, E.W.; Hyun, S.H.; Kim, H.S. Characteristics of SOFC single cells with anode active layer via tape casting and co-firing. Int. J. Hydrog. Energy 2008, 33, 2826–2833. [CrossRef] Park, H.G.; Moon, H.; Park, S.C.; Lee, J.J.; Yoon, D.; Hyun, S.H.; Kim, D.H. Performance improvement of anode-supported electrolytes for planar solid oxide fuel cells via a tape-casting/lamination/co-firing technique. J. Power Sources 2010, 195, 2463–2469. [CrossRef] Moon, H.; Kang, D.W.; Park, H.G.; Hyun, S.H. Stress and camber analysis of anode-supported electrolytes by tape-casting and co-firing techniques. Int. J. Hydrog. Energy 2011, 36, 10991–10997. [CrossRef] Malzbender, J.; Steinbrech, R.W.; Singheiser, L. A review of advanced techniques for characterizing SOFC behavior. Fuel Cells 2009, 9, 785–793. [CrossRef] Shen, Z.; Zhu, X.; Le, S.; Sun, W.; Sun, K. Co-sintering anode and Y2 O3 stabilized ZrO2 thin electrolyte film for solid oxide fuel cell fabricated by co-tape casting. Int. J. Hydrog. Energy 2012, 37, 10337–10345. [CrossRef] Menzler, N.H.; Malzbender, J.; Schoderbock, P.; Kauert, R.; Buchkremer, H.P. Sequential tape casting of anode-supported solid oxide fuel cells. Fuel Cells 2014, 14, 96–106. [CrossRef] Cologna, M.; Contino, A.R.; Montinaro, D.; Sglavo, V.M. Effect of Al and Ce doping on the deformation upon sintering in sequential tape cast layers for solid oxide fuel cells. J. Power Sources 2009, 193, 80–85. [CrossRef] He, C.R.; Wang, W.G.; Wang, J.; Xue, Y. Effect of alumina on the curvature, Young’s modulus, thermal expansion coefficient and residual stress of planar solid oxide fuel cells. J. Power Sources 2011, 196, 7639–7644. [CrossRef] Sun, B.; Rudkin, R.A.; Atkinson, A. Effect of thermal cycling on residual stress and curvature of anode-supported SOFCs. Fuel Cells 2009, 9, 805–813. [CrossRef] Lia, W.; Hasinska, K.; Seabaugh, M.; Swartz, S.; Lannutti, J. Curvature in solid oxide fuel cells. J. Power Sources 2004, 138, 145–155. [CrossRef] Jung, G.B.; Fang, L.H.; Chiou, M.J.; Nguyen, X.-V.; Su, A.; Lee, W.-T.; Chang, S.W.; Kao, I.C.; Yu, J.W. Effects of pretreatment methods on electrodes and SOFC performance. Energies 2014, 7, 3922–3933. [CrossRef] Jung, G.B.; Fang, L.H.; Lin, C.Y.; Nguyen, X.-V.; Yeh, C.C.; Lee, C.Y.; Yu, J.W.; Chan, S.H.; Lee, W.-T.; Chang, S.W.; et al. Electrochemical performance and long-term durability of a reversible solid oxide fuel cell. Int. J. Electrochem. Sci. 2015, 10, 9089–9104. © 2016 by the authors; licensee MDPI, Basel, Switzerland. This article is an open access article distributed under the terms and conditions of the Creative Commons Attribution (CC-BY) license (http://creativecommons.org/licenses/by/4.0/).