(a) The schematic diagram of a-STO TFT. (b) Cross-sectional high resolution transmission electron microscope (HRTEM) image and elements distribution ...
Effect of Source/Drain Electrodes on Electrical Properties of Silicon-Tin-Oxide Thin-Film Transistors Xianzhe Liu1, Honglong Ning1, Weifeng Chen1, Zhiqiang Fang2, Rihui Yao1,*, Xiaofeng Wang3,
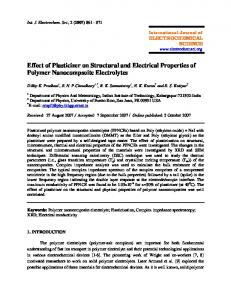
Intensity (cps)
Yuxi Deng1, Weijian Yuan1, Weijing Wu1,*, Junbiao Peng1
10
7
10
6
10
5
10
4
Sample 1 Sample 2 Sample 3
0.2
0.4
0.6
0.8
1.0
1.2
Incident angle (deg) Figure S1. X-ray reflectivity (XRR) curves for a-STO films. Table S1. The properties (density, thickness and roughness) of a-STO films. Sample
Density (g/cm3)
Thickness (nm)
Roughness (nm)
1
6.21
5.062
0.669
2
6.198
5.06
0.623
3
6.138
5.043
0.671
Figure S2. (a) The schematic diagram of a-STO TFT. (b) Cross-sectional high resolution transmission electron microscope (HRTEM) image and elements distribution detected by Energydispersive X-ray spectroscopy (EDS) mapping scan for a-STO TFT.
Figure S3. (a) The cross-sectional transmission electron microscope (TEM) image and (b) elements distribution detected by Energy-dispersive X-ray spectroscopy (EDS) line scan for aSTO TFT.
Figure S4. (a) The work function of a-STO film (200nm) measured by X-ray Photoelectron Spectroscopy. (b) Theoretically, the energy band diagram of a-STO film contacted with different electrodes: ITO and Mo. The work functions of ITO, Mo and a-STO are 4.5 eV, 4.6 eV and 5.38 eV, respectively.
Figure S5. I-V curves of a-STO film contacted with different electrodes: (a) ITO and (b) Mo. The linear I-V curve of TFT with ITO or Mo contact indicated that Ohmic contact was formed at the electrode/a-STO interface. The importance of DOS in AOS device: In AOS devices, the subgap density of states (DOS) is an important parameter which plays a major part in controlling the mobility, the operation voltage and subthreshold swing of TFTs. The TFT mobilities are deteriorated by the subgap density of states (DOS), as roughly expressed by 𝑁𝐺𝑆 − 𝑁𝑇 𝜇𝐹𝐸 = μ 𝑁𝐺𝑆 where NT is the total DOS of the unoccupied subgap DOS, and NGS = Cg(VGS – Vth) is the electron density induced by VGS. The subgap DOS also determines the operation voltage of the TFT; the operation voltage is limited by the VGS range required to switch the TFT from the off state to the on state, which is expressed by the S value defined by 𝑒𝐷𝑠𝑔 𝑑𝑉𝐺𝑆 𝑘𝐵 𝑇 S= = 𝑙𝑛10 (1 + ) 𝑑𝑙𝑜𝑔𝐼𝐷𝑆 𝑒 𝐶𝑔 Dsg is the subgap DOS at the Fermi level (EF). These results indicate that reduction of the subgap DOS is the most important issue for realizing high-performance TFTs. The extracted procedure of parameters from Equation 1 and Equation 2: Equation 1:
The
1
𝑉2 2 𝐷𝑆
𝐼𝐷𝑆 =
𝑊 1 𝜇𝐹𝐸 𝐶𝑖 (𝑉𝐺𝑆 − 𝑉𝑡ℎ − 𝑉𝐷𝑆 ) 𝑉𝐷𝑆 𝐿 2
𝐼𝐷𝑆 =
𝑊 1 2 𝜇𝐹𝐸 𝐶𝑖 [(𝑉𝐺𝑆 − 𝑉𝑡ℎ )𝑉𝐷𝑆 − 𝑉𝐷𝑆 ] 𝐿 2
can be ignored in consideration of the very small value of VDS (~0.1V).
𝑊 𝜇 𝐶 (𝑉 − 𝑉𝑡ℎ )𝑉𝐷𝑆 𝐿 𝐹𝐸 𝑖 𝐺𝑆 Vth can be determined by using linear extrapolation of the tested transfer curve (IDS-VGS). The slope can also be obtained from linear extrapolation. 𝐼𝐷𝑆 =
Slope = 𝜇𝐹𝐸
𝑊 𝐶𝑉 𝐿 𝑖 𝐷𝑆
𝜇𝐹𝐸 =
𝐿 ∙ Slope 𝑊𝐶𝑖 𝑉𝐷𝑆
Equation 2: 𝑊𝜇𝑠𝑎𝑡 𝐶𝑖
𝐼𝐷𝑆 =
2𝐿
√𝐼𝐷𝑆 = √
(𝑉𝐺𝑆 − 𝑉𝑡ℎ )2
𝑊𝜇𝑠𝑎𝑡 𝐶𝑖 (𝑉𝐺𝑆 − 𝑉𝑡ℎ ) 2𝐿
Vth can be determined by using linear extrapolation of the tested transfer curve (√𝐼𝐷𝑆 -VGS). The slope can also be obtained from linear extrapolation. 𝑊𝜇𝑠𝑎𝑡 𝐶𝑖
Slope = √ 𝜇𝑠𝑎𝑡 =
2𝐿
2𝐿 ∙ Slope 𝑊𝐶𝑖
2
The procedure for the proposed extraction method is described as follows. 𝑉
𝜓𝑠 = ∫𝑉 𝑔𝑠 (1 − 𝑓𝑏
ρ(𝜓𝑠 ) = −
′ ) 𝐶𝑔 (𝑉𝑔𝑠
𝐶𝑜𝑥
) 𝑑𝑉𝑔𝑠′
(1)
𝑉𝑔𝑠 ′ )𝑑𝑉 ′ 𝐶𝑔 (𝑉𝑔𝑠 𝑔𝑠 𝑓𝑏 𝐶𝑔(𝑉𝑔𝑠 )
𝐶𝑔 (𝑉𝑔𝑠 ) ∫𝑉
𝜀𝑠 (1−
𝑁𝑡 (𝐸𝐹0 + 𝑞𝜓𝑠 ) = −
𝐶𝑜𝑥
1 𝜌(𝜓𝑠 +Δ𝜓𝑠 )−𝜌(𝜓𝑠 ) 𝑞2
(2)
)
Δ𝜓𝑠
−
𝑛0 𝑞𝑉𝑡
𝜓
𝑒𝑥𝑝 ( 𝑠 ) (3) 𝑉 𝑡
Firstly, Ψs in terms of Vgs is calculated from the Cg-Vgs characteristics of TFTs by (1). Secondly, the surface charge concentration ρ(Ψs) can be obtained from the Cg-Vgs characteristics of TFTs by (2). Finally, the density of states Nt(E) with respect to some energy level (E =EF0+qΨs) can be extracted by (3). As seen above, the proposed extraction method of DOS has the advantages of analyticity and simplicity.