Journal of Food Research; Vol. 4, No. 2; 2015 ISSN 1927-0887 E-ISSN 1927-0895 Published by Canadian Center of Science and Education
Effect of Storage Temperature on Biochemical and Mixolab Pasting Properties of Chinese Japonica Paddy Xing-jun Li1 & Ping Jiang1 1
Academy of the State Administration of Grains, Beijing 100037, China
Correspondence: Xing-jun Li, Academy of the State Administration of Grains, Beijing 100037, China. E-mail:
[email protected] Received: October 17, 2014 doi:10.5539/jfr.v4n2p57
Accepted: December 17, 2014
Online Published: December 29, 2014
URL: http://dx.doi.org/10.5539/jfr.v4n2p57
Abstract This study investigated the changes in germination rate, contents of oleic acids, protein, water soluble sugars, enthalpy of flour gelatinization, and Mixolab dough pasting properties of three varieties of japonica rough rice after 18-month storage at four temperatures of 4,15,25 and 35 ºC. After an 18-month storage, the paddy stored at or below 25 ºC had more than 70% germination rate, their flour extracts by acid dye mixture of methyl red and bromothymol blue showed greenish color, but the paddy stored at 35 ºC was only 30% germination rates, their flour extracts by acid dye mixture seem to be yellowish. With an increase in storage temperature, mositure content in paddy decreased, but total protein changed unsignificantly. In comparison to the paddy stored at 15 ºC, the higher storage temperature (25 and 35 ºC) tends to decrease the contents of damaged starch, water-soluble reducing sugars, total sugars, and uronic acids. The content of oleic acid in paddy stored at 4 ºC was markedly higher than that at the temperatures of 15, 25 and 35 ºC. Compared to lower temperate (4 and 15 ºC), the higher storage temperature (35 ºC) increased the gelatinization enthalpy of paddy flour and its starch determined by a differential scanning calorimetry (DSC), also increased Mixolab characteristic torque parameters such as starch gelatinization peak (C3), starch gelatinization minimum (C4), starch retrogradation minimum (C5), degrees of starch decay (C3-C4) and retrogradation (C5-C4) with a decrease in protein weakening (C2). The results of this study indicate storage temperature is an important factor affecting the physiological and biochemical properties of paddy, and lower temperature below room temperature are recommended to maintain paddy quality. Keywords: paddy, storage, nutrition, mixolab dough pasting properties, enthalpy of flour gelatinization, ageing 1. Introduction Rice is among the oldest of cultivated crops. History makes first mention of its being grown in China as early as 2800 B.C. Today nearly one half of the world's arable land is used for producing cereal grains, and about one-fifth of this is for the production of rice. As one of primary dietary sources of carbohydrates, rice plays important roles in meeting human energy requirements and nutrient intakes (Yang et al., 2006). China is the world's largest rice producer with annual production over 180 million tonne, and due to its large population, about 40 percent of its production is assigned to store longer periods (two years) in form of paddy under quasi-low temperature (around 20 ºC) condition. A great deal of studies deal with the effect of short time storage on physicochemical characteristics and rheological properties of rice (Dhaliwal et al., 1991; Likitwattanasade & Hongsprabhas, 2010; Park et al., 2012 ), but only a few studies (Zhou et al., 2003; 2007; 2010; Zhang et al., 2012) reports the influence of longer time storage on rice deterioration and thermal properties. It is imperative to screen feasible biochemical and thermodynamic parameters for evaluation of paddy quality during storage. Ageing during storage leads to numerous changes in the chemical and physical properties of rice (Noomhorm et al., 1997; Perdon et al., 1999; Pearce et al., 1999; Suzuki et al., 1999; Sowbhagya & Bhattacharya, 2001; Zhou et al., 2002; Sodhi et al., 2003; Patindol et al., 2005; Singh et al., 2006; Cao et al., 2009). These changes in rice pasting properties, color, flavor, and composition result in rice cooking and eating quality (Meullenet al., 2000; Teo et al., 2000; Jang et al., 2009) and depend on the rice variety, storage conditions, and amylose content. Such changes have been attributed to changes in cell walls and proteins, interaction between proteins and the degradative products of lipid oxidation, and starch-protein interaction (Sodhi et al., 2003; Park et al., 2012). The rapid viscosity analyzer (RVA) is commonly used to analyze the pasting properties of rice flour suspension 57
www.ccsenet.org/jfr
Journal of Food Research
Vol. 4, No. 2; 2015
(Perdon et al., 1997; Sowbhagya & Bhattacharya, 2001; Zhou et al., 2002), but the mixolab curves could supply with information about water absorption rate, dough protein network and starch gelatinization (Rosell et al., 2007). This study investigated the changes in germination rate, contents of oleic acids and water soluble sugars,damged starch, enthalpy of flour gelatinization, and Mixolab dough pasting properties of three varieties of japonica paddy after 18-month storage at four temperatures of 4,15,25 and 35 ºC, with an aim to explain the changes in functionality associated with storage. 2. Method and Materials 2.1 Experimental Sample and Preparation Three varieties of japonica paddy, “Changyou No. 3”, “Wuyuanjng”, and “Yanfeng” ” were used in this study (Table 1). Yanfeng was harvested in October, 2011 from Panjing city, Liaoning province. Changyou No.3 was obtained in late September, 2011 in Changyou city, Jiangsu province, and Wuyunjing was collected in November 2011 from Nanjing, Jiangsu province. Some samples were cleaned, repacked in 2-kg units in a polyethylene film bags and stored for 18 months in different temperature controller at 4 ºC, 15 ºC, 25 ºC, or 35 ºC before use. The other samples were treated at 40 ºC and 80% RH for three days, and then stored at 35 ºC, i.e. 40-35 ºC treatment. After storage, the paddy samples were dehulled and milled, with an 800 μm screen used. Table 1. Paddy samples Paddy variety (abbr)
Producing region
Harvest time
Changyou No. 3 (CY)
Jiangsu Province
Sep. 2011
Wuyunjing (WYJ)
Jiangsu Province
Oct. 2011
Yanfeng (YF)
Jinlin Province
Oct. 2011
2.2 Moisture Content, Germination Rate and Rice Freshness The moisture content of brown rice flour was determined at 105 ºC in an air-oven for 3 h. The germination potential and rate of paddy was determined respectively at the fifth and the tenth day after being seminated at 30 ºC. Freshness was determined by measuring light transmittance at 620 nm on rice flour extract with acid dye mixture of 0.05% methyl red and 0.15% bromothymol blue. 2.3 Contents of Free Fatty Acids and Oleic Acid The content of free fatty acids (FFA) in rice flour was extracted by anhydrous ethyl alcohol, and then determined by hand titration with 0.01 M sodium hydroxide–ethanol solution using phenolphthalein as indicator. The FFA content was also determined by automatic potentiometric titration method with a potentiometer (ET38, electrode DG 111-SG, Mettler-Toledo). Oleic acid content in brown rice flour was analyzed by the method of Goffman and Bergman (2003) with some revision. The lipid was extracted by vortex 6 g of milled rice for 15 min with 10 ml of isooctane, and then centrifuged at 4000 rpm for 5 min to collect the supernatant. An assay solution containing 4 ml of isooctane extract and 2 ml of 3% pyridine /5% cupric acetate reagent was shaken 5 min. After aqueous phase was fully fractionated, take 1mL isooctane fraction with a pipette to place in a 1-cm cuvette and measure absorbance at 715 nm. The oleic acid content of each extract was obtained from a calibration curve. Oleic acid (Sigma) was dissolved in isooctane to produce oleic acid solutions of 0-14.5 μmol/ml. 2.4 Content of-Soluble Total Sugars, Reducing Sugars and Pectic Acids of Paddy Brown rice flour (1.0 g) was weighed into 50 ml plastic centrifuge tube, mixed with 15 ml of hexane, and then shaken at room temperature for 3 h. After centrifuged at 4000 rpm and 4 ºC for 10 min, the precipitate was kept and fully volatilized hexane at a fume hood. The defatted meal was ground using a pestle and mortal with 15 ml of distilled water, then extracted for 5 min at room temperature. After centrifuged at 4000 rpm for 10 min, the supernatant was sample extracts. The content of total sugars was determined using phenol- sulfuric acid (Dubois et al., 1956). The extract (0.5 ml) was added 0.5 ml of 5% phenol aqueous solution, then 3 ml sulfuric acid, and carefully shaken. After cooled, the absorbency of 490 nm was measured. The content of reducing sugars was determined by 3,5-dinitro salicylic acid (DNS) colorimetric method. The extract (800 μl) was mixed with 600 ul of 4.4 mM DNS reagent, and boiled in water bath for 5 min. After cooled,
58
www.ccsenet.org/jfr
Journal of Food Research
Vol. 4, No. 2; 2015
the solution was diluted to a volume of 10 ml with distilled water and the absorbency of 540 nm was measured. Glucose was used to make standard curve. Uronic acid content was determined as described by Blumenkrantz et al. (1973). The extract (0.5 ml) was added 3 ml of 12.5 mM sodium tetraborate/ sulfuric acid, mixed, and boiled in water bath for 5 min. After cooled on ice to room temperature, the reactant was added 50 μl of 0.15% m-hydroxydipheny/ 0.5% NaOH reagent, mixed and the absorbency of 520 nm was measured. Galacturonic acid (sigma) was used to make standard curve. 2.5 Contents of Protein and Damaged Starch of Paddy The protein content in brown rice flour was determined by automatic nitrogen element rapid analyzer (Carbon Hydrogen Nitrogen Element Analyzer M366774, Elementar, Germany), the measured value was multiplied a coefficient of 5.95. The damaged starch content was determined by SD matic analyzer (Chopin Technologies, France). One gram rice flour was weighed and put into small dipper of the analyzer, one drop of 95% ethanol, 3 g boric acid, 3 g potassium iodide and 120 ml distilled water were put into the reaction cup. The analyzer automatically raises temperature of the reaction cup to 35 ºC, and flour sample automatically falls into reaction cup. This analyzer automatically calculates the content of damaged starch based on the residual iodide concentration. The result was present as the percentage of iodine adsorption (Ai%), since the content of damaged starch in brown rice flour expressed by either the UCD unit (the instrument manufacturer supply the calculation method) or UCDC unit (consider the effect of moisture and protein based on the UCD calculation) is negative. 2.6 Gelatinization Properties The thermal properties of rice flour and purified starch were determined with a different scanning calorimeter (DSC) 200F3 (Netzsch, Germany). The sample (3.0-3.1 mg) was weighed at aluminium crucible and added distilled water to the ratio of water/sample as 2:1. The aluminium crucible was sealed and equilibrated at 4 ºC overnight. DSC temperature was raised from 30 to 110 ºC, with heating rate 10 ºC /min. Rice starch was isolated by combining 3 g brown rice flour with 30 ml of petroleum ether/anhydrous ethanol (v/v, 4:1) and shaking for 2 h at room temperature to defat. After centrifuged at 4000 rpm for 10 min, the residue was again added 30 ml of petroleum ether/anhydrous ethanol (v/v, 4:1) and shaken for 2 h. The precipitate was dipped in 12 ml of 0.1% Na2SO3 solution for 1 h, and then centrifuged at 4000 rpm for 10 min. The precipitate was dissolved by 30 ml of 1% SDS solution and shaken 4 h. After centrifuged, the residue was washed four times with distilled water. Finally, the starch solid was dried at 45 ºC over 5 h. 2.7 Mixolab Measurement The mixing and pasting behavior of rice flour dough was measured using a Mixolab (Chopin Technologies, France) according to Rosell et al. (2007). Dough weighed at 90 g with 60% of water (14% w.b.) was evaluated. Both initial mixing temperature and water tank temperature were 30 ºC. The hydration was 55%-65%. Target torque is 0.8±0.5 Nm. The mixing speed during the entire assay was 80 rpm/min. Firstly, the temperature was held at 30 ºC for 8 min for the initial mixing. Secondly, the temperature increased at 4 ºC /min to 90 ºC within 15 min and then held for 7 min. Thirdly, the temperature decreased at 4 ºC /min to 50 ºC within 10 min and held for 5 min. The total test time is 45 min. The parameters of interest, given in Nm and including C1-C2 as well as C3-C4 and C5-C4, were recorded and calculated. 2.8 Statistical Analysis Experimental data were subjected to analysis of variance using SPSS 11.5 for windows. Treatment means were tested separately for least significant difference at a 5% level of probability. 3. Results 3.1 Changes in Moisture Content, Germination Rate and Freshness of Paddy Table 2 shows the changes in moisture content, germination rate and freshness of paddy. The moisture content (m.c.) of paddy decreased with an increase in storage temperature. The germination potential and rate of three japonica paddy tended to decrease with increaseing storage temperature. Stored at 35 ºC for 15 months, Changyou and Wuyunjing did not germinate, Yanfeng germinated 31%. At 25 ºC storage condition, Changyou, Wuyunjing, and Yanfeng germinated 72%, 85%, 92%, respectively. At lower temperature (15 ºC) storage, their germination rates all were over 95%. The brown rice flour extracts by acid dye mixture of methyl red and bromothymol blue show that the paddy stored at 4 ºC to 25 ºC gave grass green or greenish color, but paddies stored at 35 ºC was yellowish, even brown. 59
www.ccsenet.org/jfr
Journal of Food Research
Vol. 4, No. 2; 2015
The acid dye extracts from paddy stored at higher temperature had higher transparency (T620) than those of paddy stored at 4 ºC. Table 2. Germination rate and freshness of paddy stored for eighteen months Rice
Storage
Moisture content
Germination
Germination
Freshness
variety
Temp(ºC)
(%)
Potential (%)
Rate(%)
T 620
Color
CY
4
14.71
95.7±4.9a
96.0±4.4a
18.45±0.04e
greenish
15
14.33
93.0±1.0a
95.0±1.7a
31.88±0.01b
greenish
25
13.63
65.7±2.1b
72.0±3.6b
26.57±0.03d
greenish
35
13.28
0±0c
0±0c
71.76±0.06a
yellowish
40-35
12.07
0±0c
1.0±1.7c
31.02±0.02c
yellowish
4
14.75
95.7±2.1a
97.0±2.6a
16.31±0.06e
greenish
15
13.35
97.7±1.5a
98.3±0.6a
34.26±0.04a
greenish
25
12.90
91.3±1.5ab
92.3±2.5ab
27.35±0.05d
greenish
35
11.49
0±0d
0±0d
33.46±0.03b
yellowish
40-35
10.85
1.0±0c
1.3±0.6c
29.70±0.02c
yellowish
4
13.92
86.3±0.6a
91.3±3.1a
19.46±0.03e
greenish
15
13.17
91.7±2.9a
95.0±2.6a
24.57±0.17d
greenish
25
12.41
81.0±1.7b
84.7±2.5b
25.65±0.07c
greenish
35
10.76
29.0±2.6c
31.3±3.1c
28.95±0.01a
yellowish
40-35
9.91
1.7±0.6d
6.3±3.5d
26.79±0.08b
yellowish
WYJ
YF
Data are given as the means±SD (standard deviation) for triplicate. 3.2 Changes in Free Fatty Acid (FAA) and Oleic Acid of Paddy Table 3. Fatty acid content of paddy stored for eighteen months Storage temp.( ºC)
CY
WYJ
YF
Free fatty acids
4
23.01±7.53b
32.97±2.85b
8.15±2.82c
(mgKOH/100g)
15
65.35±2.26a
52.51±5.69a
44.39±17.09b
Hand titration
25
59.99±2.34a
60.31±7.94a
39.16±12.44b
35
64.58±10.43a
60.90±5.61a
90.3±7.74a
40-35
47.76±15.76a
0±0c
31.03±0b
Free fatty acids
4
44.44±0.37b
52.47±1.02a
62.80±4.42a
(mgKOH/100g)
15
45.92±2.44b
43.58±0.71c
46.72±0.96e
Potentiometric
25
45.54±2.43b
48.96±2.02b
48.71±0.32c
titration
35
66.18±3.68a
49.08±2.12b
48.08±0.19d
40-35
45.21±1.17b
48.19±1.80b
53.38±2.09b
Oleic acid
4
938.36±55.91a
2202.76±27.28a
1517.34±85.94a
(μg/gdw)
15
403.81±9.65e
608.42±10.53c
651.75±5.95c
25
495.22±26.21c
522.49±6.18d
698.28±11.6b
35
567.51±43.79b
869.90±37.78b
696.12±3.22b
40-35
459.23±6.07d
432.9±20.52d
657.07±16.46c
Data are given as the means ± SD for triplicate. 60
www.ccsenet.org/jfr
Journal of Food Research
Vol. 4, No. 2; 2015
Table 3 shows changes in the content of paddy FAA determined by different methods. With phenolphthalein as an indicator, the KOH- ethanol solution was used to manually titrate the paddy FFA extracted by anhydrous ethyl ethanol solution. The FFA in paddy stored at 15 ºC to 35 ºC was clearly higher than that stored at 4 ºC. The paddy FFA measured by this method did not show linear relationship with storage temperature in the range of 15 ºC to 35 ºC. The paddy FFA extracted by anhydrous ethyl ethanol was titrated with KOH- ethanol solution using potentiotitration method and pH glass electrode as indicating electrode. With addition of titration reagent, the potential (E) changed with the volume (V) of titration reagent. When E occur a transition, the end of titration reached. The FFA contents in Wuyun jing and Yanfeng stored at 15 to 35 ºC were clearly lower than that stored at 4 ºC, but Changyou stored at 15 to 35 ºC had higher FFA content than at 4 ºC. The paddy FFA content was also determined by colorimetric method with cupric acetate-pyridine as a color developing reagent. The oleic acid was used to make standard curve. The content of oleic acid in paddy stored at 4 ºC was markedly higher than that at the temperatures of 15 ºC, 25 ºC and 35 ºC. 3.3 Changes in Water-Soluble Sugars, Crude Protein and Damaged Starch of Paddy Table 4. Changes in water-soluble sugars, protein and damaged starch of paddy stored for eighteen months Rice variety CY
WYJ
YF
Total sugars
Pectic acids
Protein
Iodine value
(mg/g dw)
(mg/g dw)
(%d.b.)
(Ai%)
7.56±0.64d
27.83±1.41a
0.68±0.01cd
8.81
80.47±0.06b
15
17.96±0.09a
25.07±0.24b
1.03±0.01a
8.98
81.52±0.58a
25
13.68±0.64b
22.59±0.40c
0.79±0.06c
8.81
78.23±0.23c
35
13.44±0.14b
17.90±1.86d
0.72±0.07c
8.79
77.36±0.38d
40-35
8.88±0.67c
20.17±1.38d
0.96±0.05b
8.88
75.85±0.36e
4
8.23±0.07c
21.30±0.94b
0.30±0.01d
10.03
82.47±0.47a
15
15.04±0.42a
27.62±1.97a
1.20±0.05a
10.29
78.49±0.22b
25
11.38±0.25b
21.29±0.75b
0.77±0.06c
10.21
78.45±0.30b
35
11.80±0.24b
20.96±0.40b
0.87±0.02b
10.11
77.50±0.34c
40-35
8.59±0.51c
21.60±1.02b
0.92±0.03b
9.93
75.96±0.05d
4
12.88±0.36b
19.45±0.64ab
0.71±0.01c
10.07
80.03±0.13a
15
15.66±0.12a
21.66±1.57a
1.01±0.02a
9.21
76.56±0.59b
25
14.27±0.48a
21.83±1.17a
0.87±0.07ab
10.72
73.60±0.12c
35
11.85±0.57c
19.81±0.87a
0.95±0.05a
11.36
73.02±0.42d
40-35
8.09±0.47d
20.61±1.59a
0.65±0.06c
10.43
72.36±0.53d
Storage temp.
Reducing sugars
(ºC)
(mg/g dw)
4
Data are given as the mean±SD for triplicate. The protein content is the mean of two deterimations. Table 4 shows the changes in water-soluble reducing sugar, total sugar, pectic acid, and crude protein, as well as damaged starch of paddy. In comparison to 15 ºC storage, the contents of water-soluble reducing sugar, total sugar, and pectic acid tended to decrease in paddy stored at 25 ºC to 35 ºC. The content of paddy crude protein changed insignificantly with an increase in storage temperature. Compared to 4 ºC and 15 ºC storage, the damaged starch in paddy stored at 25 ºC and 35 ºC was reduced.
61
www.ccsenet.org/jfr
Journal of Food Research
Vol. 4, No. 2; 2015
3.4 Changes in Thermal Properties of Paddy Table 5. DSC data for rice flour ground from paddy storage for eighteen months Rice
Storage temp. To
Tp
Tc
Peak width Peak enthalpy
△H
(ºC)
(ºC)
(ºC)
(W/mg)
(J/g flour)
Variety (ºC)
(ºC)
CY
4
61.8±0.4a 67.2±0.4a
72.9±0.5a 11.1±0.9a
0.1132±0.0094a
5.5193±0.775b
15
61.5±0.2a 66.9±0.3a
72.3±0.6a 10.8±0.4a
0.1131±0.0145a
5.724±0.503b
25
61.7±0.6a 67.0±0.3a
72.5±0.9a 10.8±0.6a
0.1121±0.0129a
5.254±0.894b
35
61.7±0.4a 67.4±0.2a
74.0±0.6a 12.3±1.7a
0.1122±0.0122a
7.145±0.549a
40-35
61.8±0.2a 67.3±0.2a
73.1±0.5a 11.3±0.5a
0.1206±0.0116a
7.0170±0.672a
4
64.7±0.8a 70.7±0.5ab 77.1±0.7a 12.0±1.2a
0.1339±0.0174a
6.046±0.591c
15
66.2±0.5a 71.9±0.5a
77.4±0.6a 11.2±0.3a
0.1204±0.0134a
6.551±0.461c
25
65.7±0.9a 71.5±0.5a
77.4±0.5a 11.7±0.3a
0.1367±0.0166a
6.498±0.327c
35
66.2±0.4a 71.7±0.2a
77.5±0.2a 11.3±0.6a
0.1286±0.0118a
7.498±0.261b
40-35
66.5±0.6a 71.7±0.8a
77.8±0.4a 11.3±0.5a
0.1208±0.0166a
8.216±0.432a
4
64.2±0.7a 70.6±0.2a
76.4±0.3a 12.3±0.6a
0.1050±0.0072ab 6.125±0.541c
15
64.3±0.4a 70.6±0.2a
76.5±0.1a 12.3±0.3a
0.1069±0.0081ab 6.402±0.919c
25
64.1±0.4a 70.8±0.1a
76.2±0.9a 12.0±0.5a
0.1286±0.0136a
7.868±0.422ab
35
64.6±0.2a 70.9±0.3a
76.4±0.2a 11.8±0.4a
0.1267±0.0158a
8.289±0.741a
40-35
64.7±0.8a 70.7±0.5a
77.1±0.7a 12.1±0.2a
0.1339±0.0174a
9.014±0.846a
WYJ
YF
To, onset of gelatinaiztion; Tp, peak temp.; Tc, conclusion temp.; △H, enthalpy of gelatinization; Data are given as the mean ± SD for triplicate. Table 5 shows the effect of storage temperature on the thermal properties of rice flour ground from three japonica paddy. With increase in storage temperature, the onset temp. (To), peak temp. (Tp), and conclusion temp. (Tc) of three paddies, as well as peak width and peak enthalpy, all changed insignificantly, but their flour gelatinization enthalpy clearly increased. The values of To, Tp and Tc for Changyou were markedly lower than those of Wuyunjing and Yanfeng. The gelatinization enthalpy of Changyou was slightly lower than those of Wuyunjing and Yanfeng. The values of To, Tp, Tc and gelatinization enthalpy of Wuyunjing was similar to those of Yanfeng. Table 6. DSC data for purified starch from rice flour after paddy storage for eighteen months Rice Variety
Storage temp.
To
Tp
Tc
(ºC)
(ºC)
(ºC)
(ºC) CY WYJ YF
Peak width
Peak enthalpy
(ºC)
(W/mg)
△H (J/g starch)
4
60.1
64.9
71.4
11.3
0.1531
7.055
35
60.2
65.4
70.6
10.4
0.1665
7.210
4
68.3
72.3
77.5
9.2
0.2129
8.738
35
66.2
71.4
76.9
10.7
0.1847
8.748
4
66.4
71.3
76.7
10.3
0.1757
8.072
35
67.1
71.9
77.6
10.5
0.1841
8.342
To, onset of gelatinaiztion; Tp, peak temp.; Tc, conclusion temp.; △H, enthalpy of gelatinization; Data are given as the mean for two determinations.
62
www.ccsenet.org/jfr
Journal of Food Research
Vol. 4, No. 2; 2015
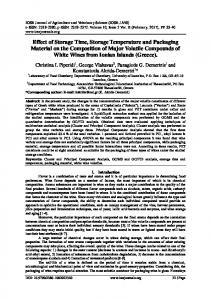
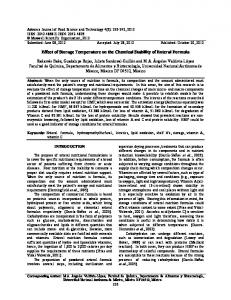
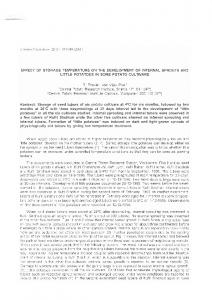
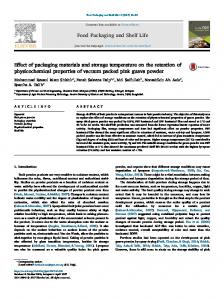
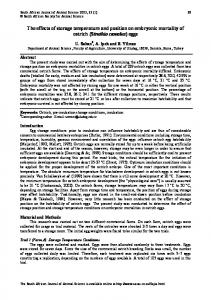
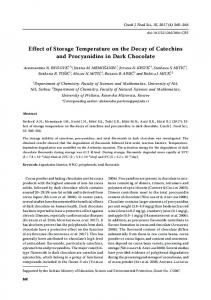
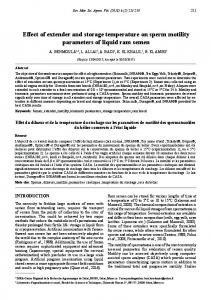
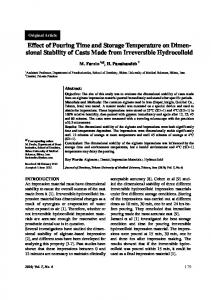
In order to preclude the influence of lipid, protein, cellulose, and hemicellulose, as well as soluble sugars and minerals on starch thermal property, we used purified rice starch to analyze DSC data. It was confirmed that the gelatinization enthalpy of rice starch from paddy stored at 4 ºC tended to be lower than that stored at 35 ºC (Table 5). The values of To, Tp, Tc, peak width, and enthalpy of gelatinization in purified rice starch were similar to those of brown rice flour, but its peak enthalpy markedly increased. The value of To, Tp and Tc in purified starch of Changyou were markedly lower than those of Wuyunjing and Yanfeng. The enthalpy of gelatinization in purified starch of Changyou was slightly lower than those of Wuyunjing and Yanfeng. The values of To, Tp, Tc and enthalpy of gelatinization in purified starch of Wuyunjing was similar to those of Yanfeng. 3.5 Changes in Mixolab Dough Pasting Properties of Paddy Table 7 shows the effect of storage temperature on mixolab dough pasting properties of paddy after 18-month storage. The first part of the curve in Figure 1, before the heating-cooling cycle starts, allows water absorption of the flours to be determined. The water addition level of kneading dough was constant 60% or 65% flour basis for three rice varieties. The dough development time (DDT) increased as the storage temperature of paddy increased. Compared to 15 ºC storage, C1 consistency peak torque (Nm) reduced as the storage temperature of paddy increased. The amplitude of kneading dough (AKD) at 30 ºC was in the range of 0.02 Nm to 0.04 Nm for three rice varieties. Dough stability time (min) shows the dough behavior during mixing, which increased as the storage temperature of paddy increased. Table 7. Mixolab pasting properties of rice flours from paddy Paddy Var.
Storage temp. (ºC)
Water
DDT
level%
(min)
C1 torque
AKD
DST
(Nm)
(min)
(Nm) CY
WYJ
YF
C2 torque (Nm)
C1-C2 (Nm)
C3
C4
Torque
torque
(Nm)
(Nm)
C3-C4 (Nm)
C5 torque (Nm)
C5-C4 (Nm)
4
65
2.03
0.29
0.02
3.63
0
2.03
1.59
0.86
0.73
1.37
0.51
15
60
1.52
0.75
0.04
2.93
0.23
1.29
1.77
1.16
0.61
1.81
0.65
25
60
2.08
0.42
0.03
5.93
0.13
1.95
1.86
1.1
0.76
1.73
0.63
35
60
6.35
0.58
0.04
9.1
0.37
5.98
2.18
1.32
0.86
1.98
0.66
40-35
60
5.77
0.33
0.04
8.5
0.17
5.6
1.96
1.17
0.79
1.8
0.63
4
65
2.62
0.55
0.02
5.87
0.24
2.38
1.66
1.16
0.5
1.68
0.52
15
60
1.8
0.6
0.03
6.03
0.19
1.61
1.68
1.2
0.48
1.78
0.58
25
60
2.78
0.3
0.03
8.7
0.07
2.71
1.74
1.13
0.61
1.75
0.62
35
60
6.63
0.31
0.03
9.85
0.13
6.5
1.9
1.23
0.67
1.89
0.76
40-35
60
4.83
0.31
0.03
8.22
0.09
4.74
1.75
1.17
0.58
1.82
1.65
4
65
2.88
0.32
0.02
6.32
0.12
2.76
1.52
1
0.52
1.44
0.44
15
60
1.97
0.41
0.03
5.48
0.1
1.87
1.68
1.12
0.56
1.7
0.58
25
60
4.55
0.33
0.02
7.12
0.07
4.48
1.8
1.16
0.64
1.79
0.63
35
60
5.13
0.26
0.03
9.1
0.04
5.09
1.78
1.13
0.65
1.7
0.57
40-35
65
5.17
0.57
0.02
9.85
0.32
0.25
2.32
1.56
0.76
2.29
1.13
Note: Water level%, constant water level (%flour basis); DDT,dough development time (min); C1, consistency peak torque (Nm); AKD, amplitude of kneading dough (Nm); DST, dough stability time (min); C2, consistency minimum torque (Nm); C1-C2, protein weakness; C3, pasting viscosity peak torque (Nm); C4, pasting viscosity minimum torque (Nm); C3-C4, starch decay (Nm); C5, starch retrogradation final torque (Nm); C5-C4,Starch setback (Nm).
63
www.ccsenet.org/jfr
Journal of Food Research
Vol. 4, No. 2; 2015
CY
2.5
Torque (Nm)
2 1.5 1 0.5
4℃ 15℃ 25℃ 35℃ 40-35℃
0 -0.5
0
10
20 30 Time (min)
40
50
WYJ
2
Torque (Nm)
1.5 1 0.5
4℃ 15℃ 25℃ 35℃ 40-35℃
0 -0.5
0
10
20 30 Time (min)
40
50
YF
2.5
Torque (Nm)
2 1.5 1 4℃ 15℃ 25℃ 35℃ 40-35℃
0.5 0 -0.5
0
10
20 30 Time (min)
40
50
Figure 1. Mixolab analysis of brown rice dough behavior during mixing, heating and cooling 64
www.ccsenet.org/jfr
Journal of Food Research
Vol. 4, No. 2; 2015
The minimum torque (C2) of dough consistency is related to weakening of the protein network from mechanical and thermal constraints. The high C2 minimum torque shows strong protein network. At five storage temperatures, C2 minimum torque was in the range of 0.01 to 0.37 Nm, 0.07 to 0.24 Nm and 0.04 to 0.12 Nm for Changyou, Wuyunjing and Yanfeng, respectively. Protein weakness (C1-C2) increased with an increase in storage temperature of three varieties of paddy. The second part of the curve shows the behavior of rice starch gelatinization. C3 pasting viscosity peak (Nm) shows starch gelatinization rate, which increased as the storage temperature of paddy increased, but C4 pasting viscosity minimum torque (Nm) and C5 starch retrogradation end (Nm) tended to increase. In contrast to lower temperature storage, higher temperature storage increased starch gelatinization peak (C3), starch gelatinization minimum (C4), starch retrogradation minimum (C5), degrees of starch decay (C3-C4) and setback (C5-C4). 4. Discussion Fat acidity is usually used as an index of quality deterioration during rice storage since lipid dissolution is considered to be more rapidly than protein and starch (Genkawa et al., 2008). This study showed that long 35 ºC storage seemed to increase FFA content, but significantly decreased oleic acid content compared with 4 ºC storage. This demonstrated that the rice triglycerides were degraded during storage. These changes might involve the hydrolysis of lipids to produce FFA and the oxidation of lipids (including FFA) into hydroperoxides and other secondary products (Gregory et al., 2008). Yasumatsu et al. (1964) suggested that FFA quantity increased during storage and bind with amylose in starch, and the increase in fatty acid-amylose complex may affect the maximum viscosity of the amylogram. Hence, the increase of FFA content in paddy during long time storage (over 15 months) should be cautious to adopt, and other sensitive indicator is need to explore. The duration and temperature of storage were found to markedly affect the enthalpy and temperature of gelatinization and retrogradation of rice flour (Fan & Marks, 1999). Starch and in particular, amylose became more insoluble following the higher temperature storage (Rajendra & Zakiuddin, 1991; Patindol et al., 2005; Zhou et al., 2007). The RVA pasting curves of rice flours have shown that the changes in pasting properties of milled rice during storage contained increased setback (Sowbhagya and Bhattacharya, 2001) and decreased breakdown(Zhou et al., 2003; Park et al., 2012). In this study, compared to lower temperate (4 and 15 ºC), the higher storage temperature (35 ºC) increased the enthalpy of paddy flour gelatinization determined by a differential scanning calorimetry (DSC) and decreased damaged starch, also increased Mixolab characteristic torque parameters such as starch gelatinization peak (C3), starch gelatinization minimum (C4), starch retrogradation minimum (C5), degrees of starch decay (C3-C4) and retrogradation (C5-C4) with a decrease in protein weakening (C2). This suggested that longtime higher temperature storage lead to more ordered structure of deteriorated rice, reducing the swelling and cracking of starch granula and leaking of starch components. This change in aged rice thermal behaviors maybe increase optimum cooking time. Interestingly, from the DSC thermograms we found the gelatinization enthalpy of rice purified starch from 4 ºC storage tended to be higher than that of 35 ºC long storage. This indicates the effect of storage on rice thermal properties relates to the interaction between starch and non-starch components after long storage. The effect of non-starch components such as protein and non-starch polysaccharides on the thermal properties of ageing rice need further study. 5. Conclusion After18-month storage, the paddy stored at or below 25 ºC had more than 70% germination rate, their flour extracts by acid dye mixture of methyl red and bromothymol blue showed greenish color, but the paddy stored at 35 ºC was only 30% germination rates, their flour extracts by acid dye mixture seem to be yellowish. With an increase in storage temperature, moisture content in paddy decreased. The content of oleic acid in paddy stored at 4 ºC was markedly higher than that at the temperatures of 15, 25 and 35 ºC. Compared to lower temperate (4 and 15 ºC), the higher storage temperature (35 ºC) increased the enthalpy of paddy flour gelatinization determined by a differential scanning calorimetry (DSC), also increased Mixolab characteristic torque parameters such as starch gelatinization peak (C3), starch gelatinization minimum (C4), starch retrogradation minimum (C5), degrees of starch decay (C3-C4) and retrogradation (C5-C4) with a decrease in protein weakening (C2). The results of this study indicate storage temperature is an important factor affecting the physiological and physicochemical properties of paddy, and lower temperature below room temperature are recommended to maintain paddy quality. Acknowledgements The authors gratefully acknowledge the Special Fund for Grain Scientific Research in the Public Interest from the State Administration of Grains, China (201313001-03-01). 65
www.ccsenet.org/jfr
Journal of Food Research
Vol. 4, No. 2; 2015
Reference Blumenkrantz, N., & Asboe-Hansen G. (1973). New method for quantitative determination of uronic acid. Analytical Biochemistry, 54(2), 484-489. http://dx.doi.org/10.1016/0003-2697(73)90377-1 Cao, Z. Y., Wei, Z. Y., & Li, X. J. (2009). Effect of high temperature and high humidity on the germination and contents of sugars, protein and amino acids of rice grains. Journal of Henan University of Technology (Natural Science Edition), 30(1), 22-28 (In Chinese with English abstract). Dhaliwal, Y. S., Sekhon, K. S., & Nagi, H. P. (1991). Enzymatic activities and rheological properties of stored rice. Cereal Chemistry, 68(1), 18-21. Dubois, M., Gilles, K. A., Hamilton, J. K., Rebers, P. A., & Smith, F. (1956). Colorimetric method for determination of sugars and related substances. Analytical Chemistry, 28(3), 350-356. http://dx.doi.org/10.1021/ac60111a017 Fan, J., & Marks, B. P. (1999). Effects of rough rice storage conditions on geletiniaztion and retrogradation properties of rice flours. Cereal Chemistry, 76(6), 894-897. http://dx.doi.org//10.1094/CCHEM.1999.76.6.894 Genkawa, T., Uchino, T., Inoue, A., Tanaka, F., & Hamanaka, D. (2008). Development of a low-moisture content storage system for brown rice: storability at decreased moisture contents. Biosystems Engineering, 99(4), 515-522. http://dx. doi.org/ 0.1016/j.biosystemseng.2007.12.011 Goffman, F. D., & Bergman, C. (2003). Hydrolytic degradation of triacyglycerols and changes in fatty acid composition in rice bran during storage. Cereal Chemistry, 80(4), 459-461. http://dx.doi.org/10.1094/CCHEM.2003.80.4.459 Gregory, A. G., Toshitaka, U., Fumihiko, T., & Daisuke, H. (2008). Effect of vapors from fractionated samples of propolis on microbial and oxidation damage of rice during storage. Journal of Food Engineering, 88(3), 341-352. http://dx.doi.org/10.1016/j.jfoodeng.2008.02.019 Jang, E. H., Lim, S. T., & Kim, S. S. (2009). Effect of storage temperature for paddy on consumer perception of cooked rice. Cereal Chemistry, 86(5), 549-555. http://dx.doi.org/10.1094/CCHEM-86-5-0549 Likitwattanasade, T., & Hongsprabhas, P. (2010). Effect of storage proteins on pasting properties and microstructure of Thai rice. Food Research International, 43(5), 1402-1409. http://dx.doi.org/10.1016/j.foodres.2010.04.011 Meullenet, J. F., Marks, B. P., Hankins, J. A., Griffin, V. K., & Daniels, M. J. (2000). Sensory quality of cooked long-grain rice as affected by rough rice moisture content, storage temperature, and storage duration. Cereal Chemistry, 77(2), 259-263. http://dx.doi.org/10.1094/CCHEM.2000.77.2.259 Noomhorm, A., Kongseree, N., & Apintanapong, N. (1997). Effect of aging on the quality of glutinous rice crackers. Cereal Chemistry, 74(1), 12-15. http://dx.doi.org/10.1094/CCHEM.1997.74.1.12 Park, C. E., Kim, Y. S., Park, K. J., & Kim, B. K. (2012). Changes in physicochemical characteristics of rice during storage at different temperatures. Journal of stored products research, 48(1), 25-29. http://dx.doi.org/10.1016/j.jspr.2011.08.005 Patindol, J., Wang, W. J., & Jane, J. I. (2005). Structure-functionality changes in starch following rough rice storage. Starch/Stärke, 57(5), 197-207. http://dx.doi.org/ 10.1002/star.200400367 Pearce, M. D., Marks, B. P., & Meullenet, J. F. (2001). Effects of postharvest parameters on functional changes during rough rice storage. Cereal Chemistry, 78(3), 354-357. http://dx.doi.org/10.1094/CCHEM.2001.78.3.354 Perdon, A. A., Marks, B. P., Siebenmorgen, T. J., & Reid, N. B. (1997). Effect of rough rice storage conditions on the amylograph and cooking properties of medium-grain rice cv. Bengal. Cereal Chemistry, 74(6), 864-867. http://dx.doi.org/10.1094/CCHEM.1997.74.6.864 Perdon, A. A., Siebenmorgen, T. J., Buescher, R. W., & Gbur, E. E. (1999).Starch retrogradation and texture of cooked milled rice during storage. Journal of Food Science, 64(5), 828-832. http://dx.doi.org/10.1111/j.1365-2621.1999.tb15921.x Rajendra, K. K., & Zakiuddin, A. S. (1991). Properties of rice starch from paddy stored in cold and at room temperature. Starch/Stärke, 43(5), 165-168. http://dx.doi.org/ 10.1002/star.19910430502
66
www.ccsenet.org/jfr
Journal of Food Research
Vol. 4, No. 2; 2015
Rosell, C. M., Collar, C., & Haros, M. (2007). Assessment of hydrocolloid effects on the thermo-mechanical properties of wheat using the Mixolab. Food Hydrocolloids, 21(3), 452-462. http://dx.doi.org/10.1016/j.foodhyd.2006.05.004 Sodhi, N. S., Singh, N., Arora, M., & Sing, J. (2003). Changes in physicochemical , thermal, cooking and textural properties of rice during aging. Journal of Food Processing and Preservation, 27(5), 387-400. http://dx.doi.org/ 10.1111/j.1745-4549.2003.tb00525.x Singh, N., Kaur, L., Sandhu, K. S., Kaur, J., & Nishinari, K. (2006). Relationships between physicochemical morphological, thermal, rheological properties of rice starch. Food Hydrocolloids, 20(4), 532-542. http://dx.doi.org/10.1016/j.foodhyd.2005.05.003 Sowbhagya, C. M., & Bhattacharya, K. R. (2001). Changes in pasting behaviour of rice during ageing. Journal of Cereal Science, 34(2), 115-124. http://dx.doi: 10.1006/jcrs.2001.0371 Suzuki, Y., Ise, K., Li, C., Honda, I., Iwai, Y., & Matsukura, U. (1999). Volatile components in stored rice (Oryza sativa L.) of varieties with and without lipolygenase-3 in seeds. Journal of Agricultural and Food Chemistry, 47(3), 1119-1124. http://dx.doi.org/ 10.1021/jf980967a Teo, C. H., Abd, A., Cheah, P. B., Norziah, M. H., & Seow, C. C. (2000). On the role of protein and starch in the aging of non-waxy rice flour. Food Chemistry, 69(3), 229-236. http://dx.doi.org/10.1016/S0308-8146(99)00271-X Yang, C. Z., Shu, X. L., Zhang, L. L., Wang, X. Y., Zhao, H. J., Ma, C. X., & Wu, D. X. (2006). Starch properties of mutant rice high in resistant starch. Journal of Agricultural and Food Chemistry, 54(2), 523-528. http://dx. doi.org/ 10.1021/jf0524123 Yasumatsu, K., Moritaka, S., & Kakinuma, T. (1964). Effect of the change during storage in lipid composition of rice on its amylogram. Agricultural and Biological Chemistry, 28, 265-272. Zhang, Y. D., Li, X. J., & Qin, W. (2012). Changes in contents of proteins and activity of polyphenol oxidase in newly harvested rough rice during storage. Food Science and Technology, 37(1)150-154,159 (In Chinese with English abstract). Zhou, Z. K., Robards, K., Helliwell, S., & Blanchard. C. (2002). Ageing of stored rice: Changes in chemical and physical attributes. Journal of Cereal Science, 35(1), 65-78. http://dx.doi.org/ 10.1006/jcrs.2001.0418 Zhou, Z. K., Robards, K., Helliwell, S., & Blanchard, C. (2010). Effect of storage temperature on rice thermal properties. Food Research International, 43(3), 709-715. http://dx.doi.org/10.1016/j.foodres.2009.11.002 Zhou, Z. K., Robards, K., Helliwell, S., & Blanchard, C. (2003). Effect of rice storage temperature on pasting properties of rice flour. Food Research International, 36(3), 625-634. http://dx.doi:10.1016/S0963-9969(03)00013-9 Zhou, Z. K., Robards, K., Helliwell, S., & Blanchard, C. (2007). Effect of storage temperature on cooking behaviour of rice. Food Chemistry, 105(2), 491-497. http://dx.doi.org/10.1016/j.foodchem.2007.04.005 Copyrights Copyright for this article is retained by the author(s), with first publication rights granted to the journal. This is an open-access article distributed under the terms and conditions of the Creative Commons Attribution license (http://creativecommons.org/licenses/by/3.0/).
67