AQUATIC BIOLOGY Aquat Biol
Vol. 14: 41–56, 2011 doi: 10.3354/ab00369
Published online December 6
Effects of a small-bladed macroalgal canopy on benthic boundary layer dynamics: implications for nutrient transport Louise T. Kregting1, 5,*, Craig L. Stevens2, Christopher D. Cornelisen3, 6, Conrad A. Pilditch4, Catriona L. Hurd1 1
Department of Botany, University of Otago, Dunedin 9016, New Zealand National Institute for Water and Atmospheric Research, Wellington 6021, New Zealand 3 Department of Marine Science, University of Otago, Dunedin 9015, New Zealand 4 Department of Biological Sciences, University of Waikato, Hamilton 3240, New Zealand 2
5
Present address: School of Biological Sciences, Queens University of Belfast, Northern Ireland, BT7 1NN, UK 6 Present address: Cawthron Institute, Nelson 7042, New Zealand
ABSTRACT: Field and laboratory velocity profiles were used to quantify boundary layer dynamics within communities of a small (< 0.2 m tall), dense canopy-forming seaweed Adamsiella chauvinii (Rhodophyta) in a soft-sediment habitat and to examine the role of hydrodynamics in modulating nutrient supply. At the ‘canopy scale’ there was a mixing layer at the fluid−canopy interface where turbulent kinetic energy was greatest, potentially enhancing nutrient uptake in this region. In the lower half of the canopy, a drag-dominated area of very low water velocity (< 0.01 m s−1) occurred. Spectral analysis revealed a reduction in energy within the canopy of around 1 Hz. The hydrodynamic parameters obtained from flume measurements were in good agreement with those recorded in the field. To understand the implications of the hydrodynamic environment on nutrient uptake, a flushing ratio was developed that compares the time for macroalgae to remove all nutrients from the canopy volume relative to the timescale for flushing. Results suggest that when nutrient demand is low, the canopy is well flushed and not mass-transfer limited. However when nutrient demand is high, the canopy can deplete nutrients more quickly than they can be replenished by ambient flows and are potentially mass-transfer limited. KEY WORDS: Macroalgae · Water motion · Boundary layers · Currents · Canopies · Turbulence · Nutrient uptake · Adamsiella chauvinii Resale or republication not permitted without written consent of the publisher
Growth rates of macroalgae are mainly controlled by the availability of nutrients, particularly nitrogen (e.g. Hanisak 1983, Lobban & Harrison 1997, Fong 2008) and light (e.g. Falkowski & Raven 1997). Water motion can also control growth rates of macroalgae (Hurd 2000), but the mechanism by which it influences growth is multifaceted and includes nutrient transport, dynamic stress and suspension of lightblocking sediment (e.g. Nikora 2010). Separating out
the relative importance of these individual mechanisms is difficult as it requires quantifying the interactions between turbulent fluid motion and macroalgae form and function. The effect of seagrass and coral canopies on near-bed flow structure has been extensively explored in the laboratory (e.g. Nepf & Vivoni 2000, Ghisalberti & Nepf 2002, Lowe et al. 2005, Reidenbach et al. 2007). Here we extend this previous work by focusing on interactions between turbulent flow and a substantially different macroalgal morphology — a branched small-bladed canopy-
*Email:
[email protected]
© Inter-Research 2011 · www.int-res.com
INTRODUCTION
42
Aquat Biol 14: 41–56, 2011
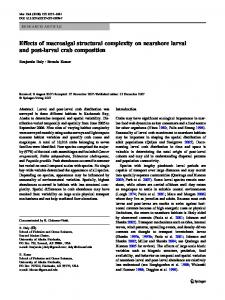
forming species — and consider the implications of these interactions for nutrient uptake. Investigations on flow (waves and currents) through macroalgal canopies have so far focused on largebladed species such as the giant kelp forests of Macrocystis pyrifera, (e.g. Jackson & Winant 1983, Jackson 1984, 1997, Gaylord et al. 2007, Rosman et al. 2007) and Laminaria hyperborea (Andersen et al. 1996, Mork 1996), whose canopies extend beyond the benthic boundary layer (BBL), thus modifying the hydrodynamic environment throughout the water column. However small macroalgae (< 0.2 m in height) can form extensive canopies in shallow-water environments, likely serving as an important source of carbon for near-shore food webs, as well as providing important habitats for many organisms (Lenihan & Micheli 2001). Similarly, the few field studies which have examined the role of water motion on nutrient supply and uptake by macroalgal canopies have also focused on large Macrocystis pyrifera kelp forests and indicate that they are not mass-transfer limited (Jackson 1977, Fram et al. 2008, but see Hepburn et al. 2007 for seasonal limitation). However, small macroalgae growing within the BBL may experience restricted flows relative to assemblages that extend beyond it towards the water surface (Wheeler 1988, Carpenter et al. 1991). The biological implication is that reduced flows within the canopy may increase the thickness of the diffusion boundary layer (DBL), a region where the flux of molecules to and from the surface of the blade occurs by molecular diffusion, and so restricts the supply of essential molecules to macroalgae (Wheeler 1988, Hurd 2000). Potentially offsetting the effects of reduced flow is an increase in turbulence generated by blade−fluid interactions (Ghisalberti & Nepf 2002). Whether turbulence is created and/or dampened within an assemblage of small macroalgae, therefore potentially enhancing/ reducing nutrient uptake, depends on the balance of canopy flow reduction versus blade-induced turbulence in the flow field, and is yet to be generalized. Macroalgal canopies are intrinsic components of the BBL and modify the local boundary layer as well as generating boundary layers around individual canopy components (e.g. blades, stipes, holdfasts, Fig. A1 in Appendix 1). Describing the transitions between these scales is fundamental to describing the processes controlling nutrient pathways. For example, the interface between the outer flow and the canopy boundary layer has been shown to be analogous to a ‘mixing layer’ rather than a ‘perturbed boundary layer’ (Raupach et al. 1996, Ghisalberti & Nepf 2002). Consequently, in unidirectional flow
conditions, water may be deflected over and around a canopy, producing a strong velocity shear at the fluid−canopy interface, as demonstrated for both marine marsh and seagrass canopies (e.g. Leonard & Luther 1995, Koch & Gust 1999, Cornelisen & Thomas 2004). Below the fluid−canopy interface, these studies show that flow is attenuated. Therefore, viscous forces may dominate and nutrient uptake within the macroalgal canopy becomes severely limited because of a thicker DBL, with only the apical tips at the fluid−canopy interface benefiting from the turbulence-induced thinner DBL. Laboratory studies, especially with plant proxies, have enabled substantial improvements in our understanding of flow−canopy interactions (e.g. Nepf & Koch 1999, Ghisalberti & Nepf 2002, 2004). However, typical laboratory flume arrangements do not provide sufficient lateral space to enable transverse flows to develop (Fonseca & Koehl 2006). Considerable scope exists for connecting didactic laboratory results with the variability seen in the natural environment. Here, we examine fluid−canopy interactions for a small-bladed highly branched red macroalga (< 0.2 m tall), in the laboratory and field, to address the following questions. (1) What is the structure of the boundary layer around small-bladed canopies and are fluid−canopy interactions measured in the laboratory and field comparable? (2) How do these measurements compare to those from other macrophyte and large kelp communities? (3) To what extent do fluid−canopy interactions potentially influence nutrient supply?
MATERIALS AND METHODS Species description The study species Adamsiella chauvinii (Harvey) L.E. Phillips et W.A. Nelson (Rhodophyta) (formerly known as Lenormandia chauvinii (Harv.)) has blades that arise from a discoid holdfast and consist of primary blades from which secondary, tertiary and quaternary blade branches arise (Adams 1994). The average blade length is 0.05 m. This species dominates a dense (i.e. 100% cover) mixed assemblage of macroalgae typically found on unconsolidated sediments in harbors and inlets. The canopies typically have an average height of 0.13 m and biomass of ~220 g dry wt m−2. Other species in the canopies include the bladed macroalgae Gracilaria truncata (Rhodophyta), which is similar in height to A. chauvinii, as well as epiphytic species, chiefly Brong-
Kregting et al.: Macroalgal canopy effects on boundary layers
niartella australis, Champia affinis and Polysiphonia spp., coralline algae (Rhodophyta) and ascidians (Kregting 2006). Hereafter A. chauvinii and associated epibionts will be termed ‘canopy’.
Laboratory velocimetry Observations of flow−canopy interactions were conducted in a 600 l recirculating flume (Vogel 1994). The working section of the flume was 2.4 (length) × 0.4 (width) m, filled to a water depth of 0.4 m and powered by a 1 hp variable-speed motor. An area (0.4 × 1 m) at 3 m water depth in Otago Harbor, South Island, New Zealand (45° 47.721’ S, 170° 39.245’ E) was carefully and completely removed of Adamsiella chauvinii and associated epibionts by divers, which was then reconstructed in the flume to recreate a field canopy. Holdfasts of A. chauvinii were not easily removed because of long-term burial in the sediment, making the old parts of the thallus very fragile. Therefore, most of the thalli were tied at the break point (very dark coloration) to a plastic mesh plate (0.4 × 1 m with 1 cm2 pore size) mimicking both the spatial arrangement and density of the field canopy. The leading edge of the canopy was placed 1 m downstream of the flume entrance, and since water motion in the natural aquatic environment is generally turbulent (Nowell & Jumars 1984, Gaylord et al. 2007), 3 lead blocks of 0.1 (length) × 0.025 (width) × 0.06 (height) m in size were placed perpendicular to the flow in a triangular formation ~0.1 m apart and 0.2 m upstream of the canopy in order to induce turbulence at the scale of the canopy. Velocity and turbulence profiles were obtained using an acoustic doppler velocimeter (ADV; YSI/ Sontek) at 3 locations along the mid-line of the tank with the u sensor (longitudinal component) of the probe orientated parallel to the dominant current direction. The first laboratory profile (LP) was taken immediately in front of the canopy at 0 m (LP-0) whereas the other 2 laboratory profiles were taken 0.25 and 0.5 m downstream of the leading edge of the canopy (LP-0.25 and LP-0.5 respectively). For each profile the ADV was positioned at 8 heights above the bottom of the flume and the velocity was recorded for 4 min at a sampling rate of 25 Hz. Four measurement heights above the stubstrate (Z, m) were within the canopy (Z = 0.02, 0.04, 0.08 and 0.1 m above the flume floor) and 4 above the canopy (Z = 0.12, 0.14, 0.18 and 0.2 m above the substrate); the approximate height of the canopy (hc) was 0.10 m. Nominal u velocities used for each profile treatment
43
were 0.015, 0.06, 0.12 and 0.2 m s−1, simulating typical mainstream velocities in the field. Velocimeter signal-to-noise ratios were well above the recommended 15 dB and the correlation values for the 3 sensors consistently above 90%. If the signal-tonoise ratio fell below 15 dB, Sontek seeding material (hollow glass spheres, 10 μm mean diameter) was added to the tank. When collecting data within the canopy, any blades that intruded into the ADV sample volume were trimmed in order to avoid acoustic interference. Trimming the blades has been shown to have no significant effect on flow measurements taken in vegetative canopies (Ikeda & Kanazawa 1996). Velocity profiles at the same positions (LP-0, LP-0.25 and LP-0.5 m) were also collected in the absence of the algal canopy.
Field velocimetry Field observations of near-bed flow were collected in an Adamsiella chauvinii-dominated macroalgal assemblage. The subtidal study site (located in 3 m water depth close to the collection site described above) was approximately 50 m from the low tide mark and consisted of a relatively flat, soft sediment habitat with no known reef structures within a 50 m radius. Velocity profiles were obtained with the same ADV used in the laboratory flume. One profile was recorded over bare sediment and 5 profiles were made in different areas of the macroalgal bed (~5 m2 patch size) at a range of distances far enough away from the leading edge of the canopy (>1 m) to minimize any potential edge effects. The probe was attached to a metal rod that could be moved vertically by a diver to position the sensor at specific heights above the substrate. Velocity profiles were collected during outgoing tides on 2 separate occasions. For each profile, velocity data were recorded at 25 Hz for 2 to 4 min at 5 to 6 measurement heights within the canopy and a further 3 to 4 heights above the canopy. We randomized the measurement order at the different heights because there was only one sensor, so recordings could not be normalized to account for any changes in background flows (due to tides) during the 30 to 35 min needed to complete a profile. Ideally, we would have liked to measure profiles throughout the water column to quantify the interaction between background flows and small canopies, but this was logistically not possible. Similar to laboratory experiments, blades were carefully trimmed around the sensor to prevent interference. The u sensor of the probe was orientated parallel to the dominant current direction.
Aquat Biol 14: 41–56, 2011
44
Velocimeter analysis
Flow visualization
Quantifying the flux of dissolved substances to and from the blade surface requires knowledge of the background turbulence and the turbulence generated by the canopy itself. Hydrodynamic quantities resolved from the ADV velocity data at each measurement height include averaged longitudinal – and turbulent kinetic energy (TKE): velocity (u) ––– ––– ––– (1) TKE = 0.5 × (u’2 + v ’2 + w ’2)
To complement laboratory and field velocity profiles, flow visualization experiments were designed to show the onset of turbulence through a portion of a thallus along with the subsequent scales of motion. Visualization experiments were conducted in a 46 l recirculating flume (Hurd et al. 1994). Mainstream flow within the test section was laminar to 0.08 m s−1 so that the effect of Adamsiella chauvinii in turbulence generation could be observed (Hurd et al. 1994). The flume was filled with seawater and placed in a dark room. Two 150 W projectors (Paximat 5150, Braun) were used to project light onto a mirror that reflected the light through a narrow light field obtained from a black card with a 0.01 m wide slit cut longitudinally above the test section of the tank. A 30 g wet wt portion (~0.12 m height) of A. chauvinii thallus, which had been collected from the field on the morning of the flow visualization, was anchored in its natural orientation using a weight 0.1 m downstream from the collimator. Two g of glimmer fine powder (Sinopia) were added to the tank as a tracer and images (Nikon Coolpix 8700 digital camera, F2.8 and S ¼, ISO 200) were taken at nominal velocities of 0.015, 0.03, 0.06 and 0.12 m s−1.
where u’, v ’ and w ’ are the instantaneous velocity variation in the longitudinal, horizontal and vertical components (m s–1) respectively. The thicknesses of boundary layers are dependent on the mainstream flow speed and substrate roughness because of drag forces (no-slip and viscosity), so that u– will be the dominant parameter influencing the flux of molecules to the blade surface. For comparison purposes, both u– and TKE were normalized; u– by the maximum averaged longitudinal velocity for – u– ) and TKE by u– 2 (i.e. each profile (u– b) (i.e. u/ b – 2 TKE/u ). These variables were plotted as a function of Z normalized to the height of the canopy (hc) (i.e. Z/hc). Energy spectra from above (outer) and within (inner) the canopy from representative flume and field profiles were also resolved from de-spiked versions of the velocity time-series to determine the scales at which the normalized TKE was held using 512 point data segments and a Hanning smoothing window (Priestly 1981). The spectral realizations were compared with a frequency to the −5/3 power law, which represents the ideal energy cascade for homogeneous isotropic turbulence (Nikora 2010). The nutrient and volume flux entering a canopy is determined by the background or outer ‘controlling’ flow (1~10 m). In tidally-dominated areas steady flow can be reasonably assumed; however verifying the degree of wave-influence on field measurements is important, especially in comparisons with those made in unidirectional flumes. We used the ratio of the mean velocity relative to the fluctuating component of flow (Rv) to assess the relative importance of oscillatory and steady flow in the field profiles (Porter et al. 2000): u Rv = (2) uSD where uSD is a measure of variability, here represented as the standard deviation of flow speed. Hence situations where Rv >> 1 imply that the flow can be considered steady, whereas wave effects need to be considered for Rv 1 indicates that the rate of flushing is greater than the rate of uptake (i.e. good for nutrient supply).
Kregting et al.: Macroalgal canopy effects on boundary layers
45
Fig. 1. Flume velocity profiles in the absence of macroalgae. Mean longitudinal velocity (u– ) normalized by the maximum flow speed (u– b) and turbulent kinetic energy (TKE) normalized by mean longitudinal velocity squared at a range of distances downstream from where the leading edge of canopy would be (LP-0 = 0.0 m, LP-0.25 = 0.25 m, LP-0.5 = 0.5 m) are plotted at 2 nominal velocities, 0.015 and 0.2 m s−1. Distance above the flume floor (Z) was standardized to the height of the canopy (hc)
RESULTS Laboratory velocity profiles In the absence of the macroalgal canopy, LP-0.25 and LP-0.5 showed the formation of a benthic boundary layer (Fig.1). Velocity profiles at 0 m (LP-0) showed a thicker boundary layer where u– /u– b < 0.2 close to the flume floor (i.e. Z/hc < 0.2). All profiles showed effects of the upstream blocks, which were most pronounced at LP-0 (Fig. 1). The greatest TKE occurred when Z/hc was between 0.4 and 0.8 (4 to 8 cm off the bottom) and was more noticeable at LP0.25 and LP-0.5 (Fig. 1). This height coincides with the height of the upstream turbulence-inducing blocks. The macroalgal canopy did not greatly influence the upstream velocity profile (LP-0), but as flow entered the
canopy it was attenuated quickly and continued to decrease with distance into the canopy (Fig. 2). At LP-0.5 m, regardless of mainstream velocity, flow was reduced by more than 95% within the lower half of the canopy (Z/hc < 0.5) (Fig. 3). As fluid moved over the canopy, a transitional region of strong shear with increasing velocity and little increase in TKE was observed (Z/hc = 0.5 to 1.0). TKE was greatest at the fluid−canopy interface (Z/hc = 1) at all mainstream velocities (Fig. 2, LP0.25 and LP-0.5 m). These results indicate 3 separate hydrodynamic environments surrounding a canopy of Adamsiella chauvinii and associated epibionts. In the lower half of the canopy (Z/hc < 0.5) velocity is greatly attenuated, a transitional layer then exists in the upper half of the canopy (Z/hc = 0.5 to 1), and the top of the canopy (Z/hc = 1) is characterized by a region of high velocity, momentum flux and turbulence.
46
Aquat Biol 14: 41–56, 2011
Fig. 2. Flume velocity profiles in the presence of a macroalgal canopy. Mean normalized longitudinal velocity and turbulence at a range of distances downstream from the leading edge of the canopy (see Fig. 1 for details) are plotted at 4 nominal velocities (0.015, 0.06, 0.12, 0.2 m s−1). Distance above the flume floor (Z) was standardized to the height of the canopy (hc)
Time and frequency representations of the velocity data from LP-0.5, where mainstream velocity treatment = 0.12 m s−1 was for the inner (Z/hc = 0.4) and outer (Z/hc = 2.2) canopy, reveal a clear unidirectional flow above the canopy (Fig. 4A). When nor– , v and w fluctuate by approximately malized by u b 0.15 (Fig. 4A), whereas the fluctuations in the inner canopy were an order of magnitude lower (< 0.1,
Fig. 4B). In fact, within the canopy, a constant longitudinal unidirectional flow did not even exist clearly (that is, a non-zero u component). There also appears to be mid-scale structure in the velocity time-series at approximately a 20 s interval, which is most clearly seen in the inner-canopy w (Fig. 4B). The outer-canopy spectra were similar for all 3 velocity components, although the vertical compo-
Kregting et al.: Macroalgal canopy effects on boundary layers
47
erating a steep velocity gradient with normalized velocities less than 0.1 recorded in the lower half of the canopy (Z/hc < 0.5) regardless of the mainstream velocity (Fig. 5A). Over bare sediment, water flow was attenuated close to the seafloor, indicative of the BBL. Normalized flows at Z/hc = 0.5 were 3 times faster over bare sediment than within the canopy, despite a lower mainstream flow speed, than in FP-2 and FP-3 (Fig. 5A). Above the canopy, flow was characterized as steady with Rv values of 4 to 8 for all profiles. TKE was greatest at the fluid−canopy interface (Z/hc = 1) and was reduced by 95% within the bottom half (Z/hc < 0.5) of the canopy, independent of mainstream flow velocity (Fig. 5B). Note that for Fig. 3. Percent attenuation of velocities within an Adamsiella chauvinii canopy FP-1, normalization of TKE using the compared to maximum averaged longitudinal velocity for each profile above very low mainstream flow speeds exag– the canopy (u b) plotted at 4 nominal velocities (0.015, 0.06, 0.12, 0.2 m s−1) at gerated turbulence intensity. 0.5 m from the leading edge of the canopy (LP-0.5). Percent attenuation is Time and frequency representations shown for heights above the flume floor (Z) standardized to the height of for the field data from FP-2 for the inner the canopy (hc) (Z/hc = 0.2) and outer (Z/hc = 2.6) canopy reveals greater horizontal and nent spectrum appeared to be reduced at high frevertical structure than in the laboratory (Fig. 6). quencies (Fig. 4C,D). This possibly reflects noise Outer-canopy normalized v and w fluctuated by enhancing the horizontal spectra; however, the specaround 0.25, around twice that seen in the laboratory. tra are certainly suitable for identifying differences in However, similar to the laboratory measurements, flow at the canopy scale. The energy at the 20 s interthe inner-canopy values were an order of magnitude val observed in the velocity time series is seen in the lower (< 0.1) than the outer canopy (Fig. 6B). Within u and v spectra at frequencies less than 0.1 Hz (Fig. the canopy, flow speeds fluctuated around zero, 4C). The inner-canopy horizontal spectra are around with frequent changes in direction, in contrast to the a factor of 20 smaller than the outer-canopy data. The directional flow above the canopy (Fig. 6A,B), even better-resolved vertical spectra show this difference to the point where the along-stream current reverses growing with higher frequencies, indicating substan(i.e. negative u). tial reduction in turbulence within the canopy (Fig. The outer-canopy spectra for FP-2 were similar for 4D). Notably the outer laboratory spectrum for w all 3 velocity components, however inside the canopy never quite matched the −5/3 power law slope, sugthere were obvious variations (Fig. 6C,D). Velocity gesting there were a number of direct and local influfluctuations in u at low frequencies were around a ences on turbulence from the canopy. factor of 5 greater in energy than those in w. Furthermore, there was some systematic variation around 0.1 to 0.5 Hz (2 to 10 s); the u component fluctuations Field velocity structure dominated, but in this region there were also fluctuations in v. This potentially justifies the use of the Several of the field velocity profiles were recorded upstream blocks in the flume. The laboratory spectra with similar background flows so only representative identify energy in the band (0.1 Hz) that was unlikely profiles are presented. The mainstream velocities to have been present without the blocks as similar chosen were 0.10, 0.04, 0.12 and 0.20 m s−1 for bare levels of energy are also seen in this frequency band sediment, field profile 1 (FP-1), field profile 2 (FP-2) in the field observations. At all frequencies fluctuaand field profile 3 (FP-3), respectively. Within the tions in w were smaller than u and v. No obvious algal assemblage flow was strongly attenuated, genpeaks indicative of wave-induced turbulent energy
48
Aquat Biol 14: 41–56, 2011
Fig. 4. Outer-canopy (A; standardized distance from floor [Z/h c] = 2.2) and inner-canopy (B; Z/h c = 0.4) velocity timeseries from flume measurements of an Adamsiella chauvinii canopy. Velocities are from laboratory profile 0.5 m (LP-0.5) at a nominal velocity treatment of 0.12 m s−1. Positive u, i.e. the longitudinal flow component, is in the direction of mean flow, v is horizontal and w is vertical to the mean flow. Each velocity component (u, v, w) was standardized by the mean of the longitudinal component for the outer-canopy flow (u– b). Power spectral density (psd) for the (C) longitudinal, horizontal and (D) vertical velocity components in and out of the canopy along with a slope (dashed line) showing a −5/3 power law of arbitrary amplitude are shown
were observed in the spectra (Fig. 6). During wind events, wave-generated turbulent energy would typically peak at frequencies around 0.5 Hz, which in 3 m of water, shallow-water wave theory indicates a wavelength of around 6 m (Dean & Dalrymple 1991).
Comparison between laboratory and field velocity structure The canopy boundary layer structure observed in the flume was comparable to that measured in the
Fig. 5. Representative field velocity profiles of normalized (A) mean longitudinal velocity and (B) turbulence (see Fig. 1) in an Adamsiella chauvinii canopy and over nearby bare sediment recorded during an outgoing tide. Profiles are plotted at nominal velocities of 0.10, 0.04, 0.12 and 0.2 m s−1 for bare sediment, field profile 1 (FP-1), field profile 2 (FP-2) and field profile 3 (FP-3) respectively, as functions of height above the substrate (Z) standardized by the height of the canopy (hc = 0.1 to 0.15 m). The profile over the bare sediment was standardized by the average canopy height
Kregting et al.: Macroalgal canopy effects on boundary layers
49
laboratory and field profiles (Pearson’s r = 0.97, df = 5, p = 0.006). However TKE values in the field were on average 2.7 times higher than those measured at the same height in the laboratory. Direct comparison between spectra (Fig. 7) reveals a number of differences in the turbulence structure between the laboratory and field. The clearest difference is that the spectral band-cut filter (i.e. removal of mid-range frequencies) is seen more strongly in the laboratory than in the field (Fig. 7A). Making direct comparisons between the field and laboratory data for each canopy location (Fig. 7B) is useful but must be treated with caution as the background conditions are not directly linked in any mechanistic way. However, these spectra do again reveal the inner-canopy enhanced attenuation at around 1 Hz in the laboratory. The spectra also show the order of magnitude difference in energy at the lower end of the scale, suggesting that laboratory flumes isolate mechanics but do not capture all turbulence scales.
Fig. 6. Outer-canopy (A; standardized distance from floor [Z/h c] = 2.6) and inner-canopy (B; Z/h c = 0.2) velocity timeseries from field data for an Adamsiella chauvinii canopy. Velocities are from field profile 2 (FP-2) where mainstream velocity was 0.12 m s−1. Positive u, i.e. longitudinal flow component, is in the direction of mean flow, v is horizontal and w is vertical to the mean flow. Each velocity component (u, v, w) was normalized by the mean of the longitudinal component for the outer flow (u– b). Power spectral density (psd) for the (C) longitudinal, horizontal and (D) vertical velocity components along with a slope (dashed line) showing a −5/3 power law of arbitrary amplitude are shown
field (cf. Figs. 2 & 5). The mean flow attenuation (averaged over all flow speed treatments) in the flume canopy at LP-0.5 (i.e. furthest profile downstream of the leading edge and therefore most representative of the field measurements) was highly correlated (Pearson’s r = 0.98, df = 5, p = 0.003) with the averaged flow reduction measured in the field at the same height. Moreover, the slope of the relationship was close to unity (1.02) and intercept near zero (−0.03). Similarly averaged normalized TKE at the same height was also highly correlated between
Fig. 7. Comparison of power spectral densities (psd) for the vertical velocity component (w) between (A) inner and outer spectra for both laboratory and field and (B) between laboratory and field for inner and outer canopy data
Aquat Biol 14: 41–56, 2011
50
A
B
C
Fig. 8. Seawater flow around a thallus of Adamsiella chauvinii at nominal velocities of (A) 0.015, (B) 0.03 and (C) 0.06 m s−1
Flow visualization In still images of the glimmer tracers, laminar, transitional and turbulent flow generate different ‘length scales of variability’. The observed spatial distance between the dark (or light) bands in the glimmer visualization is generated by the spatial variability of shear stress of the fluid and indicates coherent struc-
tures as described by Hurd & Stevens (1997). At a velocity of 0.015 m s−1, laminar flow was evident in the downstream wake of the portion of Adamsiella chauvinii thallus, while there was evidence of a transitional zone at the apical tips of the thallus (Fig. 8A). At a velocity of 0.035 m s−1, the downstream wake behind the portion of the thallus had become a transitional zone, while turbulence was observed at the
Kregting et al.: Macroalgal canopy effects on boundary layers
apical tips (Fig. 8B). At 0.06 and 0.12 m s−1, (photo not shown of 0.12 m s−1), the downstream wake and flow around the apical tips were fully turbulent (Fig. 8C). Furthermore, compression of the thallus was evident at velocities above 0.03 m s−1. However, as the thallus is typically part of a macroalgal canopy (not mimicked here), both compression of the algal portion and flow behind the thallus may not depict what occurs in the field as the canopy showed no real compression during any stage of the tide (L. Kregting pers. obs.).
Nutrient transport and uptake The depletion−flushing ratio FR can be estimated for an Adamsiella chauvinii assemblage using laboratory and field measurements. For coastal Otago waters a typical nitrogen (ammonium and nitrate) concentration is 3 × 10⁻³ mol m−3 (Kregting et al. 2008a). Based on data collected during this study a typical patch of A. chauvinii that measures 5 (length) × 5 (width) × 0.13 (height) m has a volume of ~3.25 m3 with an aerial extent of 25 m2 and a biomass of ~220 g dry wt m−2. Nutrient uptake rates by A. chauvinii vary depending on season and nutrient type (ammonium or nitrate) so FR was calculated using a minimum and maximum value of 0.0003 and 0.003 10−6 mol g dry wt−1 s−1 (Kregting et al. 2008b). Similarly, field flow rates through canopies can vary (see Fig. 5A) so that FR with representative slow and fast flows (0.01 and 0.20 m s−1 respectively) were also considered. FR for a unidirectional flow showed that when uptake rates by A. chauvinii were minimal, FR = 12 and 234 for slow and fast flows, respectively. However when nutrient uptake rate is high, FR = 1.2 and 23 for slow and fast flows, respectively.
DISCUSSION Results of both the flume and field velocity profiles showed that a canopy of Adamsiella chauvinii and associated epibionts created 3 hydrodynamically different environments: a drag-dominated layer in the lower half of the canopy, a mixing layer at the fluid−canopy interface, and a transitional layer in between. TKE was greatest at the fluid−canopy interface, most likely caused by stress created by the vertical discontinuity of the drag (Gambi et al. 1990, Nepf & Vivoni 2000). Visualization of flow around a section of A. chauvinii confirmed that turbulence at the apical tips was generated at velocities > 0.015 m s−1. However, the canopy profile did not resemble the
51
typical hyperbolic tangent profile characteristic of a mixing layer exhibited by seagrass canopies (Ghisalberti & Nepf 2002). Seagrass canopies show a range of energy within the sub-canopy, depending on the amount of shear near the top of the canopy and the extent to which the energy is transferred between the understory and overlying water. In the A. chauvinii canopy, the energy in the understory is relatively constant despite the changes in the outer flow, suggesting that the mixing between the overlying water and understory is limited, likely due to the high density or mesh-like morphology of the blades within this canopy. However, the increase in TKE observed at the top of the canopy may still be analogous to a mixing layer (i.e. a free shear layer not influenced by the substrate) rather than a perturbed substrate boundary layer, indicating that vegetative drag is not an extension of bed drag (Raupach et al. 1996, Ghisalberti & Nepf 2002). The influence of the canopy elements can be parameterized using a Reynolds number that compares inertia with viscous damping at the scale of the blade so that a blade Reynolds number (Reb) is given by using the blade length-scale (Lb, m) in the Reynolds number expression. Reb when calculated for the present situation of u = 0.1 m s−1, Lb = 0.01 m and kinematic viscosity (υ) = 10−6 m2 s−1, is 103 and, assuming Lb is a proxy also for blade spacing, suggests the canopy does not reduce the flow sufficiently to enter a Darcian porous medium flow regime (Reb < 40) where there is less open area for the flow of water (Zeng & Grigg 2006). Note that in this calculation we have not accounted for the effects of epibionts on Adamsiella chauvinii blades. From qualitative observations, only the oldest portion of the thallus were encrusted, mainly with crustose coralline algae, leaving the apical tips clean. Thus the contribution of epibionts to overall flow effects within the canopy was likely minor. The relative normalized hydrodynamic parameters and vertical variations obtained in the flume were comparable to those measured in the field despite the fact that the flume dimensions are such that they are unlikely to generate fully-developed canopy flow (e.g. Gambi et al.1990, Ghisalberti & Nepf 2009). This occurred primarily because the unidirectional flow in the flume was characteristic of the tidally driven flows that dominated the field site. At other sites Adamsiella chauvinii canopies may also experience oscillatory flow, for example during storm conditions; however the predominant flow experienced by A. chauvinii can be assumed to be steady as this algae generally inhabits sheltered harbors and in-
Aquat Biol 14: 41–56, 2011
52
lets (Adams 1994). There were some discrepancies between the flume and field measurements. Specifically normalized TKE was lower in the flume compared to that of the field measurements, which is not surprising since the flume is designed to generate a steady uniform flow in a constant direction and does not replicate all the processes responsible for turbulence generation that occur in the field. Nevertheless, as indicated by the spectral comparisons (Fig. 7) the systems are certainly comparable. Therefore our results indicate that at a basic level flume studies can be used to describe the hydrodynamic environment surrounding macroalgal canopies similar to those of A. chauvinii such as Caulerpa spp. (e.g. Hendriks et al. 2010) in the field. Our study quantifies differences in the frequency distribution of energy between the laboratory and the field flows. We found significant differences in energy between 0.5 and 5 Hz suggesting that, for example at u– b = 0.12 m s−1, eddies of the scale 0.02 to 0.2 m were being more strongly attenuated in the laboratory. The cause of these differences may be as simple as something like the greater fluctuations in the field background conditions smearing out a signal that is clear in the laboratory. Potentially, if the trough in the laboratory spectral ratio in Fig. 7A were to be modulated in frequency and then averaged, a weaker trough in the field data would result.
Mainstream velocities were attenuated by more than 95% within the lower half (Z/hc < 0.05) of the Adamsiella chauvinii assemblage (Fig. 3), so that momentum and energy entering the canopy were effectively reduced, suggesting that this near-bed region is dominated by viscous forces. Attenuation of flow within the canopy has been shown for other aquatic assemblages, both natural and simulated (e.g. Gambi et al. 1990, Ackerman & Okubo 1993, Leonard & Luther 1995, Shi et al. 1995, Koch & Gust 1999, Leonard & Croft 2006, Morris et al. 2008, Hendriks et al. 2010). Interestingly, although macrophyte canopies are thought to reduce coastal erosion by wave dampening (Mork, 1996, Løvås & Tørum 2001), few field measurements of flow attenuation within macroalgal canopies have been made (Table 1). Flow rates within canopies will be determined by the density and morphology of the species investigated. However, the degree of attenuation in a canopy of A. chauvinii was far greater than that observed in either seagrass or other aquatic macrophyte canopies, implying that the dense A. chauvinii canopy deflects the flow over and above the canopy to a greater degree. This deflection reduces the flow within the canopy and retards the boundary-layer flow to a much greater extent than in other aquatic canopies.
Table 1. Descriptive parameters of natural canopies and flows within and above them for marine marshes, seagrass beds, freshwater macrophytes and marine macroalgae. nd: not determined
Species Salt marsh plants Distichlis spicata Juncus roemerianus Spartina alterniflora
Density (m−2)
nd 100 stems 300 stems 128 stems 300 stems 250 stems
Height of Velocity above Velocity within % reduction canopy (m) canopy (m s−1) canopy (m s−1) in flow rate ~0.3 ~1.5 ~1.5 ~0.5 ~0.5 0.8−1.10
Spartina alterniflora Seagrass beds Zostera marina nd 2−3 Thalassia testudinum 1147 ± 33 shoots ~0.3 (current dominated) Thalassia testudinum 539 ± 40 shoots ~0.3 (wave dominated) Zostera marina 2650 ± 223 shoots 0.07 Freshwater macrophytes Batrachium peltatum All species have nd Callitriche cophocarpa stems with Elodea canadensis small leaves Marine macroalgae Adamsiella chauvinii ca. 220 g 0.1−0.15 Macrocystis pyrifera 0.14 ind. 20 Macrocystis pyrifera 0.89 ind. 5−90 Macrocystis pyrifera 0.09 ind. 7−90 Macrocystis pyrifera 0.89 ind. 5−90
Source
~0.1 0.09 0.09 0.04 0.04 nd
0.02−0.04 0.07 0.03 0.03 0.018 nd
80 23 67 25 55 50
0.15 0.045
0.01−0.02 0.015
80−90 87
Grizzle et al. (1996) Koch & Gust (1999)
0.17
0.05
70
Koch & Gust (1999)
0.09
nd
85
Peterson et al. (2004)
nd
nd
80−90
Sand-Jensen & Pedersen (1999)
0.015−0.2 nd nd nd nd
0.01 nd nd nd nd
> 95 30 67 70 75
This study Jackson & Winant (1983) Gaylord et al. (2007) Rosman et al. (2007) Fram et al. (2008)
Leonard & Luther (1995) Leonard & Luther (1995) Leonard & Luther (1995) Leonard & Croft (2006)
Kregting et al.: Macroalgal canopy effects on boundary layers
As a constant flow moves over the canopy, boundary friction generates eddies at a scale associated with the bed/canopy roughness and these eddies cascade to form smaller eddies (Kolmogorov’s spectrum with a f −5/3 slope) until they are dissipated through molecular viscosity. If waves are present, the spectrum will generally have a clear peak at the dominant wave frequency (e.g. Stevens et al. 2008, their Fig. 6) and may even dominate the canopygenerated energy. Our field data did not exhibit any evidence of wave activity; however, the data set is limited to calm conditions. However, there are other processes besides surface waves that result in an oscillating canopy. For example monami, due to feedback between the flow and the canopy (Nikora 2010), also result in oscillatory behaviour both in terms of velocity and blade motion. We did not observe a spectral peak associated with monami, which typically occurs at frequencies of 0.125 to 0.156 Hz (Ackerman & Okubo 1993), possibly because the alga is made up of many irregularly sized, randomly distributed blades, more analogous to a mesh than a uniform group of blades attached to a base such as seagrass. This mesh-like structure therefore effectively retards any ‘swaying’, which in turn inhibits the extent to which energy is transferred into the understory. Furthermore, the canopy has strong relatively uniform flow over the top of it but down within the canopy the notion of dominant flow direction almost disappears (Fig. 6B). Whether FR > 1 or < 1 will depend on both the metabolism of Adamsiella chauvinii and the flow velocity. When nutrient uptake rates are low, estimated FR was > 1 regardless of velocity, suggesting that the canopy is unlikely to be mass-transfer limited. However when nutrient uptake rates are high, FR was 1.2 under low flow conditions (uc = 0.01 m s−1), suggesting that tdepletion is comparable to tflush and the advective flux may not meet nutrient demand by the canopy. These results are in part similar to previous work on Macrocystis pyrifera canopies that demonstrated canopies were well-flushed for nitrate and therefore not likely mass-transfer limited (Fram et al. 2008). However, regardless of the mainstream flow, speeds in an A. chauvinii canopy are clearly reduced to very low levels that also frequently change direction (Figs. 5 & 6). This result may mean that water is retained longer in the canopy than our estimates of tflush, which assumed a constant flow direction, and that low flow speeds in the canopy are common. Moreover, slow flows within the canopy are likely to increase DBL thickness, influencing gradient-driven diffusion and nutrient supply (Hurd 2000).
53
Therefore mass-transfer limitation or FR < 1 may occur at canopy flow speeds greater than 0.01 m s−1 and is potentially a frequent occurrence during periods of increased metabolic activity. This analysis of advective nutrient supply versus demand does not account for (1) the spatial gradients (both horizontally and vertically) within the canopy, (2) reduction of light levels due to self-shading thereby influencing nutrient uptake (Gonen et al. 1994) and (3) the potential of Adamsiella chauvinii to obtain nutrients from other sources such as the sediment and organisms. Enhanced uptake of ammonium was observed at the leading edge of patches of the seagrass species Cymodocea nodosa and Zostera noltii where the currents and turbulence were highest (Morris et al. 2008). However, as TKE was strongly dissipated within the A. chauvinii canopy, nutrients from mainstream flows are not likely to be rapidly transferred to the inner regions of the canopy. Therefore inputs of nutrients into the lower half of the canopy may originate from the sediments, fauna and macroalgae (Cowan et al. 1996, Taylor & Rees 1998, Tyler et al. 2003, Hepburn & Hurd 2005) and are potentially an important source of nutrients for uptake by the older parts of the thallus as well as during periods of low flow and bulk seawater nutrient concentrations. In conclusion, our field and laboratory results show that small (< 0.2 m high) soft-sediment macroalgae enhances turbulence at the top of the canopy, but within the canopy this energy is absorbed so that its lower half is a region of low flow and mixing. The good agreement between the field- and flumederived flow measurements suggests that flume studies on flow−macroalgal interactions can be used to describe hydrodynamic processes that occur in the field. The gradient in flow (and mixing) between the upper and lower regions of the canopy not only affects nutrient supply but also will increase DBL thickness around the blades, thereby influencing gradient-driven diffusion. Our scaling analysis suggests that conditions of low flow and high metabolic demand in dense intermeshed macroalgal canopies can deplete nutrients more quickly than they can be replenished by advective flows. These results suggest that during periods of high growth these canopies may be mass-transfer limited and potentially have to utilize other nutrient sources to satisfy demand. Future work should focus on flow variability at scales around that of the canopy and also assess the flux of nutrients from the sediment and from invertebrates within the canopy to determine if in fact Adamsiella chauvinii is mass-transfer limited.
Aquat Biol 14: 41–56, 2011
54
Acknowledgements. We thank S. Bell, K. Schweikert and R. Ferrier who provided technical support and assistance in the field. C. Cornwall, J. Ackerman and 5 anonymous reviewers provided valuable comments that improved this manuscript. We also thank the Department of Marine Sciences, University of Otago, for use of their flumes and technical support. This study was supported by a Division of Science Award to L.T.K. and a University of Otago Research Grant to C.L.H.
➤ ➤
LITERATURE CITED
➤ Ackerman JD, Okubo A (1993) Reduced mixing in a marine ➤
➤
➤
➤
➤ ➤
➤ ➤
➤
➤ ➤
macrophyte canopy. Funct Ecol 7:305−309 Adams NM (1994) Seaweeds of New Zealand. Canterbury University Press, Christchurch Andersen KH, Mork M, Nilsen JEØ (1996) Measurement of the velocity-profile in and above a forest of Laminaria hyperborea. Sarsia 81:193−196 Carpenter RC, Hackney JM, Adey WH (1991) Measurements of primary productivity and nitrogenase activity of coral reef algae in a chamber incorporating oscillatory flow. Limnol Oceanogr 36:40−49 Cornelisen CD, Thomas FIM (2004) Ammonium and nitrate uptake by leaves of the seagrass Thalassia testudinum: impact of hydrodynamic regime and epiphyte cover on uptake rates. J Mar Syst 49:177−194 Cowan JLW, Pennock JR, Boynton WR (1996) Seasonal and interannual patterns of sediment-water nutrient and oxygen fluxes in Mobile Bay, Alabama (USA): regulating factors and ecological significance. Mar Ecol Prog Ser 141:229−245 Dean RG, Dalrymple RA (1991) Water wave mechanics for engineers and scientists. Advanced Series on Ocean Engineering, Vol 2. World Scientific, Singapore Falkowski PG, Raven JA (1997) Aquatic photosynthesis, 1st edn. Blackwell, Oxford Fogler HS (2006) Elements of chemical reaction engineering, 4th edn. Prentice Hall PTR, Upper Saddle River, NJ Fong P (2008) Macroalgal-dominated ecosystems. In: Capone DG, Bronk DA, Mulholland MR, Carpenter EJ (eds) Nitrogen in the marine environment, 2nd edn. Academic Press, San Diego, CA, p 917−947 Fonseca MS, Koehl MAR (2006) Flow in seagrass canopies: the influence of patch width. Estuar Coast Shelf Sci 67:1−9 Fram JP, Stewart HL, Brzezinski MA, Gaylord B, Reed DC, Williams SL, MacIntyre S (2008) Physical pathways and utilization of nitrate supply to the giant kelp, Macrocystis pyrifera. Limnol Oceanogr 53:1589−1603 Gambi MC, Nowell ARM, Jumars PA (1990) Flume observations on flow dynamics in Zostera marina (eelgrass) beds. Mar Ecol Prog Ser 61:159−169 Gaylord B, Rosman JH, Reed DC, Koseff JR and others (2007) Spatial patterns of flow and their modification within and around a giant kelp forest. Limnol Oceanogr 52:1838−1852 Ghisalberti M, Nepf HM (2002) Mixing layers and coherent structures in vegetated aquatic flows. J Geophys Res 107:3011, doi:10.1029/2001JC000871 Ghisalberti M, Nepf HM (2004) The limited growth of vegetated shear layers. Water Resour Res 40:W07502, doi:10.1029/2003WR002776 Ghisalberti M, Nepf HM (2009) Shallow flows over a perme-
➤
➤
➤ ➤ ➤
➤ ➤ ➤ ➤ ➤ ➤
➤
➤
able medium: the hydrodynamics of submerged aquatic canopies. Transp Porous Media 78:385−402 Gonen Y, Kimmel E, Friedlander M (1994) Attenuation of water velocity and incident light as a function of shape parameters in Gracilaria. J Appl Phycol 6:381−390 Grizzle RE, Short FT, Newell CR, Hoven H, Kindblom L (1996) Hydrodynamically induced synchronous waving of seagrasses: ‘monami’ and its possible effects on larval mussel settlement. J Exp Mar Biol Ecol 206:165−177 Hanisak MD (1983) The nitrogen relationships of marine macroalgae. In: Carpenter EJ, Capone DG (eds) Nitrogen in the marine environment, 1st edn. Academic Press, New York, NY, p 699−730 Hendriks IE, Bouma TJ, Morris EP, Duarte CM (2010) Effects of seagrasses and algae of the Caulerpa family on hydrodynamics and particle-trapping rates. Mar Biol 157:473−481 Hepburn CD, Hurd CL (2005) Conditional mutualism between the giant kelp Macrocystis pyrifera and colonial epifauna. Mar Ecol Prog Ser 302:37−48 Hepburn CD, Holborrow JD, Wing SR, Frew RD, Hurd CL (2007) Exposure to waves enhances the growth rate and nitrogen status of the giant kelp Macrocystis pyrifera. Mar Ecol Prog Ser 339:99−108 Hurd CL (2000) Water motion, marine macroalgal physiology, and production. J Phycol 36:453−472 Hurd CL, Stevens CL (1997) Flow visualization around single- and multiple-bladed seaweeds with various morphologies. J Phycol 33:360−367 Hurd CL, Quick M, Stevens CL, Laval BE, Harrison PJ, Druehl LD (1994) A low-volume flow tank for measuring nutrient uptake by large macrophytes. J Phycol 30: 892−896 Ikeda S, Kanazawa M (1996) Three-dimensional organized vortices above flexible water plants. J Hydraul Eng 122: 634−640 Jackson GA (1977) Nutrients and production of giant kelp, Macrocystis pyrifera, off southern California. Limnol Oceanogr 22:979−995 Jackson GA (1984) Internal wave attenuation by coastal kelp stands. J Phys Oceanogr 14:1300−1306 Jackson GA (1997) Currents in the high drag environment of a coastal kelp stand off California. Cont Shelf Res 17: 1913−1928 Jackson GA, Winant CD (1983) Effect of a kelp forest on coastal currents. Cont Shelf Res 2:75−80 Koch EW, Gust G (1999) Water flow in tide- and wavedominated beds of the seagrass Thalassia testudinum. Mar Ecol Prog Ser 184:63−72 Kregting LT (2006) The relative importance of mainstream water velocity and physiology (nutrient demand) on the growth rate of Adamsiella chauvinii. PhD thesis, University of Otago, Dunedin Kregting LT, Hepburn CD, Hurd CL, Pilditch CA (2008a) Seasonal patterns of growth and nutrient status of the macroalga Adamsiella chauvinii (Rhodophyta) in soft sediment environments. J Exp Mar Biol Ecol 360:94−102 Kregting LT, Hurd CL, Pilditch CA, Stevens CL (2008b) The relative importance of water motion on nitrogen uptake by the subtidal macroalga Adamsiella chauvinii (Rhodophyta) in winter and summer. J Phycol 44:320−330 Lenihan HS, Micheli F (2001) Soft-sediment communities. In: Bertness MD, Gaines SD, Hay ME (eds) Marine community ecology. Sinauer Associates. Sunderland, MA, p 253−287
Kregting et al.: Macroalgal canopy effects on boundary layers
➤ Leonard LA, Croft AL (2006) The effect of standing biomass ➤
➤ ➤
➤
➤ ➤ ➤ ➤ ➤ ➤
on flow velocity and turbulence in Spartina alterniflora canopies. Estuar Coast Shelf Sci 69:325−336 Leonard LA, Luther ME (1995) Flow hydrodynamics in tidal marsh canopies. Limnol Oceanogr 40:1474−1484 Lobban CS, Harrison PJ (1997) Seaweed ecology and physiology. Cambridge University Press, Cambridge Løvås SM, Tørum A (2001) Effect of the kelp Laminaria hyperborea upon sand dune erosion and water particle velocities. Coast Eng 44:37−63 Lowe RJ, Koseff JR, Monismith SG, Falter JL (2005) Oscillatory flow through submerged canopies: 2. Canopy mass transfer. J Geophys Res 110:C10017, doi:10.1029/2004JC 002789 Mork M (1996) The effect of kelp in wave damping. Sarsia 80:323−327 Morris EP, Peralta G, Brun FG, van Duren L, Bouma TJ, Perez-Llorens JL (2008) Interaction between hydrodynamics and seagrass canopy structure: spatially explicit effects on ammonium uptake rates. Limnol Oceanogr 53: 1531−1539 Nepf HM, Koch EW (1999) Vertical secondary flows in submersed plant-like arrays. Limnol Oceanogr 44:1072−1080 Nepf HM, Vivoni ER (2000) Flow structure in depth-limited, vegetated flow. J Geophys Res 105:28547−28557 Nikora V (2010) Hydrodynamics of aquatic ecosystems: an interface between ecology, biomechanics and environmental fluid mechanics. River Res Appl 26:367−384 Nowell ARM, Jumars PA (1984) Flow environments of aquatic benthos. Annu Rev Ecol Syst 15:303−328 Peterson CH, Luettich RA Jr, Micheli F, Skilleter GA (2004) Attenuation of water flow inside seagrass canopies of differing structure. Mar Ecol Prog Ser 268:81−92 Porter ET, Sanford LP, Suttles SE (2000) Gypsum dissolution is not a universal integrator of ‘water motion’. Limnol
➤ ➤ ➤
➤
➤ ➤ ➤
➤
55
Oceanogr 45:145−158 Priestly MB (1981) Spectral analysis and time series. Academic Press, New York, NY Raupach MR, Finnigan JJ, Brunet Y (1996) Coherent eddies and turbulence in vegetation canopies: the mixing-layer analogy. Boundary-Layer Meteorol 78:351−382 Reidenbach MA, Koseff JR, Monismith SG (2007) Laboratory experiments of fine-scale mixing and mass transport within a coral canopy. Phys Fluids 19:075107−075107-11 Rosman JH, Koseff JR, Monismith SG, Grover J (2007) A field investigation into the effects of a kelp forest (Macrocystis pyrifera) on coastal hydrodynamics and transport. J Geophys Res 112:C02016. doi:10.1029/2005JC003430 Sand-Jensen K, Pedersen O (1999) Velocity gradients and turbulence around macrophyte stands in streams. Freshw Biol 42:315−328 Shi Z, Pethick JS, Pye K (1995) Flow structure in and above the various heights of a saltmarsh canopy: a laboratory flume study. J Coast Res 11:1204−1209 Stevens CL, Taylor DI, Delaux S, Smith MJ, Schiel DR (2008) Characterisation of wave- influenced macroalgal propagule settlement. J Mar Syst 74:96−107 Taylor RB, Rees TAV (1998) Excretory products of mobile epifauna as a nitrogen source for seaweeds. Limnol Oceanogr 43:600−606 Tyler AC, McGlathery KJ, Anderson IC (2003) Benthic algae control sediment−water column fluxes of organic and inorganic nitrogen compounds in a temperate lagoon. Limnol Oceanogr 48:2125−2137 Vogel S (1994) Life in moving fluids, 2nd edn. Princeton University Press, Princeton, NJ Wheeler WN (1988) Algal productivity and hydrodynamics — a synthesis. Progr Phycol Res 6:23−58 Zeng Z, Grigg R (2006) A criterion for non-Darcy flow in porous media. Transp Porous Media 63:57−69
56
Aquat Biol 14: 41–56, 2011
Appendix 1.
Fig. A1. Three different scales of boundary layers that may surround a macroalgal canopy and their corresponding velocity profiles along a substrate. (A) The outer boundary layer, which is relatively unchanged by the presence of the canopy. (B) The canopy benthic boundary layer, which develops as the flow encounters a canopy. Flow in this region is attenuated within the canopy, while at the edges of the canopy, the shear between the slow-moving canopy fluid and the outer flow u generates a mixing layer. (C) The boundary-layer formation around each blade related to the no-slip condition. C: background nutrient concentration, u: longitudinal water velocity, u’: instantaneous velocity variation, As: aerial extent of the canopy, Vc: canopy volume, uc: velocity within the canopy, hc: height of canopy, δDBL: diffusion boundary layer thickness. Light grey lines: concentration profile; black lines: velocity profile; light grey shading: canopy; dark grey shading: macroalgal blades
Editorial responsibility: Matthias Seaman, Oldendorf/Luhe, Germany
Submitted: December 15, 2010; Accepted: August 2, 2011 Proofs received from author(s): November 16, 2011