Color profile: Generic CMYK printer profile Composite Default screen
962
Effects of age and anesthetic on plasma glucose and insulin levels and insulin sensitivity in spontaneously hypertensive and Wistar rats Erika R. Vera, Mary L. Battell, Sanjay Bhanot, and John H. McNeill
Abstract: We examined the effects of anesthetic, age, and strain on oral glucose tolerance tests (OGTT, 1 g/kg body weight) and intraperitoneal glucose tolerance tests (IPGTT, 2 g/kg body weight) in spontaneously hypertensive (SH) and Wistar rats. Pentobarbital anesthesia caused an elevation in basal glucose and insulin levels in Wistar rats at 9 and 16 weeks of age and in SH rats at 9 weeks. Anesthesia increased the insulin output during an OGTT in both strains of rats while glucose was unchanged. Anesthesia reduced the insulin sensitivity index calculated from the OGTT but not from the IPGTT data. The age of the rats (9–11 vs. 16–18 weeks) had no effect on the basal glucose or insulin levels, but older Wistar rats had a greater insulin output following oral glucose and older SH rats had a greater insulin output following intraperitoneal glucose. On the basis of the insulin sensitivity index, SH rats were clearly more insulin resistant than age-matched Wistar rats. The SH rats also had higher basal insulin levels, as well as higher insulin output, following both glucose challenges. In summary, SH rats are more insulin resistant than Wistar rats, and anesthesia, which elevated basal glucose and insulin levels and increased the insulin output in response to a glucose challenge, may increase insulin resistance. Key words: spontaneously hypertensive rats, insulin sensitivity index, anesthesia, age. Résumé : Nous avons examiné les effets de l’anesthésie, de l’âge et de la lignée sur des épreuves d’hyperglycémie provoquée par voie orale (HPO, 1 g/kg poids corporel) et intrapéritonéale (HPI, 2 g/kg poids corporel) chez des rats Wistar et des rats spontanément hypertendus (SH). Une anesthésie au pentobarbital a entraîné une augmentation des taux de glucose et d’insuline de base chez les rats Wistar à l’âge de 9 et de 16 semaines, et chez les rats SH à l’âge de 9 semaines. L’anesthésie a augmenté le débit d’insuline durant une HPO chez les deux lignées de rats, tandis que le débit de glucose est demeuré stable. L’anesthésie a réduit l’indice de sensibilité à l’insuline calculé à partir des données de l’HPO mais pas de l’HPI. L’âge des rats (9–11 vs. 16–18 semaines) n’a pas eu d’effet sur les taux de glucose ou d’insuline de base; toutefois, le débit d’insuline a été plus important chez les rats Wistar plus âgés après l’épreuve HPO, et chez les rats SH plus âgés après l’épreuve HPI. D’après l’indice de sensibilité à l’insuline, les rats SH ont été nettement plus résistants à l’action de l’insuline que les rats Wistar d’un même groupe d’âge. Les rats SH ont aussi eu des taux d’insuline de base et un débit d’insuline plus élevés après les deux épreuves. En résumé, les rats SH sont plus résistants à l’action de l’insuline que les rats Wistar, et l’anesthésie, qui a élevé les taux d’insuline et de glucose et augmenté le débit d’insuline en réponse à une épreuve de charge en glucose, pourrait augmenter l’insulinorésistance. Mots clés : rats spontanément hypertendus, indice de sensibilité au insuline, anesthésie, âge. [Traduit par la Rédaction]
Vera et al.
970
Introduction Glucose and insulin levels in rats are measured during oral glucose tolerance tests (OGTT) and intraperitoneal glucose tolerance tests (IPGTT). The procedures are sometimes performed on anesthetized rats, and rats of various ages and strains are used. We wanted to examine how these conditions would affect the insulin and glucose values seen. In addition, we used the method of Matsuda and DeFronzo
(1999) to calculate an insulin sensitivity index from both glucose tolerance tests. We were particularly interested in the spontaneously hypertensive (SH) rat, which has been used extensively to study blood pressure and the possible relationship between hypertension and hyperinsulinemia and insulin resistance. SH rats have been reported to be hyperinsulinemic and insulin resistant compared with their nonhypertensive counterparts (Chen et al. 1994; Bader et al. 1992). Other authors
Received 11 February 2002. Published on the NRC Research Press Web site at http://cjpp.nrc.ca on 4 October 2002. E.R. Vera, M.L. Battell, S. Bhanot,1 and J.H. McNeill.2 Faculty of Pharmaceutical Sciences, The University of British Columbia, 2146 East Mall, Vancouver, BC V6T 1Z3, Canada. 1 2
Present address: Director, Antisense Drug Discovery, Isis Pharmaceuticals Inc., Carlsbad, CA, 92008 U.S.A. Corresponding author (e-mail:
[email protected]).
Can. J. Physiol. Pharmacol. 80: 962–970 (2002)
I:\cjpp\Cjpp-80\80-10\Y02-124.vp Thursday, October 03, 2002 10:20:01 AM
DOI: 10.1139/Y02-124
© 2002 NRC Canada
Color profile: Generic CMYK printer profile Composite Default screen
Vera et al.
have concluded the SH rats are not insulin resistant (Buchanan et al. 1992a; Bhanot et al. 1994). Variability in the results was thought to be due to the use of anesthesia (Buchanan et al. 1992a). Effects of anesthesia on plasma glucose and insulin levels, glucose tolerance, and glucose metabolism have been extensively studied in various strains of rats but not in the SH strain. Aynsley-Green et al. (1973) demonstrated that the effects of different anesthetic agents were variable. For example, ether, halothane, pentobarbital, and ketamine all resulted in increases in the area under the glucose curve in response to intravenous glucose in fasted rats, but the degree of increase varied among the agents. Of the agents used, only halothane caused a significant increase in insulin area under the curve. Pénicaud et al. (1987) showed a small transient hyperglycemia 3 min following the induction of anesthesia with pentobarbital (50 mg/kg, i.p.). By 40 min, the level of glucose had returned to normal. No significant changes were seen in insulin levels up to 30 min following anesthesia. At the same time, glucose turnover decreased by 30% and there was a decrease in glucose utilization in postural muscles and in the brain. Johansen et al. (1994) showed an increase in plasma insulin at 30 min after pentobarbital anesthesia in fed rats but not in fasted rats, with no changes in plasma glucose at 10, 20, or 30 min. Lang et al. (1987) induced and maintained anesthesia for 4 h. They found that the rates of glucose appearance, recycling, and metabolic clearance were reduced in anesthetized rats, but that this was related to the hypothermia that was seen in the anesthetized rats within 30 min after the induction of anesthesia (pentobarbital, 30–40 mg/kg, i.v.). The question of in vivo insulin action and pentobarbital anesthesia was also examined by Clark et al. (1990), who reported that there was an initial transient elevation in plasma glucose levels, as well as a sustained suppression of basal hepatic glucose production. Clark reported that the effects of anesthetic on glucose production and basal and insulin-stimulated glucose turnover were not dependent on concomitant hypothermia. Wistar–Kyoto (WKY) rats are the genetic background from which the SH strain was derived and are almost always used as the controls in experiments involving SH rats. However, there are variations in SH rat insulin resistance compared with WKY rats as controls when different breeders are used as the source of the rats (Furukawa et al. 1998). Also, when SH rats are compared with both WKY and Wistar rats, there are clearly differences between WKY and Wistar rats (Katayama et al. 1997), including higher plasma glucose levels in WKY than in Wistar rats at 8 weeks of age. Because of the reported variability in the WKY rats, we chose to use Wistar rats as controls for the SH rats.
Materials and methods Animals A total of 32 animals were used for this experiment, 16 SH males obtained from Charles River Canada (SaintConstant, Que.) and 16 Wistar males from the Animal Care Centre, The University of British Columbia. Two groups of rats were received at 8 and 15 weeks of age and were housed separately by age and strain with two animals per cage. All
963
rats were housed and cared for following the guidelines of the Canadian Council on Animal Care. The rats were allowed to acclimatize for 1 week before the following procedures were carried out. OGTT Eight 9-week-old SH rats (191 ± 3 g body weight) and eight 9-week-old Wistar rats (316 ± 4 g) were fasted overnight (12 h) and subjected to an OGTT. A 40% glucose solution was prepared and administered by oral gavage (1 g/kg). The OGTT was performed in conscious animals; samples were taken at 0, 15, 30, 60, and 90 min after the glucose administration. Following a 4-d recuperation period, a second OGTT was performed on the same animals, which were anesthetized with pentobarbital (20 mg/kg). As soon as they showed signs of being sedated, the basal sample was taken; the glucose was then immediately administered by gavage. Samples were taken as described above. The rats were just emerging from anesthesia at the time that the last sample was taken. No efforts were made to control for changes in body temperature following anesthesia. Blood samples were immediately centrifuged and the plasma was separated and stored at –70°C until assayed. IPGTT One week later, at 10.5 weeks of age, the same group of animals underwent an IPGTT using 2 g glucose/kg body weight. While the dose of glucose is typically 1 g/kg body weight for an OGTT in rats, the dose for an IPGTT is usually 2 g/kg. Following a 4-d recuperation period, a second IPGTT was done in rats that were anesthetized as described above. Effect of age OGTTs, first without and then with anesthesia, followed by IPGTTs were done in a second group of animals, eight SH rats (303 ± 4 g) and eight Wistar rats (467 ± 8 g), beginning at 16 weeks of age. The younger animals will be referred to as 9 weeks of age throughout and the older rats will be referred to as 16 weeks of age. Assays Glucose was assayed using the glucose oxidase method using kits from Roche Diagnostics (Laval, Que). Insulin was assayed with a radioimmunoassay kit obtained from Linco Research Inc (St. Charles, Mo.). This kit has a rat insulin standard and an antibody raised against rat insulin. Insulin sensitivity index The insulin sensitivity index was calculated from the data obtained during the OGTTs and IPGTTs using the formula of Matsuda and DeFronzo (1999), except that the constant was set at 100 (instead of 10 000). The formula is Insulin sensitivity index =
100 (FPG ´ FPI ´ mean glucose ´ mean insulin)1/ 2
where FPG is fasting plasma glucose and FPI is fasting plasma insulin. With this formula, we obtained values between 4.5 and 35 in the various rats. © 2002 NRC Canada
I:\cjpp\Cjpp-80\80-10\Y02-124.vp Thursday, October 03, 2002 10:20:02 AM
Color profile: Generic CMYK printer profile Composite Default screen
964
Can. J. Physiol. Pharmacol. Vol. 80, 2002
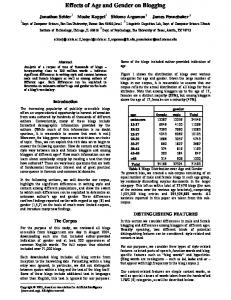
Fig. 1. (a) Spontaneously hypertensive (SH) and (b) Wistar (WIS) rats at 9 and 16 weeks of age underwent an oral glucose tolerance test (OGTT). After an overnight fast, a basal blood sample was taken and then the rats received 1 g glucose/kg body weight. Eight rats of each strain underwent an OGTT in the absence of anesthetic (NA); then, after a 4-d recovery period, underwent an OGTT in which 20 mg pentobarbital/kg was administered (A) prior to taking the basal blood sample. All blood samples were taken by nicking the end of the tail and expelling the blood into a heparinized capillary tube. Glucose and insulin were assayed as described in Materials and methods. Values shown are the means ± SE. *, basal values for insulin and glucose were higher in the rats that had received anesthetic (P < 0.05).
Statistical analysis The OGTT and the IPGTT were considered separate experiments and no comparisons were done between the two procedures. Analysis was done using general linear model ANOVA using anesthesia, strain of rat, and age of rats as three factors to examine basal glucose and insulin, the area under the glucose and insulin curves, and insulin sensitivity index. Where the three-factor analysis indicated a significant difference, an ANOVA was done on the same parameters at either 9 or 16 weeks of age so that differences due to anesthesia or strain could be compared using the Newman–Keuls multiple comparison test. To determine if age resulted in significant differences in the parameters, an ANOVA was performed either with or without anesthesia to give a two-factor analysis of age and animal strain. P < 0.05 was considered significant.
Results Oral glucose tolerance test Basal levels During an OGTT, the basal glucose levels were higher in both SH and Wistar rats when the rats received pentobarbital immediately prior to the collection of the basal sample (Figs. 1a and 1b, Table 1). This elevation in glucose levels was seen in Wistar rats at both 9 and 16 weeks of age but only at 9 weeks of age in the SH rats. Concomitantly with the elevated glucose levels, there was also an increase in the basal insulin levels when the blood sample was taken from the anesthetized SH and Wistar rats. Basal insulin levels were higher in SH than in Wistar rats at 9 weeks of age with or without anesthetic, and without anesthetic at 16 weeks of age (Table 1). The higher insulin levels in the SH rats did not correspond to consistent changes in the glucose levels, which were either higher (SH compared with Wistar rats, 9 weeks, without anesthetic) or lower (16 weeks, with anesthetic). There was no significant effect of the age of the rats on the basal glucose or insulin levels (Table 1). Area under the curve Anesthetic did not result in a change in the area under the glucose curve during an OGTT in either SH or Wistar rats at either age (Table 2). The presence of anesthetic did result in
an increase in the insulin area under the curve in both strains of rats at both ages. The area under the insulin curve was 1.5- to 1.7-fold higher in the SH as compared with Wistar rats at 9 weeks of age, regardless of the presence of anesthetic, but not at 16 weeks of age (Table 2). These greater areas under the insulin curves were accompanied by smaller areas under the glucose curve in the SH rats as compared with Wistar rats at 9 weeks of age. In the SH rats, the age of the rats (16 weeks compared with 9 weeks) did not result in a change in the area under the glucose curve and had no effect on the area under the © 2002 NRC Canada
I:\cjpp\Cjpp-80\80-10\Y02-124.vp Thursday, October 03, 2002 10:20:03 AM
Color profile: Generic CMYK printer profile Composite Default screen
Vera et al.
965
Table 1. Basal plasma glucose and insulin levels at the beginning of the oral glucose tolerance test. SH rats
Wistar rats
Age
Without anesthesia
With anesthesia
Without anesthesia
With anesthesia
Glucose (mmol/L) 9 weeks 16 weeks
6.59±0.19a 5.77±0.10
7.37±0.17b 6.60±0.03a
5.83±0.18 6.22±0.26
7.19±0.12b 7.70±0.44b
Insulin (ng/mL) 9 weeks 16 weeks
1.71±0.12a 1.54±0.12a
2.53±0.20a,b 1.85±0.11
0.53±0.08 1.00±0.14
1.44±0.25b 1.80±0.25b
Note: Blood samples were taken from SH and Wistar rats (n = 8) with or without anesthesia following an overnight fast. Pentobarbital was administered to the rats designated with anesthesia and the blood sample was taken as soon as the rats were sedated. There are no age-related differences. Values are means ± SE. a SH different from Wistar rats. b Significantly different from without anesthesia.
Table 2. Area under the glucose and insulin curves during the oral glucose tolerance test. SH rats With anesthesia
Without anesthesia
With anesthesia
Glucose (mmol·L–1·90 min–1) 9 weeks 708.7±10.8a 16 weeks 644.2±5.5
668.1±14.4a 623.5±13.0
764.0±16.0 726.4±39.4
748.5±9.7 725.8±43.4
Insulin (ng·mL–1·90 min–1) 9 weeks 209.5±13.7a 16 weeks 203.8±8.7
253.0±15.1a,b 250.3±11.1b
122.3±10.8 165.7±20.9c
170.5±10.5b 251.5±11.9b,c
Age
Without anesthesia
Wistar rats
Note: Blood samples were taken immediately prior to and at 15, 30, 60, and 90 min after the administration of glucose (1 g/kg body weight), as shown in Fig. 1. Values are means ± SE. a SH different from Wistar rats. b Significantly different from without anesthesia. c Significantly different from 9 weeks.
insulin curve, but the older Wistar rats put out a greater amount of insulin than the younger Wistar rats (Table 2). Intraperitoneal glucose tolerance test Basal levels The basal levels in the IPGTT were not different from those in the OGTT using a paired t test (Figs. 2a and 2b). Area under the curve Figure 2a shows the glucose and insulin curves during the IPGTT in the SH rats and Fig. 2b shows the curves obtained for the Wistar rats. Since the dose of glucose administered was twofold higher in the IPGTT than in the OGTT, the plasma glucose levels were greater at 15, 30, 60, and 90 min and the insulin levels were correspondingly greater. In our hands, the oral administration of glucose resulted in a more consistent elevation in plasma glucose than that obtained during the IPGTT. At 15 min in the OGTT, the glucose values ranged from 5.83 to 9.11 in the SH rats, while the values ranged from 7.00 to 27.02 in the IPGTT in the SH rats at 15 min. In some cases in the IPGTT, the glucose values did not rise substantially (e.g., one rat with a basal value of 6.06 mmol/L had a maximum value of 7.51 at 30 min). However, the insulin levels (14.43 ng/mL at 30 min com-
pared with 2.99 ng/mL basal) in this same rat indicated clearly that the glucose had been absorbed. This suggests that the absorption of the glucose from the intraperitoneal cavity was delayed in some cases. During an IPGTT using a dose of 2 g glucose/kg body weight (instead of the 1 g/kg used for the OGTT), anesthetic again had no effect on the area under the glucose curve in either strain of rat at either age (Figs. 2a and 2b; Table 3). The area under the insulin curve was increased by anesthetic in the SH rats. This had also been seen during the OGTT. In the Wistar rats, anesthetic did not increase the area under the insulin curve as it had during the OGTT. The strain of rat had a marked effect on the area under the insulin curve, except in the absence of anesthetic in the 9-week-old rats, where there was no significant difference between the strains (Table 3). In the presence of anesthetic at 9 weeks of age, and with or without anesthetic at 16 weeks of age, the area under the insulin curve was 1.7- to 1.9-fold higher in the SH than Wistar rats. The higher insulin output in the SH rats compared with the Wistar rats was not accompanied by lower glucose levels except in the anesthetized 9-week-old SH rats. In the absence of anesthetic, the older SH and Wistar rats did not have a greater area under the glucose curve, but this value was higher in both strains of rat when they had been © 2002 NRC Canada
I:\cjpp\Cjpp-80\80-10\Y02-124.vp Thursday, October 03, 2002 10:20:03 AM
Color profile: Generic CMYK printer profile Composite Default screen
966
Can. J. Physiol. Pharmacol. Vol. 80, 2002
Fig. 2. (a) Spontaneously hypertensive (SH) and (b) Wistar (WIS) rats at 9 and 16 weeks of age underwent an intraperitoneal glucose tolerance test (IPGTT). After an overnight fast, a basal blood sample was taken and then the rats received 2 g glucose/kg body weight. Eight rats of each strain underwent an IPGTT in the absence of anesthetic (NA) and, after a 4-d recovery period, underwent an IPGTT in which 20 mg/kg of pentobarbital was administered (A) prior to taking the basal blood sample. All blood samples were taken by nicking the end of the tail and expelling the blood into a heparinized capillary tube. Glucose and insulin were assayed as described in Materials and methods. Values shown are the means ± SE. *, basal values for glucose were higher in the rats that had received anesthetic (P < 0.05).
anesthetized at the beginning of the procedure (Table 3). Older SH rats had a higher area under the insulin curve than younger SH rats, but the age of the Wistar rats did not affect this value. Insulin sensitivity index The method of Matsuda and DeFronzo (1999) was used to calculate an insulin sensitivity index from the insulin and glucose values measured during the OGTT. This method has been shown to correlate well with values of insulin sensitivity obtained from euglycemic insulin clamp tests when performed with human subjects. The results are shown in Fig. 3. The SH rats overall were less insulin sensitive than Wistar rats, but this was not true for all comparisons within groups. This method was intended for data from an OGTT in normal to insulin-resistant humans. We have used it to examine the data from the IPGTT, as well as the data from the OGTT in rats. Oral glucose tolerance test Calculation of the insulin sensitivity index using the data from the OGTT indicates that the SH rats are more insulin resistant than the Wistar rats (Fig. 3). However, when each group (with or without anesthetic, 9 vs. 16 weeks) was compared with the same group of Wistar rats, only the SH rats at 9 weeks, regardless of anesthetic, were significantly more insulin resistant than the Wistar rats. Among the Wistar rats, anesthetic resulted in a significant drop in insulin sensitivity at both ages but had no effect on the SH rats (Fig. 3). There was no age-related change in insulin sensitivity. Intraperitoneal glucose tolerance test When the insulin sensitivity index was calculated from the data obtained from the IPGTT, SH rats were, again, significantly more insulin resistant than their Wistar counterparts (Fig. 4). However, the individual group comparisons showed a significantly greater insulin resistance in the SH rats compared with Wistar rats only at 9 weeks of age. While the OGTT data showed a significant effect of anesthetic, the same comparison of the data from the IPGTT showed no change (Fig. 4). The Wistar rats at 16 weeks of age were significantly more insulin resistant than their 9-week-old counterparts, but age did not result in a change in the SH rats (Fig. 4).
Discussion We have used the data from both an OGTT and an IPGTT to examine the question of insulin sensitivity and glucose tolerance in SH and Wistar rats. Effect of age There is a general assumption that older animals are less insulin sensitive than younger animals and that this would most often be seen as higher insulin output for similar glucose levels. There might also be somewhat higher glucose © 2002 NRC Canada
I:\cjpp\Cjpp-80\80-10\Y02-124.vp Thursday, October 03, 2002 10:20:04 AM
Color profile: Generic CMYK printer profile Composite Default screen
Vera et al.
967
Table 3. Area under the glucose and insulin curves during the intraperitoneal glucose tolerance test. SH rats With anesthesia
Without anesthesia
With anesthesia
Glucose (mmol·L–1·90 min–1) 9 weeks 1213.2±48.0 16 weeks 1270.6±109.9
927.7±78.9a 1352.3±107.9b
1425.3±47.3 1633.0±152.4
1229.2±75.3 1610.6±86.8b
Insulin (ng·mL–1·90 min–1) 359.7±37.0 9 weeks 16 weeks 635.8±67.7a,b
547.4±81.1a,c 870.1±94.1a,b,c
261.7±20.2 368.7±49.7
296.6±19.5 456.2±42.8
Age
Without anesthesia
Wistar rats
Note: Blood samples were taken immediately prior to and at 15, 30, 60, and 90 min following the intraperitoneal injection of glucose (2 g/kg body weight), as shown in Fig. 2. Values are means ± SE. a SH different from Wistar rats. b Significantly different than 9 weeks. c Significantly different from without anesthesia.
Fig. 3. Wistar (WIS) and spontaneously hypertensive (SH) rats were subjected to an oral glucose tolerance test as described in the legend to Fig. 1 and in Materials and methods. An insulin sensitivity index was calculated from the data as described by Matsuda and DeFronzo (1999). The data are shown as the means ± SE and were analyzed by general linear model ANOVA. Where ANOVA indicated a significant difference between groups, a Neuman–Keuls test was used to distinguish particular groups that differed from each other. P < 0.05 was taken as significant. Taken as a group, the Wistar rats were more insulin sensitive than the SH rats. Anesthesia reduced insulin sensitivity overall. Age had no overall effect on insulin sensitivity. Specific differences between groups are shown on the graph. 9 WK, 9-week-old rats; 16 WK, 16-week-old rats; A, anesthetic was used; NA, no anesthetic was used; a, with anesthetic was different from without anesthetic; b, SH rats were significantly different from Wistar rats.
Fig. 4. Wistar (WIS) and spontaneously hypertensive (SH) rats were subjected to an intraperitoneal glucose tolerance test as described in Fig. 2 and Materials and methods. An insulin sensitivity index was calculated from the data as described by Matsuda and DeFronzo (1999). The data are shown as the means ± SE and were analyzed by general linear model ANOVA. Where ANOVA indicated a significant difference between groups, a Neuman–Keuls test was used to distinguish particular groups that differed from each other. P < 0.05 was taken as significant. Taken as a group, the Wistar rats were more insulin sensitive than the SH rats. Anesthesia had no effect on insulin sensitivity. Younger rats were, overall, more insulin sensitive than older rats. Specific differences between groups are shown on the graph. 9 WK, 9-week-old rats; 16 WK, 16-week-old rats; A, anesthetic was used; NA, no anesthetic was used; a, older rats were significantly different from younger rats; b, SH rats were significantly different from Wistar.
levels. However, we found that the age of the rats (comparing 9–11 with 16–18 weeks of age) had a limited effect on the various parameters measured. The age of the rats did not affect the basal glucose or insulin levels in either strain of rat (Table 1). The 16-week-old Wistar rats secreted more insulin in response to an oral glucose challenge than did 9week-old rats (Table 2). During an IPGTT with a higher dose of glucose (2 vs. 1 g/kg), older SH rats had a higher in-
sulin output than younger rats (Table 3). The area under the glucose curve was greater for 16-week-old rats of both strains when the IPGTT was done in the presence of anesthetic. Somewhat surprisingly, the calculation of insulin sensitivity index following an oral glucose challenge revealed no age-related effect (Fig. 3). This might have had a different outcome if there had been a greater spread in age. The IPGTT, on the other hand, did indicate that the older © 2002 NRC Canada
I:\cjpp\Cjpp-80\80-10\Y02-124.vp Thursday, October 03, 2002 10:20:04 AM
Color profile: Generic CMYK printer profile Composite Default screen
968
Wistar rats were more insulin resistant than younger Wistar rats (Fig. 3). Reaven and Chang (1991) reported that plasma insulin levels were higher in 5-h-fasted 12- to 13-week-old SH rats than in 6- to 7-week-old SH rats. Katayama et al. (1997) reported that glucose intolerance in the SH rats was milder at 20 weeks than it had been at 12 weeks of age. Other authors have examined glucose and insulin levels in SH and Wistar rats at various ages (Katayama et al. 1997; Hulman et al. 1991; Preuss et al. 1998) but have not reported the comparisons on the basis of age. Effect of anesthetic Pentobarbital anesthesia very clearly affected various parameters from OGTTs and IPGTTs. Notably, there were higher basal glucose levels following administration of anesthetic in both SH and Wistar rats (Table 1). This increase was no longer apparent by 15 min in the SH rats with either oral or intraperitoneal glucose (Figs. 1 and 2). Basal insulin levels were also higher in the presence of anesthetic (Table 1). Our results on the effect of anesthetic on glucose levels agree with those of Pénicaud et al. (1987), in that we saw an initial elevation in plasma glucose levels shortly after the administration of pentobarbital anesthesia. It should be noted that Pénicaud’s rats were fasted for only 3 h and were receiving a glucose infusion at the time that the anesthetic was induced, while our rats were fasted for 12 h prior to administration of anesthetic and the collection of the basal samples. In contrast to Pénicaud, who saw no significant change in insulin levels at 3 min following anesthetic, our basal (12-h fasted) insulin values were higher in the presence of anesthetic than in its absence, except in SH rats that were 16 weeks of age (Table 1). Pénicaud et al.(1987) reported that both glucose production and glucose utilization decreased within 10–20 min of anesthetic administration, while glucose turnover was only mildly affected. Lang et al. (1987) reported reduced rates of glucose appearance, recycling, and metabolic clearance in anesthetized rats but only in those that were also hypothermic after 1 h of anesthesia. In spite of the higher anesthetic-related basal glucose levels, the area under the glucose curve was not higher in anesthetized compared with nonanesthetized SH or Wistar rats following either route of glucose administration (Tables 2 and 3). The glucose levels were brought back down by an increased insulin output in both strains of rat following the oral administration of glucose. When the glucose was administered intraperitoneally, there was an increased output of insulin only in the SH rats. When the insulin sensitivity index was calculated, the anesthetic had an effect only following oral administration of glucose (Fig. 3). Effect of strain SH rats were found to be significantly different from Wistar rats in several ways. Basal insulin levels were higher in SH rats than in Wistar rats (Table 1). The area under the insulin curve was higher in 9-week-old SH rats compared with Wistar rats following oral glucose (Table 2) and at both ages following intraperitoneal glucose administration (Table 3). The increased insulin output was accompanied by a reduced area under the glucose curve in the younger SH rats (Table 2). Calculation of the insulin sensitivity index following both routes of glucose administration indicated greater insulin re-
Can. J. Physiol. Pharmacol. Vol. 80, 2002
sistance in the SH rats (Figs. 3 and 4). The method of choice for determining insulin resistance is considered to be the euglycemic hyperinsulinemic clamp (Matsuda and Defronzo 1999). When this method was applied to the question of insulin resistance in SH rats, studies initially concluded that the SH rats were insulin resistant when compared with WKY rats (Reaven and Chang 1991; Rao 1993). Other studies, however, found that the SH rats were not insulin resistant when compared with WKY rats (Frontoni et al. 1992; Buchanan et al. 1992a,b; Farrace et al. 1996), as did a study from our laboratory (Bhanot et al. 1994). The primary difference between the first two references cited (Reaven and Chang 1991; Preuss et al. 1998) and the other citations (Bhanot et al. 1994; Rao 1993; Frontoni et al. 1992; Buchanan et al. 1992a; Buchanan et al. 1992b) was that anesthesia was not used in the latter studies. However, in some experiments with fully conscious, unrestrained rats, SH rats were found to be insulin resistant compared with WKY rats (Hulman et al. 1993; Pître et al. 1996). The variation in opinion within these studies seems to lie in precisely how the clamp was done. Taking data from the second 60 min compared with the first is more likely to lead to the conclusion of insulin resistance in SH rats (Rao 1993; Santuré et al. 2000). Rao (1993) examined the question using both (i) matched insulin infusion rates, which led to the conclusion that there was no difference in rate of disposal of glucose or hepatic glucose output, and (ii) matched plasma insulin levels, which led to the conclusion that the stimulation of glucose disposal by insulin was significantly impaired in SH rats over a range of insulin concentrations. Our calculation of the insulin sensitivity index as defined by Matsuda and DeFronzo (1999) is consistent with the conclusion that the SH rats are insulin resistant. This conclusion contrasts with the one that we reached in an earlier publication, where we concluded that SH rats were not insulin resistant (Bhanot et al. 1994). In that paper, we used WKY rats as controls, which may have led to the different conclusion. Part of the differences in outcome, both in our studies and in the other studies in the literature, may be due to the source of SH and WKY rats that were used, since Furukawa et al. (1998) found that SH rats were or were not insulin resistant compared with WKY rats, depending on the source of the rats. The choice of an appropriate control for SH rats is problematic. The SH rat was bred from Wistar rats at Kyoto University in 1963 (Okamoto and Aoki 1963). Some of these rats were provided to the National Institutes of Health, where a fully inbred line of SH rats was established and subsequently distributed as breeding stocks to commercial suppliers. The National Institutes of Health also obtained Wistar rats from Kyoto University and inbred this strain as WKY. The WKY rat was also distributed to commercial suppliers but before it was fully inbred. The history of the SH and WKY strains is reviewed by Kurtz et al. (1989) and by the Committee on the Care and Use of Spontaneously Hypertensive Rats, National Research Council (1976). Kurtz et al. (1989), and Samani et al. (1989) have examined WKY rats from various sources and found differences in the DNA fingerprints. These same authors also report differences in DNA fingerprints among the WKY rats from a single source. When SH rats from different sources were studied by DNA fingerprinting, Kurtz et al. (1989) and © 2002 NRC Canada
I:\cjpp\Cjpp-80\80-10\Y02-124.vp Thursday, October 03, 2002 10:20:04 AM
Color profile: Generic CMYK printer profile Composite Default screen
Vera et al.
Samani et al. (1989) found no differences. However, Nabika et al. (1991) did find variation in DNA fingerprints from SH rats from various sources. Matsumoto et al. (1991) examined biochemical markers in SH and WKY rats and found differences between the same strain from different sources. They report greater variability in biochemical markers from WKY rats than from SH rats. Kurtz and Morris (1987) reported that WKY rats from different sources varied in growth rate and in blood pressure, whereas the SH rats from these same sources were consistent. The differences in growth rate likely explain why the WKY rats were the same weight as agematched SH rats in some studies (Bhanot et al. 1994), but much heavier than the SH rats in other studies (Chen et al. 1994). Christe and Rodgers (1994) reported that the WKY rat is not uniformly normotensive and may exhibit premature heart failure and left ventricular hypertrophy. Katayama et al. (1997) reported that WKY rats were glucose intolerant when compared with Wistar rats following an IPGTT. In addition, there are now a number of papers that show insulin resistance in several tissues, including cardiovascular tissues (Santuré et al. 2000; Morisco et al. 2000), regardless of whether the study showed overall insulin resistance. In other words, a study may not show insulin resistance in the whole animal but may clearly indicate insulin resistance in particular tissues. In conclusion, the use of anesthetic had several effects on glucose and insulin levels in SH rats, where the effect has not previously been studied, and in Wistar rats. The effects include elevated basal (overnight fasted) glucose and insulin levels, increased insulin output following a glucose challenge, and a reduction in insulin sensitivity as measured during an OGTT. Previous reports in the literature on the effect of age (Katayama et al. 1997; Reaven and Chang 1991) have compared SH rats before and after development of hypertension (Reaven and Chang 1991) or at later ages, while we compared SH rats at two ages after the development of hypertension, and examined Wistar rats at the same ages. Sixteen-week-old Wistar and SH rats do not have a higher basal glucose or insulin level than 9-week-old counterparts. Older Wistar rats produce more insulin in response to an oral glucose challenge, while older SH rats produce more insulin in response to an intraperitoneal glucose challenge. Insulin sensitivity measured during an intraperitoneal glucose challenge is reduced in older rats compared with younger rats, especially in Wistar rats. We here report the first use of the insulin sensitivity index, as defined by Matsuda and DeFronzo (1999), to examine the question of insulin resistance in SH rats. There are several differences between age-matched SH and Wistar rats, including increased basal insulin levels, increased insulin output and lower glucose levels following both glucose challenges, and reduced insulin sensitivity as determined by both an OGTT and an IPGTT.
Acknowledgments We wish to thank the Heart and Stroke Foundation of B.C. and Yukon for financial assistance for this study. We thank Violet Yuen for excellent advice with respect to the statistical analysis of the data.
969
References Aynsley-Green, A., Biebuyck, J.F., and Alberti, K.G.M.M. 1973. Anaesthesia and insulin secretion: the effects of diethyl ether, halothane, pentobarbitone sodium, and ketamine hydrochloride on intravenous glucose tolerance and insulin secretion in the rat. Diabetologia, 9: 274–281. Bader, S., Scholz, R., Kellerer, M., Tippmer, S., Rett, K., Mathaei, S., Freund, P., and Haring, H.U. 1992. Normal insulin receptor tyrosine kinase activity and glucose transporter (GLUT 4) levels in the skeletal muscle of hyperinsulinemic hypertensive rats. Diabetologia, 35: 712–718. Bhanot, S., Bryer-Ash, M., Cheung, A., and McNeill, J.H. 1994. Bis(maltolato)oxovanadium(IV) attenuates hyperinsulinemia and hypertension in spontaneously hypertensive rats. Diabetes, 43: 857–861. Buchanan, T.A., Sipos, G.F., Madrilejo, N., Liu, C., and Campese, V.M. 1992a. Hypertension without peripheral insulin resistance in spontaneously hypertensive rats. Am. J. Physiol. 262: E14– E19. Buchanan, T.A., Youn, J.H., Campese, V.M., and Sipos, G.F. 1992b. Enhanced glucose tolerance in spontaneously hypertensive rats: pancreatic b-cell hyperfunction with normal insulin sensitivity. Diabetes, 41: 872–878. Chen, C., Hosokawa, H., Bumbalo, L.M., and Leahy, J.L. 1994. Mechanism of compensatory hyperinsulinemia in normoglycemic insulin-resistant spontaneously hypertensive rats. Augmented enzymatic activity of glucokinase in b-cells. J. Clin. Invest. 94: 399–404. Christe, M.E., and Rodgers, R.L. 1994. Altered glucose and fatty acid oxidation in hearts of the spontaneously hypertensive rat. J. Mol. Cell. Cardiol. 26: 1371–1375. Clark, P.W., Jenkins, A.B., and Kraegen, E.W. 1990. Pentobarbital reduces basal liver glucose output and its insulin suppression in rats. Am. J. Physiol. 258: E701–E707. Committee on Care and Use of Spontaneously Hypertensive Rats, National Research Council. 1976. Spontaneously hypertensive rats: guidelines for breeding, care, and use. Inst. Lab. Anim. Resour. News, 19: G1–G20. Farrace, S., Frontoni, S., Gambardella, S., Menzinger, G., and Rossetti, L. 1996. Effects of b-adrenergic blockade on insulinmediated glucose disposal in hypertensive and normotensive rats. J. Hypertens. 14: 1087–1092. Frontoni, S., Ohman, L., Haywood, J.R., DeFronzo, R.A., and Rossetti, L. 1992. In vivo insulin action in genetic models of hypertension. Am. J. Physiol. 262: E191–E196. Furukawa, L.N., Kushiro, T., Asagami, T., Takahashi, A., Kanmatsuse, K., and Ishikawa, K. 1998. Variations in insulin sensitivity in spontaneously hypertensive rats from different sources. Metabolism, 47: 493–496. Hulman, S., Falkner, B., and Chen, Y.Q. 1991. Insulin resistance in the spontaneously hypertensive rat. Metabolism, 40: 359–361. Hulman, S., Falkner, B., and Freyvogel, N. 1993. Insulin resistance in the conscious, spontaneously hypertensive rat: euglycemic hyperinsulinemic clamp study. Metabolism, 42: 14–18. Johansen, O., Vaaler, S., Jorde, R., and Reikerås, O. 1994. Increased plasma glucose levels after Hypnorm® but not after Pentobarbital® anesthesia in rats. Lab. Anim. 28: 244–248. Katayama, S., Inaba, M., Maruno, Y., Morita, T., Awata, T., and Oka, Y. 1997. Glucose intolerance in spontaneously hypertensive and Wistar–Kyoto rats: enhanced gene expression and synthesis of skeletal muscle glucose transporter 4. Hypertens. Res. 20: 279–286. © 2002 NRC Canada
I:\cjpp\Cjpp-80\80-10\Y02-124.vp Thursday, October 03, 2002 10:20:05 AM
Color profile: Generic CMYK printer profile Composite Default screen
970 Kurtz, T.W., and Morris, R.C., Jr. 1987. Biological variability in Wistar–Kyoto rats. Implications for research with the spontaneously hypertensive rat. Hypertension, 10: 127–131. Kurtz, T.W., Montano, M., Chan, L., and Kabra, P. 1989. Molecular evidence of genetic heterogeneity in Wistar–Kyoto rats: implications for research with the spontaneously hypertensive rat. Hypertension, 13: 188–192. Lang, C.H., Bagby, G.J., Hargrove, D.M., Hyde, P.M., and Spitzer, J.J. 1987. Alterations in glucose kinetics induced by pentobarbital anaesthesia. Am. J. Physiol. 253: E657–E663. Matsuda, M., and DeFronzo, R.A. 1999. Insulin sensitivity indices obtained from oral glucose tolerance testing. Diabetes Care, 22: 1462–1470. Matsumoto, K., Yamada, T., Natori, T., Ikeda, K., Yamada, J., and Yamori, Y. 1991. Genetic variability in SHR (SHRSR), SHRSP, and WKY strains. Clin. Exper. Hypertens. A13: 925–938. Morisco, C., Condorelli, G., Orzi, F., Vigliotta, V., DiGrezia, R., Beguinot, F., Trimarco, B., and Lembo, G. 2000. Insulinstimulated cardiac glucose uptake is impaired in spontaneously hypertensive rats: role of early steps of insulin signalling. J. Hypertens. 18: 465–473. Nabika, T., Nara, Y., Ikeda, K., Endo, J., and Yamori, Y. 1991. Genetic heterogeneity of the spontaneously hypertensive rat. Hypertension, 18: 12–16. Okamoto, K., and Aoki, K. 1963. Development of a strain of spontaneously hypertensive rats. Jpn. Circ. J. 27: 282–293.
Can. J. Physiol. Pharmacol. Vol. 80, 2002 Pénicaud, L., Ferré, P., Kande, J., Leturque, A., Issad, T., and Girard, J. 1987. Effect of anesthesia on glucose production and utilization in rats. Am. J. Physiol. 252: E365–E369. Pître, M., Nadeau, A., and Bachelard, H. 1996. Insulin sensitivity and hemodynamic responses to insulin in Wistar–Kyoto and spontaneously hypertensive rats. Am. J. Physiol. 271: E658–E668. Preuss, H.G., Zein, M., MacArthy, P., Dipette, D., Sabnis, S., and Knapka, J. 1998. Sugar-induced blood pressure elevations over the life span of three substrains of Wistar rats. J. Am. Coll. Nutr. 17: 36–47. Rao, R.H. 1993. Insulin resistance in spontaneously hypertensive rats. Difference in interpretation based on insulin infusion rate or on plasma insulin in glucose clamp studies. Diabetes, 42: 1364–1371. Reaven, G.M., and Chang, H. 1991. Relationship between blood pressure, plasma insulin and triglyceride concentration, and insulin action in spontaneous hypertensive and Wistar–Kyoto rats. Am. J. Hypertens. 4: 34–38. Samani, N.J., Swales, J.D., Jeffreys, A.J., Morton, D.B., Naftilan, A.J., Lindpainter, K., Ganten, D., and Brammar, W.J. 1989. DNA fingerprinting of spontaneously hypertensive and Wistar– Kyoto rats: implications for hypertension research. J. Hypertens. 7: 809–816. Santuré, M., Pitre, M., Gaudreault, N., Marette, A., Nadeau, A., and Bachelard, H. 2000. Effect of metformin on the vascular actions of insulin in hypertensive rats. Am. J. Physiol. 278: G682–G692.
© 2002 NRC Canada
I:\cjpp\Cjpp-80\80-10\Y02-124.vp Thursday, October 03, 2002 10:20:05 AM
Copyright of Canadian Journal of Physiology & Pharmacology is the property of Canadian Science Publishing and its content may not be copied or emailed to multiple sites or posted to a listserv without the copyright holder's express written permission. However, users may print, download, or email articles for individual use.