Effects of Elevated Intraocular Pressure on Outflow Facility and TIGR/MYOC Expression in Perfused Human Anterior Segments Teresa Borra ´ s,1 Laura Leigh S. Rowlette,1 Ernst R. Tamm,2 Johannes Gottanka,2 and David L. Epstein1 PURPOSE. To investigate the effects of high intraocular pressure (h-IOP) on TIGR/MYOC expression, extracellular matrix (ECM) deposition, and outflow facility (C) in perfused human anterior segment cultures. METHODS. Anterior segments of 31 pairs of normal human eyes from postmortem donors were perfused at constant flow (3 l/min). After reaching stable baseline, the flow of one eye from each of 31 pairs was raised to obtain a continuous pressure of 60 to 70 mm Hg for a period of 1 hour (3 pairs), 6 hours (10 pairs), 24 hours (2 pairs), 48 hours (3 pairs), and 7 days (13 pairs). Sixteen of these pairs were used to study trabecular meshwork expression of TIGR/MYOC and stromelysin by Northern blot analysis hybridization. Nine pairs (1 pair each at h-IOP for 1, 6, and 48 hours and 6 pairs at 7 days) were fixed at pressure for analysis by electron microscopy. Eyes selected for C measurements fulfilled the inclusion criteria of C0 values between 0.06 and 0.4, intact RNA recovery and normal light microscopy morphology. Percent change of facility from the baseline (C/C0) was computed at 6 and 24 hours and 2, 4, and 7 days from the long-term perfusion experiments (n ⫽ 9 h-IOP, n ⫽ 8 controls). RESULTS. No induction of TIGR/MYOC expression was observed after h-IOP for 1 and 6 h. A slight induction was seen after 24 and 48 hours. At 7 days, the treated eye from 4 of 5 pairs showed a clear induction, which was very pronounced in one of the pairs. In contrast, stromelysin expression was induced at 6 hours and not at 7 days. Morphometric electron microscopy after 7 days showed no significant difference in the amounts of fine fibrillar material or plaque material in the juxtacanalicular (JCT) region. The percent increase of C of the treated eye at 6 hours was 11.0% ⫾ 4.6% compared with 3.7% ⫾ 3.8% in the control eyes (P ⫽ 0.26). However, after longer time periods, the facility of the h-IOP eyes increased, whereas that of the contralateral eyes remained unchanged. This difference reached peak, significant values at 4 days (32.9% ⫾ 8.4% versus 7.4% ⫾ 7.6%, respectively; P ⫽ 0.04) and decreased to 8.9% ⫾ 7.9% versus 1.1% ⫾ 12.7% (P ⫽ 0.6) at 7 days.
From the 1Department of Ophthalmology, Duke University Medical Center, Durham, North Carolina; and 2Department of Anatomy II, University of Erlangen-Nu ¨ rnberg, Erlangen, Germany. Supported by National Eye Institute Grants EY11906, EY13126, and EY01894; Research to Prevent Blindness; and Deutscheforschungsgemeinschaft Grant SFB 539. TB is a Jules and Doris Stein Research to Prevent Blindness Professor Awardee. Submitted for publication April 11, 2001; revised July 25, 2001; accepted September 10, 2001. Commercial relationships policy: N. The publication costs of this article were defrayed in part by page charge payment. This article must therefore be marked “advertisement” in accordance with 18 U.S.C. §1734 solely to indicate this fact. Corresponding author: Teresa Borra´s, Duke University Medical Center, Wadsworth Building, Erwin Road, Box 3802, Durham, NC 27710;
[email protected]. Investigative Ophthalmology & Visual Science, January 2002, Vol. 43, No. 1 Copyright © Association for Research in Vision and Ophthalmology
CONCLUSIONS. Elevated IOP appears to cause a decrease in outflow pathway resistance at 1 to 4 days, and this effect seems to disappear with further time. In contrast, induction of TIGR/ MYOC appears to be strongest at 7 days. We speculate that this induction pattern might indicate a stress-related, rather than a possible homeostatic, role for the TIGR/MYOC protein. (Invest Ophthalmol Vis Sci. 2002;43:33– 40)
E
levated intraocular pressure (IOP), accompanying abnormalities in aqueous humor outflow resistance, is found in the majority of the glaucomas.1 Elevated IOP itself mechanically distorts the morphology of the outflow pathway2,3 and alters the expression of its cellular genes.4 Elevated IOP has also been suspected to affect the extracellular matrix (ECM), and some authors have hypothesized that abnormalities in the turnover of the ECM are key for the development of glaucoma.5,6 Much of the trabecular meshwork (TM) literature is oriented around the concept of “regulation” of outflow function and outflow facility by the “TM” tissue. Yet there is really scant physiological evidence for such “regulation.” In fact, in experimental perfusion studies of enucleated whole human eyes in vitro, it has been observed that the outflow facility actually declines, rather than increases, with increasing perfusion pressure.7–12 It might be argued that this observed decrease in outflow facility with elevated pressure could be an artifact of in vitro enucleated human eye perfusion, and yet with limited data from Grant and Becker,1,13 there seems to be reasonable evidence of a good correlation between outflow facility measurements in human eyes in vitro and in vivo. However, specific homeostatic experiments measuring outflow function in living human eyes (where, e.g., both inflow and outflow, venous pressure, and choroidal blood volume may all influence measured IOP) have not been unequivocally performed and are difficult to do, given the assumptions and variation in measuring outflow facility by tonography.1 It is noteworthy that outflow facility studies in nonhuman primate monkey eyes in vitro11 and in vivo14 –16 do not necessarily demonstrate this pressure-induced decrease in outflow facility, although such measurements are influenced by a superimposed “washout effect” that does not occur in human eyes in vitro. For homeostatic “adaptation” to elevated eye perfusion pressure, one would expect TM outflow facility to increase, rather than decrease. Based on the above-mentioned in vitro human experiments, there is proper concern that the TM might not, in fact, “self-regulate.” However, these in vitro human eye perfusion studies were conducted over very short time periods (i.e., hours) and, for the most part, used abnormally high levels of flow in constant pressure perfusion systems to generate the elevated “IOP.” Here, we have conducted studies in organ cultured human eyes (anterior segments) to learn what genes may be activated in the TM in response to the stress of elevated perfusion pressure. Because these experiments were conducted over 7 days in this viable preparation17,18 and used a constant flow 33
34
Borra´s et al.
IOVS, January 2002, Vol. 43, No. 1
system, we were very interested in learning what the physiological outflow facility response would be, if any, to the stress of this elevated IOP. It is known that fluid mechanical stimuli induce changes in gene expression in both normal and pathophysiological conditions.19 –21 Likewise in the human TM, using high-density cDNA arrays, we have observed that a perfused human anterior segment exposed to an elevated pressure for 6 hours induces important changes in gene expression.4 Recently, a novel protein, TIGR/MYOC, has been isolated from human TM cells after an extended exposure to dexamethasone.22,23 Mutations in this protein gene have been linked to juvenile-onset open angle glaucoma (JOAG) and to certain cases of primary open angle glaucoma (POAG).24,25 Though the function of TIGR/MYOC has not been fully elucidated, it has been observed that its expression in tissue culture is induced in response to several stress stimuli such as hydrogen peroxide26 and mechanical stretch.27 Because of the interest in TIGR/MYOC mutations relating to glaucoma, we were interested in investigating the effects of sustained high IOP (h-IOP) on the expression of this gene. We compared the expression of normal versus h-IOP TIGR/MYOC mRNA in the perfused human TM from postmortem donors. Given TIGR/MYOC’s secretory nature,28,29 we also wanted to study its effect on extracellular matrix formation. For this, we compared the extent of ECM material in the juxtacanalicular (JCT) region of control and h-IOP–treated tissues using electron microscopic morphometric analysis. We have sought potential correlations among molecular, morphologic, and physiological parameters in the h-IOP perfused human TM. We observed that TIGR/MYOC exhibits a delayed response to elevated IOP and hypothesize that this protein may have more of a stress-related function than one involving outflow facility homeostasis. In contrast, stromelysin is induced early, suggesting a likely different role in human TM. No significant changes occurred in the deposition of ECM after sustained pressure of 7 days. Finally, we observe that the human TM in this system appears to respond in a homeostatic manner to elevated IOP within a time period of 1 to 4 days, which is perhaps a longer time period than that previously hypothesized.
MATERIALS
AND
METHODS
Clones and Probes The TIGR/MYOC cDNA was originated from the human trabecular primary cell line HTM27 (donor age, 19 years) induced with 1 ⫻ 10⫺7 M dexamethasone for 10 days. Total RNA was obtained using RNAzol (Tel Test, Friendswood, TX), reversed transcribed with oligo-dT and amplified using the forward and reverse primers 98 and 99 (see sequence below). The resulting product was cloned into pCR 2.1 (Invitrogen, San Diego, CA; pJH5) and sequenced. The TIGR/MYOC cDNA probe used in the hybridization experiments contained 1603 bp and was obtained by PCR amplification of pJH5 with primers 98 and 99. The stromelysin cDNA corresponded to clone HTM1–304 from our human TM library.30 The hybridization probe contained 478 nucleotides (nt) and was obtained by PCR amplification with primers 178 and 179. Amplified products were purified using the QIAquick PCR Purification kit (QIAGEN, Chatsworth, CA) and labeled with [␣-32P]dCTP (NEN Life Science, Boston, MA) by random priming (Ready To Go DNA labeling kit; Pharmacia Biotech, Piscataway, NJ). Oligonucleotide 131 (see sequence below), complementary to the human 28S ribosomal RNA,31 was end-labeled with [␥-32P]ATP (NEN Life Science) using T4 polynucleotide kinase (GIBCO BRL, Rockville, MD) according to the manufacturer’s recommendations.
Perfused Anterior Segment Organ Culture A total of 31 pairs of normal human eyes were obtained from The National Disease Research Interchange (NDRI) and other (national and
local) eye banks. The tissue donations had the signed consent of the patients and followed the Tenets of the Declaration of Helsinki. The age of the donors was between 37 and 96 years old. Their eyes were dissected within 30 to 40 hours of death, and none of them had been diagnosed with glaucoma. Organ cultures were prepared as described previously.32,33 Briefly, eyes were bisected at the equator, and the lens, iris, and vitreous were removed. The anterior segment was then clamped to a modified Petri dish and perfused at 3 l/min constant flow using a Harvard microinfusion pump (Harvard Bioscience, South Natick, MA). Culture medium was Dulbecco’s modified Eagle’s medium containing 4.5 mg/ml glucose (GIBCO BRL), 100 U/ml penicillin, 0.1 mg/ml streptomycin, 170 g/ml gentamicin, and 250 g/ml amphotericin B. Anterior segments were maintained at 37°C, 5% CO2. IOP was continuously monitored with a pressure transducer connected to the dish’s second cannula and recorded with an automated computerized system. After allowing stabilization of the cultures (usually 24 hours), the flow of one eye was raised to obtain a pressure of 60 to 70 mm Hg for periods of time between 1 hour and 7 days. The flow of the contralateral eye was maintained at 3 l/min as a control. At the end of the experiment, anterior segments were either collected for RNA extraction or perfused at final pressure for electron microscopy studies.
RNA Extraction and Northern Blot Hybridization Anterior segments were frozen in liquid nitrogen within 2 minutes of turning off the perfusion pumps and stored at ⫺80°C. TMs were obtained under a dissecting microscope from the frozen anterior segments before the complete thawing of the specimen. The isolated tissue was then placed into a 1.5-mL microcentrifuge tube containing 350 l of guanidine thiocyanate buffer, homogenized with a disposable sterile pestle, and loaded onto a QIAshredder column (QIAGEN). Extraction continued using the RNeasy kit (QIAGEN), and RNA molecules selectively bound to the silica gel base were eluted with 30 l of RNase-free water. RNA samples from individual TMs were lyophilized to dryness, denatured in 50% formamide, and separated by 2.2 M formaldehyde, 1.25% agarose, 0.05 M 3-[N-morpholino] propane sulfonic acid (MOPS), 1 mM EDTA gel electrophoresis. After running, gels were washed with dH2O2 for 30 minutes and transferred to a nitrocellulose membrane (Schleicher & Schuell, Keene, NH) overnight by capillary action with 10⫻ sodium saline citrate (SSC). After the transfer, UV cross-linked blots were prehybridized at 42°C for 6 to 12 hours in a buffer containing 50% formamide, 5⫻ SSC, 5⫻ Denhardt’s, 50 mM NaPO4, pH 7.4, 0.1% sodium dodecyl sulfate (SDS) with 50 g/ml sheared, denatured salmon sperm DNA (Research Genetics, Huntsville, AL). The filters were then placed in fresh buffer, hybridized overnight to 1 to 5 ⫻ 106 cpm/ml of the TIGR/MYOC cDNA probe at the same temperature. After hybridization, filters were washed five times (15–20 minutes each): four times in 2⫻ SSC–1% SDS (two at room temperature [RT], two at 52°C) and once in 2⫻ SSC at 52°C. Exposure was conducted using BioMax MR x-ray film (Scientific Imaging Systems; Eastman Kodak, New Haven, CT) at ⫺80°C with intensifying screens. To monitor RNA degradation and loading, filters were subsequently rehybridized to 2 ⫻ 106 cpm/ml of 28S oligonucleotide at 42°C for 2 hours, washed twice in 2⫻ SSC–1% SDS (one at RT, one at 37°C), and exposed at RT. Images of films were captured using an Arcus II scanner (AGFA Division, Bayer Corporation, Wilmington, MA), and hybridization intensities were determined by scanning densitometry using the ImageQuant software (Molecular Dynamics, Sunnyvale, CA).
Sequences of Oligonucleotides Used in This Project 98: forward, 5⬘ GCG AAA GCT TTC CAG AGG AAG CCT 3⬘ (42– 62 nt TIGR/MYOC cDNA) 99: reverse, 5⬘ CCA GGA TCC CTG AGC ATC TCC TT 3⬘ (1645– 1623 nt TIGR/MYOC cDNA) 143: reverse, 5⬘ TGC CAT TGC CTG TAC AGC TT 3⬘ (1621–1602 nt TIGR/MYOC cDNA)
IOVS, January 2002, Vol. 43, No. 1 210: reverse, 5⬘ CAA TGT AAA GGG TTA TGT GAG ACC CAA C 3⬘ (2077–2050 nt TIGR/MYOC cDNA) 216: reverse, 5⬘ TAA GTT ATG GAT GAC TGA CAT GGC CTG G (299 –272 nt TIGR/MYOC cDNA) 178: forward, 5⬘ CAT CAG AGG AAA TGA GGT ACG AGC 3⬘ (1129 –1152 nt stromelysin cDNA). #179 reverse, 5⬘ AAG TTC CCT TGA GTG TGA CTC GAG 3⬘ (1607–1584 nt stromelysin cDNA) 131: reverse, 5⬘ AAC GAT CAG AGT AGT GGT ATT TCA 3⬘ (28S)31 TIGR cDNA nucleotide numbering is according transcription initiation site in Adam et al.34 Primer 98 contains three extra nucleotides at its 5⬘ end and a change from a G to an A in TIGR/MYOC nt 43 to create a HindIII restriction site. Primer 99 contains a change from a G to a T (reverse strand) in TIGR/MYOC nt 1639 to create a BamHI site. Stromelysin cDNA numbering is from GenBank accession no. NM 002422. (GenBank is provided by the National Center for Biotechnology Information, Bethesda, MD, and is available in the public domain at http://www.ncbi.nlm.nih.gov/genbank/)
Electron Microscopy Nine pairs (1 pair at h-IOP for 1 hour, 6 hours, and 2 days, respectively, and 6 pairs at 7 days) were fixed at pressure for analysis by electron microscopy. To preserve proper architecture of the tissue during the fixation procedure, eyes were fixed with 4% paraformaldehyde, 2% glutaraldehyde in 0.1 M phosphate buffer, pH 7.2, at pressure as follows. At the end of perfusion, the media of the anterior chamber was emptied and refilled with fixative. The incoming tubing was then connected to a fixative reservoir, the outcoming tube was clamped, and eyes were perfused overnight, each at the same pressure at which the eye originally had been treated. After perfusion fixation, the tissue was immersed in the same fixative and sent to Germany for electron microscopy. Wedges of meridional sections of the TM were postfixed in 1% osmium tetroxide, dehydrated with graded alcohols, and embedded in Epon. Semithin sections were stained with toluidine blue, and ultrathin sections were treated with lead citrate and uranyl acetate and examined using a Zeiss EM 902 electron microscope (Thornwood, NY). From each quadrant of seven pairs (1 pair each at h-IOP for 1 hour, 6 hours, and 2 days and 4 pairs at 7 days), at least one semithin and one ultrathin sections were analyzed. From two other pairs at 7 days, only one quadrant was available for electron microscopy, and four sections of each of these two quadrants were analyzed.
Morphometric Analysis All measurements were performed with the PC-based morphometric system Quantimed 500 (Leica, Cambridge, UK) by the same person (JG). From all four quadrants of four pairs of 7-day h-IOP eyes and their contralateral controls, one ultrathin section was analyzed. In addition, four sections from one quadrant of two other pairs of 7days at h-IOP and their contralateral controls were included. The other three quadrants of these pairs were not available for electron microscopy study because they were used for a parallel analysis of TIGR/MYOC expression. JCT Region. A 315-m area in the middle of the filtering area of the JCT was analyzed. This area corresponded to areas measured in previous studies6,35,36 and extended 7 m from the inner wall of the Schlemm’s canal (SC) into the JCT region and 45 m along the inner wall endothelium. The anterior and posterior ends of the Schlemm’s canal were avoided. Measurements were done at a magnification of ⫻3000 by tracing the regions of interest on a digitizing board. The analysis included the area covered by cells, spaces that were optically empty, and areas covered by extracellular material. Two types of extracellular material were defined and analyzed: sheath-derived plaques (“SD plaques”) and fine fibrillar material (“type I plaques”).37 Length of Inner Wall Filtration Area. The length of the filtration area across the inner wall of the SC was measured on two semithin sections from each different quadrant of 4 pairs of 7-day h-IOP
Effects of Elevated IOP on the Trabecular Meshwork
35
eyes and their contralateral controls. As a measure of the filtration area, the total distance between the anterior and posterior ends of SC was measured, as was the length of open SC lumen without septa or direct attachments between inner and outer wall. Measurements were done at a magnification of ⫻400 by tracing the distances on a digitizing board. The ratio of total SC length to open SC length was calculated. Finally, the means of the ratios from each individual eye were compared with that of the respective contralateral eye by a paired t-test (P ⬍ 0.05).
Outflow Facility Measurements of the Human Organ Cultures Pressures were recorded continuously for all eyes of the study. Outflow facility (C), also defined as the inverse of the resistance (R; C ⫽ 1/R), was calculated as the rate of the flow (F) divided by the IOP, P (Goldmann’s equation, C ⫽ F/P) and measured in l/min/mm Hg. Only eyes with a stable baseline for ⬎20 hours were used for these experiments. Those eyes selected for outflow facility measurements fulfilled the inclusion criteria of C0 values between 0.06 and 0.4 plus recovery of intact dissected TM RNA and/or normal morphology (assessed for the presence of TM cells in all regions of the TM tissue). Baseline facility (C0) was calculated from the average of three values obtained from pressure readings recorded at 30-minute intervals just before treatment. For C, outflow facility was calculated with pressures values obtained at 6, 24, and 48 hours and 4 and 7 days after sustained elevated pressure treatment. Data from each experiment were calculated as percent change of facility from the baseline, and results from each treated and untreated eye were combined into their group and expressed as the mean ⫾ SE. Experimental effects were statistically obtained by comparing the percent change in outflow facility of the experimental eyes to the percent change in facility of the controls by the Student’s t-test.
RESULTS TIGR/MYOC Transcripts The pooled total RNA from the TMs of one pair of eyes perfused for 24 hours at constant flow of 3m/min was divided in three aliquots and analyzed by Northern blot analysis hybridization. The lane hybridized to a full length TIGR/MYOC probe revealed that the gene has two transcripts, with approximate sizes of 2.0 and 1.8 kb. The higher molecular weight band was considerably more abundant and appears to correspond to the full length of the TIGR/MYOC cDNA (2098 nt; Fig. 1). To determine the nature of the two bands, the next two lanes of the blot were cut and hybridized separately to oligonucleotides corresponding to 5⬘ (216) and to 3⬘ sequences located between the last two polyA termination sites of the mRNA (210). Although the 5⬘ oligonucleotide hybridized to both bands, the 3⬘ one detected only the higher molecular weight one (Fig. 1). This result shows that transcription of the TIGR/MYOC in vivo resolves into at least two mRNA species by the use of different polyA termination sites. Because of the limits of gel resolution it is not possible at this time to determine whether all three or just two polyA termination sites present in the cDNA sequence are used. Both mRNA species include the full coding cDNA.
Expression of TIGR/MYOC under Elevated IOP Total RNAs from paired human TM samples corresponding to normal and elevated pressure were analyzed individually by Northern blot analysis hybridization with full-length TIGR/ MYOC cDNA and 28S control probes. A total of 16 pairs of anterior segment cultures were studied. Two pairs each corresponded to 1, 24, and 48 hours, and 5 pairs each corresponded to 6 hours and 7 days. For proper ratio evaluations, eyes from each pair were run in the same gel. Figure 2 shows the pho-
36
Borra´s et al.
IOVS, January 2002, Vol. 43, No. 1 detectable after 24 and 48 hours, whereas no induction was seen in the TM of eyes subjected at elevated pressure for 1 and 6 hours (Figs. 2A, 2B). Although the extent of TIGR/MYOC induction with elevated pressure varied within the individuals, the pattern of induction observed was the same in all samples studied. Figure 3 shows the scanning of TIGR/MYOC (fulllength transcript) and 28S bands from the blots of five pairs treated with elevated pressure for 7 days. In four of the five individuals (all but #27), a different extent of induction of TIGR/MYOC for each individual is clearly evident.
Distinct Pressure Induction of TIGR/MYOC and Stromelysin
FIGURE 1. Identification of TIGR/MYOC transcripts. Northern blot analysis of total TM RNA from 24 hours perfused human anterior segments. Each lane of the membrane was cut and separately hybridized to radioactive probes representing the full-length TIGR/MYOC cDNA (left panel), 5⬘ oligonucleotide (middle panel), and 3⬘ oligonucleotide (right panel). Although both transcripts hybridized to probes containing 5⬘ sequences, only the higher molecular weight TIGR/ MYOC transcript hybridized to the 3⬘-specific oligonucleotide.
tograph of an autoradiogram from a representative complete set of Northern blots containing control and treated samples at each of the elevated pressure time periods. Both TIGR/MYOC mRNA transcripts appear to be coregulated. Our results show a clear induction of TIGR/MYOC mRNA after 7 days of sustained elevated pressure. This marked induction was not apparent at earlier times. A slight induction of TIGR/MYOC was
Because of the potential relevance of TIGR/MYOC in the configuration of the ECM of the human TM and the well-established role of the metalloproteinase-3 stromelysin in such extracellular compartment, we compared the expression of both genes under identical pressure conditions. High-pressure tissue blots previously hybridized to TIGR/MYOC were allowed to decay for 6 weeks, exposed to confirm lack of radioactivity, and reprobed using a human TM cDNA stromelysin probe (see Material and Methods). Figure 4 demonstrates that pressure induction of these two genes is very different. After 6 hours of elevated pressure, in contrast to TIGR/MYOC, stromelysin mRNA is markedly induced. However, under conditions of a longer pressure insult, the induction of expression of each gene is reversed. At a time of a strong TIGR/MYOC induction (7 days), stromelysin expression is unaffected. This result suggests that both genes have a potential different role in TM function, especially regarding to the response of this tissue to a pressure insult.
FIGURE 2. Expression of TIGR/ MYOC in the TM of human anterior segments perfused at elevated pressure. (A) Representative set of Northern blots containing total RNA from single paired eyes hybridized to a TIGR/MYOC full-length probe. (B) Scanning densitometry of the Northern blots shown in (A). Top panel: scanning of the higher molecular weight transcript of TIGR/MYOC; bottom panel: scanning of the corresponding 28S transcript for control loading. One eye from each pair was subjected to elevated pressure (HP) whereas the contralateral eye was used as a control (C). TIGR/MYOC appears to be mostly induced after prolonged exposure to h-IOP.
IOVS, January 2002, Vol. 43, No. 1
Effects of Elevated IOP on the Trabecular Meshwork
37
FIGURE 3. Individual variation of TIGR/MYOC expression. Scanning densitometry of Northern blots containing perfused eye pairs from five different individuals subjected to elevated pressure for 7 days (pairs # 6, 11, 23, 27, and 28). Top: scanning of the higher molecular weight transcript of TIGR/MYOC; bottom: scanning of the corresponding 28S transcript for control loading. In four of the five individuals (all but #27), TIGR/MYOC was clearly induced by elevated perfusion pressure.
Electron Microscopy of the Perfused Human TM under Elevated IOP Electron microscopy of eyes at high pressure for 6, 24, and 48 hours (n ⫽ 3) showed no obvious differences in the morphology of TM cells between experimental and control eyes. Overall, the cells appeared to be healthy and viable. In some sections, the lumen of the SC and the distances between TM lamellae in the corneoscleral and uveal TM were narrower in h-IOP eyes than in controls. In the JCT, the extracellular spaces in both h-IOP eyes and controls were filled with ill-defined, fine granular material that seemed to consist of cellular debris. It was concluded that this material originated from other regions of the eye (e.g., ciliary body) and was washed from there into the TM. Because this material partially attached to the resident extracellular matrix, a clear distinction between fibrillar material, SD plaques and open spaces was not possible, and a morphometric analysis was not undertaken. TM cells in all eyes at h-IOP for 7 days (n ⫽ 6) showed a marked increase in rough endoplasmic reticulum and Golgi
FIGURE 4. Comparison of the expression of TIGR/MYOC and Stromelysin during elevated perfusion pressure conditions. Northern blot analysis of the total TM RNA from two pairs of eyes subjected to either 6 hours (left) or 7 days (right) elevated pressure. Each blot was hybridized subsequently to TIGR/MYOC, stromelysin, and 28S probes and allowed complete decay of radioactivity in between hybridizations. Stromelysin is induced after 6 hours, whereas induction of TIGR/MYOC occurs only after prolonged exposure.
vesicles when compared with TM cells of contralateral control eyes (Fig. 5). Cellular debris in the intercellular spaces was not observed. In some but not all sections, the lumen of the SC and the intertrabecular spaces were narrowed. In both h-IOP and control eyes, areas in which the inner and outer wall of SC had become attached were frequently observed. Morphometric analysis of the ratio between total length to open length of SC (as a measure of the area available for filtration across the inner wall of the SC) showed a significant difference only in one pair of the eyes, in which the length of the canal was shorter in the h-IOP eye. Morphometric analysis of the fibrillar and plaque material showed individual variability. The percent JCT area
FIGURE 5. Electron microscopy of the juxtacanalicular region in perfused organ cultured eyes after 7 days of high pressure. (A) Trabecular meshwork cells close to Schlemm’s canal (SC) endothelium contain prominent Golgi vesicles (black arrow) and rough endoplasmic reticulum (open arrow). Bar, 0.76 m. (B) The ECM close to the inner wall of SC consists of sheath-derived plaque material (black arrow) and fine fibrillar material (open arrows). Bar, 0.6 m.
38
Borra´s et al.
IOVS, January 2002, Vol. 43, No. 1
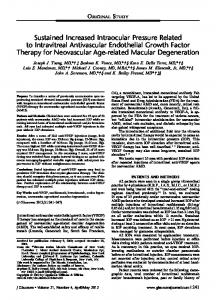
FIGURE 6. Effect of elevated pressure on the facility of outflow of postmortem human anterior segments perfused at constant flow. Outflow facility of the eyes subjected to high pressure for 7 days was calculated as the rate of flow divided by pressure at 6 and 24 hours and 2, 4, and 7 days. Percent changes are calculated from baseline values obtained before high pressure was initiated. h-IOP eyes (F, n ⫽ 9) showed an increase in outflow facility starting at 24 hours, reaching values of 32.9% ⫾ 8.4% at 4 days (P ⫽ 0.04) and returning close to 6-hour values at 7days (8.9% ⫾ 7.9%). Outflow facility in control eyes was unchanged (E, n ⫽ 8) and remained unchanged for the same period.
covered with fibrillar material was 6.2% ⫾ 1.5% in the h-IOP eyes versus 8.0% ⫾ 1.6% in the contralateral controls. The percent SD plaque material area was 23.6% ⫾ 3.5% in the h-IOP eyes versus 22.2% ⫾ 2.3% in the contralateral controls. The area covered with cells was 34.8% ⫾ 2.5% in the h-IOP eyes compared with 35.0% ⫾ 4.4% in the contralateral controls. None of the differences between h-IOP and control eyes were statistically significant.
Outflow Facility of Prolonged h-IOP Outflow facility values computed at 6, 24, and 48 hours and 4 and 7 days from eyes subjected to elevated pressure for 7 days and their controls are shown in Figure 6. Only eyes with baseline facilities between 0.06 and 0.4 were included in the analysis (n ⫽ 9 for the elevated pressure and n ⫽ 8 for the controls). The average facility at baseline was 0.13% ⫾ 0.02 (n ⫽ 17). At 6 hours, the percent change of C (C/C0) of the h-IOP eye was 11.0% ⫾ 4.6% versus 3.7% ⫾ 3.8% in the control eyes (P ⫽ 0.26). At 24 hours, the facility of the h-IOP eyes had increased compared with baseline to 26.1% ⫾ 6.0% versus 10.9% ⫾ 4.1% in the controls (P ⫽ 0.06). The difference between treated and untreated eyes continued to increase and became significant at 4 days, with values of 32.9% ⫾ 8.4% and 7.4% ⫾ 7.6%, respectively, compared with baseline (P ⫽ 0.04). At 7 days, the outflow facility returned toward earlier 6-hour values, with no significant difference between h-IOP eyes and
controls (8.9% ⫾ 7.9% versus 1.1% ⫾ 12.7%, P ⫽ 0.6). In addition, using a paired t-test, a statistically significant change was found for h-IOP eyes between outflow facility values at 6 hours and 2 days (P ⫽ 0.03), between 2 and 4 days (P ⫽ 0.04), and between 4 and 7 days (P ⫽ 0.006). Using the same baseline facility criteria, a second calculation was performed including all eyes subjected to elevated pressure, even if only for certain time periods (6 hours, n ⫽ 18; 24 hours, n ⫽ 12; 48 hours, n ⫽ 10; 4 and 7 days, n ⫽ 9). Results were similar to those obtained above. Higher outflow facility values were consistently seen at periods between 1 and 4 days. Thus, an increase in facility for the h-IOP–treated eyes was observed after 6 hours (18.4% ⫾ 6.2% versus 7.4% ⫾ 3.5%, P ⫽ 0.15 at 24 hours), peaked at 2 to 4 days (32.9% ⫾ 8.4% versus 7.4% ⫾ 7.6%, P ⫽ 0.04 at 4 days), and returned to earlier values at 7 days (8.9% ⫾ 7.9% versus 1.1% ⫾ 12.7%, P ⫽ 0.6). Differences between h-IOP and control eyes were significant after 48 hours and 4 days (P ⫽ 0.05 and 0.04, respectively; graph not shown). The increase in observed outflow facility was not correlated with either the absolute final pressure value (P) or the absolute net increase in pressure (P ⫺ P0). Table 1 shows the data for all the perfused eyes. Although an elevation of 37 mm Hg for 6 hours did not produce a significant change in facility (5%), a similar elevation of 35 mm Hg for 4 days resulted in a significant increase (32%). The final pressure readings in the two groups of eyes were 63 and 67 mm Hg, respectively.
DISCUSSION TIGR/MYOC expression in the human TM yields two transcripts of 2.0 and 1.8 kb. The smaller transcript is less abundant and corresponds to the utilization of an alternative polyA termination site located at position 1792 in the TIGR/MYOC cDNA. Three such polyA consensus sequences are present.38 The potential utilization of the intermediate polyA termination site at position 1941 cannot be definitely determined on these gels. Such transcript will have a molecular weight approximately 140 bp shorter or larger than the transcripts detected and will be on the limits of gel resolution. The 3⬘ untranslated regions (3⬘-UTRs) of mRNAs have been implicated in a variety of processes including mRNA degradation39 and intracellular localization of the mRNA.40 In this region, the presence of AU-rich sequences, especially AREs (AUUUA), has been shown to destabilize mRNA molecules.41 Two AREs are present between the two polyA sites of the TIGR/MYOC cDNA that perhaps could be involved in a partial degradation of the full-length transcript. However, at this time, the involvement of the 3⬘-UTR in TIGR/MYOC expression or its potential tissue specificity is unknown. In the human TM, both mRNA species appear to be coregulated by stress-related factors inducing expression of the protein, such as dexamethasone and elevated IOP. Our results on the induction of TIGR/MYOC with elevated IOP were not unexpected. Accumulating evidence indicates
TABLE 1. Comparison of Changes in Outflow Facility with Pressure h-IOP Eyes
Control Eyes
Time
n
% C/C0
P
⌬P
n
% C/C0
P
6 24 2 4 7
18 12 10 9 9
5⫾3 18 ⫾ 6 32 ⫾ 9 32 ⫾ 8 8⫾7
63 ⫾ 2 62 ⫾ 2 63 ⫾ 4 67 ⫾ 2 72 ⫾ 2
37 ⫾ 3 33 ⫾ 4 30 ⫾ 4 35 ⫾ 4 40 ⫾ 4
19 11 10 8 9
0.4 ⫾ 2 7⫾3 9⫾7 7⫾8 1 ⫾ 13
19 ⫾ 2 21 ⫾ 2 23 ⫾ 4 21 ⫾ 2 24 ⫾ 2
h h d d d
IOVS, January 2002, Vol. 43, No. 1 that TIGR/MYOC is a protein that can be induced, not only by glucocorticoids, but also by inducers of other stress proteins such as heat, H2O2, tetradecanoylphorbol acetate (PMA),26,27,42 and mechanical stretch.27 This induction occurs both at the transcriptional and translational level. An interesting finding though is the fact that the induction of TIGR/MYOC observed due to h-IOP was a late response. TIGR/MYOC was substantially induced only after 7 days of sustained elevated IOP. To further investigate this late response of TIGR/MYOC, we compared its expression to that of stromelysin, a TM metalloproteinase previously shown in high-density gene arrays to be induced after 6 hours.4 Our data would suggest that the response to h-IOP is very different for these two proteins, and only stromelysin could conceivable be involved in an early homeostasis response. In contrast, TIGR/MYOC expression could perhaps be considered as part of a protective response mechanism rather than a homeostatic one. We also observed that the extent of TIGR/MYOC pressure induction does vary among different individuals. At the present time we do not know if this difference in individual response might be related with an individual ability to handle a stressful insult and/or if this induction would also presumably apply to a TIGR/MYOC mutant. We have recently reported that TIGR/ MYOC mutants accumulate as insoluble aggregates inside the cell,43 suggesting that an elevated IOP induction could have implications in TM cell function and survival. Another aspect of the effects of elevated pressure was its effect on ECM deposition in the outflow pathway. On average, no significant differences in plaque and fibrillar material were observed between high pressure and normal eyes. Importantly, these results indicate that an elevated IOP for 7 days does not directly cause a substantial increase of electron dense ECM in the JCT. A significant increase in SD plaque material has been found in eyes with POAG when compared with age-matched controls,6 and it has been speculated that this increase might contribute functionally to the increase in outflow resistance in glaucoma. Our findings would support this concept because they indicate that the increase in SD plaque material observed in glaucoma is not likely a secondary effect of elevated IOP. No direct correlation was found on a small sample number comparing TIGR/MYOC expression with ECM deposition in the same pair of eyes (n ⫽ 2), although more samples would be needed to confirm this finding. Our data provide some evidence for the presence of adaptive mechanisms in perfused human TM. Beginning 6 hours after elevation of perfusion pressure (IOP), the outflow facility of h-IOP eyes begins to increase and reaches significant values at time periods between 1 and 4 days. Sometime between 4 and 7 days, outflow facility returns to the values in the control eyes. The presence of such a potential regulatory mechanism in the HTM to maintain IOP has long been hypothesized. However, in earlier studies, short-term pressure induced a decrease in C.7–12 Whether that was due to the in vitro experimental conditions is not clear. Addressing the resulting volume expansion of the globe with increasing pressure12 did not explain these in vitro results. In our experimental procedure, high pressure is obtained gradually (with an increasing flow rate), and it is possible this allows the TM meshwork to gradually adjust to the pressure stress. In addition, this organ culture system allows the evaluation of outflow facility changes with pressure over days rather than hours. The presence of homeostatic mechanisms in response to fluid mechanical stimuli has been extensively demonstrated at the molecular level in the vascular system.44 Considering the similarities of the TM and the vascular endothelium, the presence of such a mechanism in the TM would not be unex-
Effects of Elevated IOP on the Trabecular Meshwork
39
pected. Using high-density gene arrays, we have already shown that a number of the genes that are upregulated after 6 hours of elevated pressure in the HTM are the same as those involved in vascular permeability.4 Although we have not yet seen any significant physiological effect in our system at 6 hours, a trend toward increased facility was already present. It is possible that a homeostatic response had already begun and, at this time, could only be detected at the gene expression level. In summary, we conclude that experimentally produced elevation of IOP (by increasing the flow of perfusion medium in human anterior segments) reveals the presence of some type of adaptive mechanism in the human TM that acts to increase outflow facility at time periods from 1 to 4 days. This elevation in pressure causes an overexpression of the TIGR/MYOC gene but at a time when this presumed homeostatic mechanism seems to be no longer acting. We believe that these findings might contribute to the understanding of IOP regulation by the human TM and potentially to a better understanding of mechanisms underlying the development of elevated pressure glaucoma.
Note Added in Proof While our manuscript was under review, a manuscript by Bradley et al. was published in the June 2001 issue of IOVS (Invest Ophthalmol Vis Sci. 2001;42:1505–1513). Using similar perfused anterior segment organ cultures the authors reported that an increase of flow rate caused an initial linear increase of pressure that returned to starting values after a few days. Our results of a significant increase in outflow facility in response to 4 days of elevated IOP do agree with the Bradley study and with the concept of the presence of a homeostatic mechanism in the human trabecular meshwork.
References 1. Grant WM. Clinical measurements of aqueous outflow. Arch Ophthalmol. 1951;46:113–131. 2. Johnstone MA, Grant WM. Pressure-dependent changes in structures of the aqueous outflow system of human and monkey eyes. Am J Ophthalmol. 1973;75:365–383. 3. Grierson I, Lee WR. The fine structure of the trabecular meshwork at graded levels of intraocular pressure. (2) Pressures outside the physiological range (0 and 50 mm Hg). Exp Eye Res. 1975;20:523– 530. 4. Gonzalez P, Epstein DL, Borra´s T. Genes upregulated in the human trabecular meshwork in response to elevated intraocular pressure. Invest Ophthalmol Vis Sci. 2000;41:352–361. 5. Acott TS. Trabecular extracellular matrix regulation. In: Drance SM, Van Buskirk EM, Neufeld AH, eds. Pharmacology of Glaucoma. Baltimore: Williams & Wilkins; 1992:125–157. 6. Lu ¨ tjen-Drecoll E, Shimizu T, Rohrbach M, Rohen JW. Quantitative analysis of ‘plaque material’ in the inner- and outer wall of Schlemm’s canal in normal- and glaucomatous eyes. Exp Eye Res. 1986;42:443– 455. 7. Grant WM. Further studies on facility of flow through the trabecular meshwork. Arch Ophthalmol. 1958;60:523–533. 8. Van Buskirk EM, Grant WM. Lens depression and aqueous outflow in enucleated primate eyes. Am J Ophthalmol. 1973;76:632– 640. 9. Ellingsen BA, Grant WM. Influence of intraocular pressure and trabeculotomy on aqueous outflow in enucleated monkey eyes. Invest Ophthalmol. 1971;10:705–709. 10. Moses RA. The effect of intraocular pressure on resistance to outflow. Surv Ophthalmol. 1977;22:88 –100. 11. Hashimoto JM, Epstein DL. Influence of intraocular pressure on aqueous outflow facility in enucleated eyes of different mammals. Invest Ophthalmol Vis Sci. 1980;19:1483–1489. 12. Brubaker RF. The effect of intraocular pressure on conventional outflow resistance in the enucleated human eye. Invest Ophthalmol. 1975;14:286 –292. 13. Becker B, Frienwald JS. Clinical aqueous outflow. Arch Ophthalmol. 1953;50:557–571.
40
Borra´s et al.
14. Epstein DL, Freddo TF, Anderson PJ, Patterson MM, Bassett-Chu S. Experimental obstruction to aqueous outflow by pigment particles in living monkeys. Invest Ophthalmol Vis Sci. 1986;27:387–395. 15. Epstein DL, Freddo TF, Bassett-Chu S, Chung M, Karageuzian L. Influence of ethacrynic acid on outflow facility in the monkey and calf eye. Invest Ophthalmol Vis Sci. 1987;28:2067–2075. 16. Kiland JA, Peterson JA, Gabelt BT, Kaufman PL. Effect of DMSO and exchange volume on outflow resistance washout and response to pilocarpine during anterior chamber perfusion in monkeys. Curr Eye Res. 1997;16:1215–1220. 17. Johnson DH. Human trabecular meshwork cell survival is dependent on perfusion rate. Invest Ophthalmol Vis Sci. 1996;37:1204 – 1208. 18. Borra´s T, Matsumoto Y, Epstein DL, Johnson DH. Gene transfer to the human trabecular meshwork by anterior segment perfusion. Invest Ophthalmol Vis Sci. 1998;39:1503–1507. 19. Gimbrone MAJ, Resnick N, Nagel T, Khachigian LM, Collins T, Topper JN. Hemodynamics, endothelial gene expression, and atherogenesis. Ann NY Acad Sci. 1997;811:1–10. 20. Resnick N, Gimbrone MAJ. Hemodynamic forces are complex regulators of endothelial gene expression. FASEB J. 1995;9:874 – 882. 21. Davies PF. Flow-mediated endothelial mechanotransduction. Physiol Rev. 1995;75:519 –560. 22. Polansky JR, Kurtz RM, Fauss DJ, Kim RY, Bloom E. In: Krieglstein GK, ed. Glaucoma Update IV. Berlin, Heilderberg: Springer– Verlag; 1991:20 –29. 23. Nguyen TD, Chen P, Huang WD, Chen H, Johnson D, Polansky JR. Gene structure and properties of TIGR, an olfactomedin-related glycoprotein cloned from glucocorticoid-induced trabecular meshwork cells. J Biol Chem. 1998;273:6341– 6350. 24. Stone EM, Fingert JH, Alward WLM, et al. Identification of a gene that causes primary open angle glaucoma. Science. 1997;275:668 – 670. 25. Sarfarazi M. Recent advances in molecular genetics of glaucomas. Hum Mol Genet. 1997;6:1667–1677. 26. Polansky JR, Fauss DJ, Chen P, et al. Cellular pharmacology and molecular biology of the trabecular meshwork inducible glucocorticoid response gene product. Ophthalmologica. 1997;211:126 – 139. 27. Tamm ER, Russell P, Epstein DL, Johnson DH, Piatigorsky J. Modulation of myocilin/TIGR expression in human trabecular meshwork. Invest Ophthalmol Vis Sci. 1999;40:2577–2582. 28. Nguyen TD, Huang WD, Bloom E, Polansky JR. Glucocorticoid effects on HTM cells: molecular biology approaches. In: Lu ¨ tjenDrecoll E, ed. Basic Aspects of Glaucoma Research III. Stuttgart: Schattauer; 1993:331–343. 29. Caballero M, Rowlette LL, Borra´s T. Altered secretion of a TIGR/ MYOC mutant lacking the olfactomedin domain. Biochim Biophys Acta. 2000;1502:447– 460.
IOVS, January 2002, Vol. 43, No. 1 30. Gonzalez P, Epstein DL, Borra´s T. Characterization of gene expression in human trabecular meshwork using single-pass sequencing of 1060 clones. Invest Ophthalmol Vis Sci. 2000;41:3678 –3693. 31. Barbu V, Dautry F. Northern blot analysis normalization with a 28S rRNA oligonucleotide probe. Nucleic Acids Res. 1989;17:7115 32. Johnson DH, Tschumper RC. Human trabecular meshwork organ culture. A new method. Invest Ophthalmol Vis Sci. 1987;28:945– 953. 33. Borra´s T, Rowlette LL, Epstein DL. Adenoviral reporter gene transfer to the human trabecular meshwork does not alter aqueous humor outflow. Relevance for potential gene therapy of glaucoma. Gene Ther. 1999;6:515–524. 34. Adam MF, Belmouden A, Binisti P, et al. Recurrent mutations in a single exon encoding the evolutionarily conserved olfactomedinhomology domain of TIGR in familial open-angle glaucoma. Hum Mol Genet. 1997;6:2091–2097. 35. Gottanka J, Johnson DH, Martus P, Lu ¨ tjen-Drecoll E. Severity of optic nerve damage in eyes with POAG is correlated with changes in the trabecular meshwork. J Glaucoma. 1997;6:123–132. 36. Johnson D, Gottanka J, Flugel C, Hoffmann F, Futa R, Lu ¨ tjenDrecoll E. Ultrastructural changes in the trabecular meshwork of human eyes treated with corticosteroids. Arch Ophthalmol. 1997; 115:375–383. 37. Lu ¨ tjen-Drecoll E, Shimizu T, Rohrbach M, Rohen JW. Quantitative analysis of ‘plaque material’ between ciliary muscle tips in normaland glaucomatous eyes. Exp Eye Res. 1986;42:457– 465. 38. Ortego J, Escribano J, Coca-Prados M. Cloning and characterization of subtracted cDNAs from a human ciliary body library encoding TIGR, a protein involved in juvenile open angle glaucoma with homology to myosin and olfactomedin. FEBS Lett. 1997;413:349 – 353. 39. Brown BD, Harland RM. Endonucleolytic cleavage of a maternal homeo box mRNA in Xenopus oocytes. Genes Dev. 1990;4:1925– 1935. 40. Mowry KL, Melton DA. Vegetal messenger RNA localization directed by a 340-nt RNA sequence element in Xenopus oocytes. Science. 1992;255:991–994. 41. Chen CY, Shyu AB. AU-rich elements: characterization and importance in mRNA degradation. Trends Biochem Sci. 1995;20:465– 470. 42. Polansky JR, Fauss DJ, Zimmerman CC. Regulation of TIGR/MYOC gene expression in human trabecular meshwork cells. Eye. 2000; 14:503–514. 43. Caballero M, Borra´s T. Inefficient processing of an olfactomedindeficient myocilin mutant: potential physiological relevance to glaucoma. Biochem Biophys Res Commun. 2001;282:662– 670. 44. Gimbrone MAJ. Endothelial dysfunction, hemodynamic forces, and atherosclerosis. Thromb Hemost. 1999;82:722–726.