metals Article
Effects of Laser Offset and Hybrid Welding on Microstructure and IMC in Fe–Al Dissimilar Welding Giuseppe Casalino 1, * ID , Paola Leo 2 , Michelangelo Mortello 3 and Alessandra Varone 4 1 2 3 4
*
ID
, Patrizia Perulli 1
DMMM Politecnico di Bari, 70124 Bari, Italy;
[email protected] Dipartimento di Ingegneria dell’Innovazione, Universita del Salento, 73100 Lecce, Italy;
[email protected] Welding Engineering Research Centre, Building 46, Cranfield University, Bedfordshire MK43 0AL, UK;
[email protected] Department of Industrial Engineering, University of Rome “Tor Vergata”, Via del Politecnico 1, 00133 Rome, Italy;
[email protected] Correspondence:
[email protected]; Tel.: +39-080-5962753
Received: 27 June 2017; Accepted: 20 July 2017; Published: 25 July 2017
Abstract: Welding between Fe and Al alloys is difficult because of a significant difference in thermal properties and poor mutual solid-state solubility. This affects the weld microstructure and causes the formation of brittle intermetallic compounds (IMCs). The present study aims to explore the weld microstructure and those compounds over two different technologies: the laser offset welding and the hybrid laser-MIG (Metal inert gas) welding. The former consists of focusing the laser beam on the top surface of one of the two plates at a certain distance (offset) from the interfaces. Such a method minimizes the interaction between elevated temperature liquid phases. The latter combines the laser with a MIG/MAG arc, which helps in bridging the gap and stabilizing the weld pool. AISI 316 stainless steel and AA5754 aluminum alloy were welded together in butt configuration. The microstructure was characterized and the microhardness was measured. The energy dispersive spectroscopy/X-ray Diffraction (EDS/XRD) analysis revealed the composition of the intermetallic compounds. Laser offset welding significantly reduced the content of cracks and promoted a narrower intermetallic layer. Keywords: laser offset welding; hybrid welding; microstructure; intermetallic layer
1. Introduction Lightweight metals and their alloys are increasingly used as efficient structural materials. The reduction of the overall weight of a vehicle decreases the fuel consumption and carbon emissions. This accomplishment is highly requested for automotive, aerospace, and shipbuilding industries [1]. Aluminum is one of the most popularly used lightweight metal, thanks to its low density, good corrosion resistance, and excellent workability [2]. Replacing conventional steel components with hybrid dissimilar Al–Fe assemblies is beneficial to improve flexibility, vehicle energy efficiency, and cut down the manufacturing costs. Achieving a reliable fusion welded joint between Al and Fe alloys is challenging, due to the low mutual solid solubility and the large difference in thermal properties. This includes the melting points (660 versus 1535 ◦ C), the thermal conductivities (238 versus 77.5 W·m−1 ·K−1 ), and thermal expansion coefficients (23.5 × 10⁻⁶ and 11.76 × 10⁻⁶ /K). Additionally, the nearly-zero solid state solubility of Al in Fe, and the zero solubility of Fe in Al result in the formation of brittle intermetallic compounds (IMCs), which deteriorate the mechanical properties and form cracks [3,4]. According to Fe–Al phase diagram [5], IMCs include Fe-rich compounds (FeAl and Fe3 Al) and Al-rich compounds (FeAl2 , Fe2 Al5 , Metals 2017, 7, 282; doi:10.3390/met7080282
www.mdpi.com/journal/metals
Metals 2017, 7, 282
2 of 17
and FeAl3 ). The crystalline arrangement suffers from low mobility of dislocations and slip systems. Thus, the formation of Al–Fe phases plays a key role in achieving an effectual connection between the two metals, but the excessive formation of IMCs results in brittleness and degrades the strength of the joint [3]. Furthermore, a “strength-mismatch effect” was observed in between two different steels [6,7]. The mismatch characteristic of the weld is to ensure that the welded joint withstands in-service constraints and provides good weld quality [8]. Some authors demonstrated the feasibility of using friction stir welding (FSW) for producing tough Fe–Al welds [9–14]. However, laser welding is potentially a more attractive technology for dissimilar joining, mostly in automotive and aerospace applications, thanks to its high versatility, precision, and productivity. It exhibits locally focused energy delivery in a small spot size and high process speed, which provides a smaller weld pool, higher cooling rate, and a shorter reaction time for IMC growth. Since the thermal gradients and the reaction time determines the width of the IMC zone, one of the main concerns of researchers is the investigation of the welding conditions which minimize the growth of brittle phases. The control of temperature at the interfaces is fundamental for the right growth of the IMC layer. Meco et al., analyzed the transient thermal cycle of the laser–material interactions’ fundamental parameters. The growth and distribution of IMCs correlated with the thermal cycle [15]. Qin et al., developed a finite element model to investigate the temperature fields in the weld zone during laser-arc welding. They found that the distribution of the temperature and the reaction time is not uniform along the thickness, which leads to non-uniform IMC layers [16]. Gao et al., proved that the non-uniformity in the thickness and the irregular shape of the interface increase with the heat input [17]. Recent studies showed that the intermetallic bond is altered by post-welding heat treating the joint [18]. Apart from the extension of the reaction area, the properties of IMCs are hugely responsible for the weld resistance. Chen et al., proved that the interposition of a Ni-foil interlayer improves the toughness, even if additional IMCs form [19]. The composition of the filler material is highly influential on the seam properties. Mathieu et al., adopted a hot wire to improve the adhesion of the filler material at the interfaces and demonstrated how the welding conditions are responsible for the zone in which the fracture occurs [20]. Dharmendra et al., used a low-melting point Zn-15Al filler alloy, which exhibited good wetting properties [21]. Song et al., explored how the dynamics of Al-Si filler material at liquid state affect the morphology of the weld [22]. Finally, the interposition of Al-Si filler material during resistance spot welding was used in overlap configuration [23]. The combination between laser and arc into a hybrid process improves the process robustness and stability, enables deeper penetration, provides compensation for the geometrical defects and misalignments, and ensures tolerance in joint fit-up and wider control of weld metallurgy [24,25]. Among process parameters, the power distribution has proved to have a deep impact on the weld quality for similar and dissimilar welding [26–28]. The laser offset welding (LOW) was used to weld dissimilar assemblies. The beam focused on the top surface of one of the two materials to promote a liquid–solid interaction, which produces the bond. Such a method limited the growth of an IMC layer and promoted the diffusion through the liquid-solid boundary, without mixing liquid phases at elevated temperature. This approach was used for several dissimilar welds [29–33]. Pardal et al., reduced the mutual inter-diffusion and the thickness of IMCs by carrying out the dissimilar Al–Fe joining process in conduction mode. Aluminum melted but the steel did not, so a liquid–solid interface formed in the volume of the weld [34]. In this work, a comparative study between laser offset and hybrid laser welding of AA5754 and 316 stainless steel is presented. The morphology of the weld was revealed by visual inspection. The microstructure and interlayer were characterized by optical and electron microscopy. The phases and their distribution were identified by microhardness, which was compared with data available in the literature. The EDS/XRD analysis revealed the composition of the intermetallic compounds.
Metals 2017, 7, 282
3 of 17
The overall result showed an effective bond between aluminum and steel, if complex interactions are controlled and limited to a small amount. 2. Experimental Procedures 2.1. Material Properties and Weld Configuration Metals 2017, 7, 282
3 of 17
In this study, the butt weld geometry was used for testing the weldability of a dissimilar Al–Fe 2. Experimental Procedures weld. The dimensions of the sheets (length × width × thickness) were 100 × 50 × 3 mm3 for the aluminum sheet and 100 × 50 × 2 mm3 for the steel one. The difference in plate thickness was chosen to 2.1. Material Properties and Weld Configuration improve the wettability of aluminum on the steel. 0.8 mm diameter AISI 316 steel filler wire was used In this study, the butt weld geometry was used for testing the weldability of a dissimilar Al–Fe for the hybrid laser-arc process. Tables 1 and 2 show the characteristics of the as-received materials. 3 weld. The dimensions of the sheets (length × width × thickness) were 100 × 50 × 3 mm for the aluminum sheet and 100 × 50 × 2 mm3 for the steel one. The difference in plate thickness was chosen Table 1. Chemical composition of the as-received materials (wt %). to improve the wettability of aluminum on the steel. 0.8 mm diameter AISI 316 steel filler wire was used for the hybrid laser-arc process. Tables 1 and 2 show the characteristics of the Metal C Al Cr Mn Mo Mg Ni Ti P S Si Fe as-received materials.
AISI 316 AA5754
0.08 -
Metal
18 2 3 14 0.045 0.03 balanceTable0.30 0.50 composition 0.15 - %). 1. Chemical of3.6 the as-received materials (wt
C
Al
Cr
Mn
Mo
Mg
Ni
Ti
P
S
Si
1 0.40
balance 0.40
Fe
Table 2. Properties of the as-received tensile (YS), Young AISI 316 0.08 18 materials: 2 3 ultimate 14 -strength 0.045(UTS), 0.03 yield 1 stress balance module (E), elongation to fracture %( A%), Vickers microhardness (HV), thermal conductivity (K), AA5754 balance 0.30 0.50 3.6 - 0.15 0.40 0.40 Liquidus Temperature (TL ), density (ρ), specific heat capacity (c). Table 2. Properties of the as-received materials: ultimate tensile strength (UTS), yield stress (YS), Young elongation A%), Vickers microhardness thermalρ conductivity UTSmodule (MPa) (E),YS (MPa) toEfracture (GPa) %(A% HV K (W/(m·K)) (HV), TL (◦ C) c (J/(g·◦ C)) (g/cm3 ) L), density (ρ), specific heat capacity (c). (K), Liquidus Temperature (T AISI 316 580 290 193 50 178 16.3 1400 8 0.5 AA5754 230 (MPa) 80(MPa) 17 62 147 600 ρ (g/cm2.66 3) Metal UTS YS E68 (GPa) A% HV K (W/(m·K)) TL (°C) c (J/(g·°C)) 0.9 Metal
AISI 316 AA5754
580 230
2.2. The Welding Procedures
290 80
193 68
50 17
178 62
16.3 147
1400 600
8 2.66
0.5 0.9
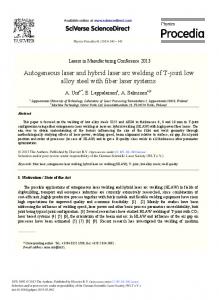
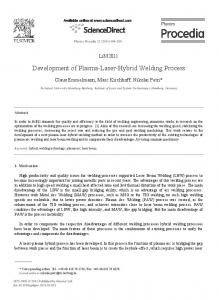
2.2.welds The Welding The were Procedures produced using two different technologies: the laser offset welding (LOW) and welds were produced usingusing two different the laser welding andside at a the hybrid The laser-MIG welding. When LOW, technologies: the laser source wasoffset focused on(LOW) the steel hybrid(offset) laser-MIG welding. When using LOW,(Figure the laser1). source wasinvestigation, focused on thethe steeloff-set side atvalue a certain the distance from the bimetal interface In this was certain distance (offset) from the bimetal interface (Figure 1). In this investigation, the off-set value about 1 mm from the laser beam axis. The keyhole moved along a linear path, parallel to the interface. was about 1 mm from the laser beam axis. The keyhole moved along a linear path, parallel to the The heat transferred to the aluminum side through the steel heat affected zone, as shown in Figure 2. interface. The heat transferred to the aluminum side through the steel heat affected zone, as shown The thermal energy fromspreading the keyhole thecaused fusionthe of fusion the aluminum. In thisInway, the in Figure 2. Thespreading thermal energy from caused the keyhole of the aluminum. steel fusion zone steel molten the aluminum-fused zone, which this way, the(FZ) steelseparated fusion zonethe (FZ) separated thepool steelfrom molten pool from the aluminum-fused zone,avoided which avoided the excessive growththe ofexcessive the IMCgrowth layer. of the IMC layer.
1. Schematic illustrationof ofthe the laser laser offset (LOW) technique procedure. FigureFigure 1. Schematic illustration offsetwelding welding (LOW) technique procedure.
Focusing the beam on the steel plate instead of the aluminum one is advantageous because it
Focusing the beam oncontrol. the steel plate instead of the depends aluminum one is advantageous because it enables better process The stability of the keyhole on the balance of different force which includeThe recoil pressure thekeyhole vaporized material,on pressure inside the cavity, enablescontributions, better process control. stability ofofthe depends the balance of different force surface tension, pressure, and weight of molten metal. If the process is not largely robust and stable,
Metals 2017, 7, 282
4 of 17
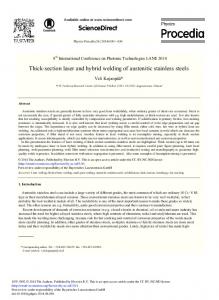
contributions, which include recoil pressure of the vaporized material, pressure inside the cavity, surface tension, pressure, and weight of molten metal. If the process is not largely robust and stable, Metals 2017, 7, 282 4 of 17 small deviations of the process conditions from the design point, might compromise the stability of the Metals 2017, 7, 282 4 of 17 small deviations of the process conditions fromliquid the design point, might compromise the stability keyhole, leading to collapse and uncontrolled and thermal flows. Aluminum plate is of highly the keyhole, leading to collapse and uncontrolled liquid and thermal flows. Aluminum plate is highly reflective to beam radiation and exhibits high diffusivity, making it difficult to keep the process small deviations of the process conditions from the design point, might compromise the stability of stable reflective to beam radiation and exhibits high diffusivity, making it difficult to keep the process stable the keyhole, leading to collapse uncontrolled liquid and thermal flows.than Aluminum plate the is highly during the weld. Thus, even if the and melting point of aluminum is lower steel one, process has during the weld. Thus, even if theexhibits melting point of aluminum is it lower than steel one, the process reflective to beam radiation and high diffusivity, making difficult to keep the process stablehas been been conducted by focusing the beam on the steel side, in opposition to brazing principles. conducted byThus, focusing beam on the steel in opposition to brazing principles. during the weld. eventhe if the melting point of side, aluminum is lower than steel one, the process has On the other hand, during laser-MIG hybrid welding (Figure3)3) the laser-arc coupled source On the other hand, during laser-MIG hybrid welding (Figure the laser-arc coupled source was was been conducted by focusing the beam on the steel side, in opposition to brazing principles. directed straight to the weld centerline and it moved along that line. After preliminary trials, the directed straight to the weld centerline and it moved along that line. After preliminary trials, the wire On the other hand, during laser-MIG hybrid welding (Figure 3) the laser-arc coupled source was wire was positioned at a 1 mm distance from the laser focus. The laser and arc combination promotes positioned at a 1 mm distance from the laser focus. The laser and arc combination promotes a directed straight to the weld centerline and it moved along that line. After preliminary trials, the wire stable wire deposition, any spatter generation. was positioned at a without 1 without mm distance from the laser focus. The laser and arc combination promotes a a stable wire deposition, any spatter generation. stable wire deposition, without any spatter generation.
Figure 2. Schematic drawing for describing joiningmechanism mechanism by the LOW technique. Figure 2. 2. Schematic drawing for describing joining mechanism the LOW technique. Figure Schematic drawing for describing the the joining bybythe LOW technique.
3. Schematic illustrationofoflaser-MIG laser-MIG (Metal gas) technique procedure. FigureFigure 3. Schematic illustration (Metalinert inert gas) technique procedure.
Figure 3. Schematic illustration of laser-MIG (Metal inert gas) technique procedure. Before welding, the sheets were machined at low milling speed, which reduced the thermal Before welding, the sheets were at low low milling milling speed, which reduced the thermal Before welding, the sheets weremachined machined speed, reduced the thermal contact resistance. Dust and contaminants were removed by cleaning withwhich acetone.
contact resistance. Dust and contaminantswere were removed removed by acetone. contact resistance. Dust and contaminants bycleaning cleaningwith with acetone. 2.3. Set-Up of the Welding Systems
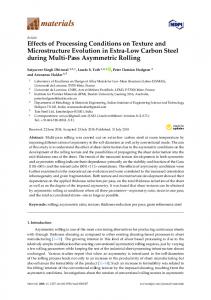
2.3. Set-Up the Welding Systems 2.3. Set-Up of theofdifferent Welding Systems Two laser systems were used to perform the trials: For laser offset welding, it consisted of a 6-axis robot, a stationary shielding box system and a
different laser systems were usedtotoperform perform the the trials: Two Two different laser systems were used trials: workbench with clamps and supporting table (Figure 4). A YLS-4000 Yb-doped fiber laser For laser equipped offset welding, it consisted of a 6-axis robot, a stationary shielding box system and a Forwith laser offset welding, it consisted of a 6-axis robot, a(IPG stationary shielding box system and a a wavelength of 1070 nm and a maximum power of 4 kW Laser GmbH, Barbuch, Germany) workbench equipped with clamps and supporting table (Figure 4). A YLS-4000 Yb-doped fiber laser workbench equipped with clamps and supporting table (Figure 4). A YLS-4000 Yb-doped fiber was used in continuous wave regime. The fiber had 200 μm diameter, while the optics (focal lens and laser with a wavelength of 1070 nm and a maximum power of 4 kW (IPG Laser GmbH, Barbuch, Germany) with awas wavelength of 1070 nm and a maximum power of 4 kW (IPG Laser GmbH, Barbuch, Germany) used in continuous wave regime. The fiber had 200 μm diameter, while the optics (focal lens and was used in continuous wave regime. The fiber had 200 µm diameter, while the optics (focal lens and
Metals 2017, 7, 282 Metals 2017, 7, 282
5 of 17 5 of 17
Metals 2017, 7, 282 5 of 17which collimator) provided a magnification factor of 2, resulting in roughly a 0.4 mm beam diameter, 2 width method, near-Gaussian distribution. was calculated by the 1/e collimator) provided a magnification factor of 2, resulting in roughly a 0.4 mm beam diameter, which
collimator) provided a magnification factor of 2, resulting in roughly a 0.4 mm beam diameter, which
was calculated by the 1/e2 width method, near-Gaussian distribution. was calculated by the 1/e2 width method, near-Gaussian distribution.
Figure 4. Overall experimental set-up.
Figure Figure4.4. Overall Overallexperimental experimentalset-up. set-up.
For hybrid laser welding, a CO2 laser (Rofin, Hamburg, Germany) whose maximal power was
hybrid laser welding, CO2 laser laser (Rofin, Hamburg, Germany) whose maximal power was 3For kWhybrid was used operating in continuous wave mode. The focusing mirror was parabolic and itpower had a was For laser welding, aaCO (Rofin, Hamburg, Germany) whose maximal 2 3 kW was used operating in continuous wave mode. The focusing mirror was parabolic and it had 160 mm radius. A laser beam coaxial argon shielding gas is used, which is advantageous for arc 3 kW was used operating in continuous wave mode. The focusing mirror was parabolic and it hada stability. Figure shows the laser-MIG coupling. AA5laser beam coaxial shielding which is is advantageous advantageous for for arc arc a160 160mm mmradius. radius. laser beam coaxialargon argon shielding gas gas is is used, used, which stability.Figure Figure55shows showsthe thelaser-MIG laser-MIGcoupling. coupling. stability.
Figure 5. Laser-MIG coupling.
2.4. Process Parameters Figure 5.5. Laser-MIG coupling. Laser-MIG coupling. Preliminary bead-on-plate testsFigure were conducted to find out the process parameters that enabled the weld formation. The process parameters and their levels are summarized in Table 3. The overall 2.4. Parameters 2.4. Process Process Parameters power used for the hybrid welding (laser power + MIG power) was 3420 W (versus 2500 W used for laser welding). Preliminary Preliminarybead-on-plate bead-on-platetests testswere wereconducted conductedto tofind findout outthe theprocess processparameters parametersthat thatenabled enabled
the theweld weldformation. formation. The The process process parameters parameters and and their their levels levels are are summarized summarized in in Table Table3.3.The Theoverall overall power powerused usedfor forthe thehybrid hybridwelding welding(laser (laserpower power++ MIG MIG power) power) was was 3420 3420 W W (versus (versus 2500 2500 W W used usedfor for laser laserwelding). welding).
Metals 2017, 7, 282
6 of 17
Metals 2017, 7, 282
6 of 17
Table 3. Experimental plan. plan. Table 3. Experimental
Laser Offset Welding Laser Offset Welding Hybrid Laser-MIG Welding
Hybrid Laser-MIG Welding
Laser LaserPower Power (kW) (kW) 2.5 2.5 3.42
3.42
Welding Speed Welding (m/min) Speed (m/min) 2 2 2
2
Wire Feed Speed Wire Feed (m/min) Speed (m/min) 1.2
1.2
Current
Current (A) (A) 80
80
Voltage
Voltage (V) (V) 24
24
2.5. Metallographic Analysis and Mechanical Testing 2.5. Metallographic Analysis and Mechanical Testing Weld cross sections were cold mounted and then they were grinded and mechanically polished cross sections were cold mountedwas andanalyzed then theyby were grinded mechanically polished usingWeld a variable speed. The microstructure Epiphot 200and Optical Microscope (OM, using a variable speed. The microstructure was analyzed by Epiphot 200 Optical Microscope Nikon, Tokyo, Japan) and EVO scanning electron microscope (SEM, Zeiss, Oberkochen, Germany), (OM, Nikon, Japan) and EVO scanning electron microscope (SEM, Zeiss, Oberkochen, equipped withTokyo, an energy-dispersive X-ray spectrometer (EDS, Bruker AXS Inc, Madison, WI, USA). Germany), equipped with an energy-dispersive X-ray spectrometer (EDS, Bruker AXS Inc, Madison, The samples were prepared by a standard metallographic procedure, which involved etching with WI,following USA). The samples were prepared by a standard metallographic procedure, which involved the reagents: etching with the following reagents: • Keller’s solution (1 ml HF, 1.5 mL HCl, 2.5 mL HNO3, and 95 mL H2O) for • aluminum Keller’s solution (1 mL HF, 1.5 mL HCl, 2.5 mL HNO3 , and 95 mL H2 O) for microstructure. aluminum microstructure. • Vilella’s solution (1 g picric acid, 5 mL HCl, 100 mL ethanol) for steel microstructure. • Vilella’s solution (1 g picric acid, 5 mL HCl, 100 mL ethanol) for steel microstructure. Vickers micro-hardness tests with a load of 0.1 Kg (AffriWiky 200JS2) were carried out to estimate local mechanicaltests properties of ofwelds and intermetallic phases created at the Vickers micro-hardness with a load 0.1 Kg (AffriWiky 200JS2) were carried out to estimate steel/aluminum local mechanicalinterface. properties of welds and intermetallic phases created at the steel/aluminum interface. X-ray diffraction diffractionmeasurements measurements were carried outa Rigaku on a Rigaku diffractometer with CuKα were carried out on diffractometer with CuKα radiation ◦ /s radiation = 0.154 X-ray diffraction were collected at a scanning rate ofin0.02°/s in 2θ (λ = 0.154(λ nm). The nm). X-rayThe diffraction data weredata collected at a scanning rate of 0.02 2θ ranging ◦ with ranging to 100° with count s in zone the fusion zone of both theand aluminum andInsteel from 20◦from to 10020° count time 1.0 s time in the1.0 fusion of both the aluminum steel sheet. the ◦ sheet. In the thin intermetallic layer, the X-ray diffraction data were a scanning of thin intermetallic layer, the X-ray diffraction data were collected at a collected scanningat rate of 0.02 /srate in 2θ ◦ with 0.02°/s 2θ ranging from 20°count to 55°time with6.0 count ranginginfrom 20◦ to 55 s. time 6.0 s. 3. Base Base Material Material Characterization Characterization 3. The optical optical micrograph AA5754 Al–Mg alloy was supplied in annealed and recrystallized state. The (Figure 6) shows the aluminum matrix (solid solution phase) together with a series of intermetallic precipitates. Based on previous works [35–37], it can be concluded that the acicular shape, light gray (Figure 6), 6), while while the the rounded rounded shape shape dark gray particles consist of fragile particles are (Fe,Mn)Al66 (Figure (Fe,Mn)33SiAl SiAl1212(Figure (Figure6). 6).The Thelarger largerblack blackparticles particles are are Mg Mg22Si Si(Figure (Figure 6), 6), while while the the smaller smaller ones ones are Al33[35,36]. [35,36]. Mg22Al
Figure Figure 6. 6. Optical Optical micrograph micrograph of of AA5754 AA5754 base base material. material. Light Light gray gray acicular acicular shape shape particles particles (Fe,Mn)Al (Fe,Mn)Al66,, rounded shape dark dark gray gray particles particles(Fe,Mn) (Fe,Mn)3SiAl SiAl12,, black particles Mg Mg2Si, smaller ones ones are are Mg Mg2Al Al3.. rounded shape black particles Si, the the smaller 3
12
2
2
3
The microstructure of the 316L base material is presented in Figure 7, showing an equiaxed, twinned microstructure. Annealing twins (induced by heat treatment) and deformation twins are
Metals 2017, 7, 282
7 of 17
Metals 2017, 7, 282
7 of 17
The microstructure of the 316L base material is presented in Figure 7, showing an equiaxed, typical of austenitic stainless steels, which are characterized by low stacking fault energy (SFE). The Metalsmicrostructure. 2017, 7, 282 7twins of 17 are twinned twins array (induced by heat treatment) deformation low SFE austenitic steelAnnealing induces a planar of dislocations during the and deformation, promoting typical of austenitic stainless steels, which are characterized by low stacking fault energy deformation twinning. The twin boundaries are barriers to the dislocation slipping, which increases(SFE). typical of austenitic stainless steels, which are characterized by low stacking fault energy (SFE). The The low SFE austenitic steel induces a planar array of dislocations during the deformation, promoting the strain-hardening rate [36]. low SFE austenitic steel induces a planar array of dislocations during the deformation, promoting deformation twinning. The twin barrierstotothe thedislocation dislocation slipping, which increases deformation twinning. The twinboundaries boundaries are are barriers slipping, which increases the strain-hardening raterate [36]. the strain-hardening [36].
Figure 7. Polarized light micrograph base material of 316L stainless steel showing austenitic structure with twins. Figure 7. Polarized light micrograph base material of 316L stainless steel showing austenitic structure
Figure Polarized light micrograph 4. Laser7.Off-Set Welding Results base material of 316L stainless steel showing austenitic structure with twins. with twins. The morphology of the cross section of the joint produced by laser offset welding is shown in 4. Laser8.Off-Set Figure At this Welding stage, theResults sample was weakly etched, which permitted focusing the analysis on the 4. Laser Welding Results beadOff-Set shape. Detailed microstructural features were resolved later. The morphology of the cross section of the joint produced by laser offset welding is shown in Full penetration was achieved. The undercut at the top surface was prevented, while the bottom Figure 8. At this stage, the cross samplesection was weakly which permitted focusing analysisisonshown the The morphology of the of theetched, joint produced by laser offsetthe welding in part of the weld exhibited a slight sagging. Such a geometric defect mainly derived from the bead shape. microstructural resolved later. Figure 8. At thisDetailed stage, the sample wasfeatures weaklywere etched, which permitted focusing the analysis on the contraction of liquid walls during the solidification and recoil pressure inside the keyhole, which FullDetailed penetration was achieved. The undercut at resolved the top surface prevented, while the bottom beadmade shape. microstructural features were later. was the molten material fill the volume of the cavity as the source advanced. part of the weld exhibited a slight sagging. Such a geometric defect mainly derived from the contraction of liquid walls during the solidification and recoil pressure inside the keyhole, which made the molten material fill the volume of the cavity as the source advanced.
Figure 8. Optical macrograph of cross section obtained by LOW technique.
Figure 8. Optical macrograph of cross section obtained by LOW technique.
Figure 9a,b shows the IMC layer formed by the Fe–Al reaction. The interface appeared Figure 8. Optical macrograph of cross section obtained by LOW technique. curvilinear and Fe-based isles wereThe distributed non-uniformly within was the thickness. Thewhile low thermal Full penetration was achieved. undercut at the top surface prevented, the bottom input promoted a slight interaction between liquid-state materials. A magnification of the zone A is part of theFigure weld exhibited a slight sagging. Such a geometric defect mainly derived from contraction 9a,b shows the IMC layer formed by the Fe–Al reaction. The interface appeared shown in Figure 9b.the solidification and recoil pressure inside the keyhole, which made the molten of liquid walls during curvilinear and Fe-based isles were distributed non-uniformly within the thickness. The low thermal material the volume of the cavity asbetween the source advanced. inputfillpromoted a slight interaction liquid-state materials. A magnification of zone A is shown in Figure 9b. the IMC layer formed by the Fe–Al reaction. The interface appeared curvilinear Figure 9a,b shows
and Fe-based isles were distributed non-uniformly within the thickness. The low thermal input promoted a slight interaction between liquid-state materials. A magnification of zone A is shown in Figure 9b.
Metals 2017, 7, 282 Metals 2017, 7, 282
8 of 17 8 of 17
Metals 2017, 7, 282
8 of 17
Figure 9. Optical micrographs of the intermetallic compounds (IMC) layer of the joint at: (a) 200×; (b)
Figure 9.high-magnification Optical micrographs of the intermetallic compounds (IMC) layer of the joint at: (a) 200×; image of area A in (a) at 500×. (b) high-magnification image of area A in (a) at 500×. Figure Optical micrographs of the intermetallic compounds (IMC) layerand of the joint at: (a) 200×; The9.IMCs formation is diffusion controlled and dependent on time thermal cycles. The (b) key high-magnification image of area A in (a) at 500×. challenge in joining dissimilar materials is the accurate control of the fusion behaviour and the mixing The IMCs formation is diffusion controlled and dependent on time and thermal cycles. The key of interfacing materials. Focusing the beam on the steel side confined the interaction between liquid challengephases in joining dissimilar is the control fusion behaviour andThe thekey mixing The IMCs is materials diffusion controlled and dependent onthe time and without thermal cycles. into aformation narrow area. The keyhole wasaccurate kept stable within of the steel side, affecting the of interfacing materials. Focusing the beam onaccurate thesubjected steel side confined thebehaviour interaction between liquid challenge in zone. joining dissimilar materials is the control of the fusion and the mixing interface Firstly, the aluminum side was not to the direct exposition to laser emission. Therefore, neither vaporization of alloying elements, norside liquid viscous flows towards the interface of interfacing materials. Focusing the beam the stable steel confined interaction between liquid the phases into a narrow area. The keyhole wason kept within the the steel side, without affecting was observed. Secondly, sincekeyhole theside beam was focused enough interface, large liquidemission. phases into a narrow The was kept stablefarwithin thefrom steelthe side, without affecting the interface zone. Firstly, thearea. aluminum was not subjected to the direct exposition to laser viscous forces were prevented. Thus,side the growth ofsubjected IMCs wasto limited and liquid flows to were confined interface zone. Firstly, the aluminum was not the direct exposition laser emission. Therefore, neither vaporization of alloying elements, nor liquid viscous flows towards the interface by the interface boundary, without creatingelements, any excessively largeviscous mixed zone. offsetthe welding Therefore, neither vaporization of alloying nor liquid flowsLaser towards interface was observed. Secondly, the beam was far enoughintermetallic from the interface, large liquid reduced since thesince content cracks andfocused promotedfar a narrower layer, which wassignificantly observed. Secondly, theofbeam was focused enough from the interface, largewas liquid viscous forces prevented. Thus,10). theMoreover, growth of limited liquid were limitedwere to roughly 6 μm. (Figure theIMCs rapid was process speed and lead to a highflows cooling rate,confined viscous forces were prevented. Thus, the growth of IMCs was limited and liquid flows were confined enabling aboundary, narrower fusion zone [37]. Consequently, the shorterlarge interaction time and narrower fusion welding by the without creating mixed zone. Laser offset byinterface the interface boundary, without creatingany any excessively excessively large mixed zone. Laser offset welding area promoted a thinner IMC layer. Such a result is hugely beneficial for the joint strength [30]. significantly reduced the content of cracks and promoted a narrower intermetallic layer, which was
significantly reduced the content of cracks and promoted a narrower intermetallic layer, which was
limited to roughly 6 µm. (Figure 10). rapidprocess process speed lead a high cooling limited to roughly 6 μm. (Figure 10).Moreover, Moreover, the the rapid speed lead to atohigh cooling rate, rate, enabling a narrower fusion zone [37]. Consequently, the shorter interaction time and narrower fusion enabling a narrower fusion zone [37]. Consequently, the shorter interaction time and narrower fusion area promoted a thinner IMC layer. Sucha aresult resultis is hugely hugely beneficial the joint strength [30].[30]. area promoted a thinner IMC layer. Such beneficialfor for the joint strength
Figure 10. (a) Scanning electron microscopy (SEM) and (b) optical micrographs showing the IMC layer.
Firstly, the composition of the IMC layer was analyzed by the energy dispersive spectroscopy (EDS) analysis during the SEM investigation (Figures 11 and 12). Figure 11 shows the maps of elements at the (Figure 11b,c), meanwhile Tableand 4 gives composition (at %)showing of Fe andthe Al Figure (a) interface Scanning electron microscopy (b) the optical micrographs Figure 10. (a)10.Scanning electron microscopy (SEM)(SEM) and (b) optical micrographs showing the IMC layer. inIMC the layer. points P1 (layer_1) and P2 (layer_2), which were located in Figure 12. The analysis of the maps in Figure 11b,c indicated that the light gray areas in Figure 11a contained mainly iron and aluminum, Firstly, the composition of the IMC layer was analyzed by the energy dispersive spectroscopy while thethe fused zones contained iron andlayer aluminum together with their alloy elements. Particularly, Firstly, composition of the IMC was analyzed by the energy dispersive spectroscopy (EDS) analysis during the SEMofinvestigation (Figures 11the and 12). Figure shows thetowards maps of the effect of the diffusion Al alloy elements towards steel fusion zone11 and Fe alloy theelements (EDS) analysis during the SEM investigation (Figures 11 and 12). Figure 11 shows the maps of at the interface (Figure 11b,c), meanwhile Table 4 gives the composition (at %) of Fe and aluminum side can be observed. The local chemical analysis in Figure 12 revealed that the chemicalAl in the
elements at the interface (Figure 11b,c), meanwhile Table 4 gives the composition (at %) of Fe and Al
points P1 (layer_1) and P2 (layer_2), which were located in Figure 12. The analysis of the maps in in the points P1 (layer_1) and P2 (layer_2), which were located in Figure 12. The analysis of the maps Figure that that the light gray areas contained mainly aluminum, in 11b,c Figureindicated 11b,c indicated the light gray areasininFigure Figure 11a 11a contained mainly ironiron andand aluminum, whilewhile the fused zones contained iron and aluminum together with their alloy elements. Particularly, the fused zones contained iron and aluminum together with their alloy elements. Particularly, the effect of the of Al alloy thesteel steelfusion fusion zone Fe alloy towards the effect of diffusion the diffusion of Al alloyelements elementstowards towards the zone andand Fe alloy towards the the aluminum sideside cancan be observed. The analysisininFigure Figure revealed the chemical aluminum be observed. Thelocal localchemical chemical analysis 1212 revealed thatthat the chemical composition of the IMC layer in the investigated points could be Fe2 Al5 - or FeAl2 -type according to Fe–Al phase diagram [5].
Metals 2017, 7, 7, 282 Metals 2017, 282
9 9ofof1717
Metals 2017, 7, 282 ofofthe 9to of 17 composition theIMC IMClayer layerininthe theinvestigated investigated points points could be Fe22Al composition Al55-- or or FeAl FeAl22-type -typeaccording accordingto
Fe–Al phasediagram diagram[5]. [5]. Fe–Al phase
Figure 11. (a) SEM micrograph (Back scattered electrons) showing the IMC layer (b) alloy elements
Figure 11. (a) SEM micrograph (Back scattered electrons) showing the IMC layer (b) alloy elements Figure 11. (a) micrograph scattered showing the IMC layer (b) alloy elements mapping andSEM (c) maps of single(Back elements at the electrons) joint interface. mapping and (c) maps of single elements at the joint interface. mapping and (c) maps of single elements at the joint interface.
Figure 12. SEM micrographs of the IMC zone of the cross section with energy dispersive spectroscopy (EDS) analysis results in the highlighted points P1, P2 at (a) 5000× and (b) 10000× magnifications. Figure 12. SEM micrographs of the IMC zone of the cross section with energy dispersive spectroscopy Figure 12. SEM micrographs of the IMC zone of the cross section with energy dispersive spectroscopy (EDS) analysis results in the highlighted points P1, P2 at (a) 5000× and (b) 10000× magnifications.
(EDS) analysis results in the highlighted points P1, P2 at (a) 5000× and (b) 10,000× magnifications.
Metals 2017, 7, 282
10 of 17
Metals 2017, 7, 282
10 of 17
Table 4. Chemical compositions at different points near aluminum/fusion zone interface (at %).
PointatNo. Fe aluminum/fusion Cr Ni Mg zone interface (at %). Table 4. Chemical compositions differentAl points near Point No. P1 P2
P1 P2Al 63.9 71.37
63.9 Fe 71.37
26.2 Cr 23.43
26.2 23.43
5.8 3.6
5.8 3.6
3.3 Ni 1.6 3.3 1.6
0.8 -Mg 0.8 -
As shown in the Fe–Al binary phase diagram [5], primarily five types of Fe–Al IMCs (i.e., Fe3Al, FeAl, FeAl2, Fe2Al5, and FeAl3 phases) are produced during the Fe/Al reaction process [38]. The As shown Fe–Al binary phaseIMCs diagram [5], on primarily five types of Fe–Al 3 Al, sequence of in thethe formation of Fe–Al based the thermodynamic data IMCs of the(i.e., freeFeenergy FeAl, FeAl , Fe Al , and FeAl phases) are produced during the Fe/Al reaction process [38]. 5 (Fe2Al5) < 3ΔG° (FeAl3) < ΔG° (FeAl2) < ΔG° (FeAl) < 0 < ΔG° (Fe3Al) [38–41], indicates 2that 2ΔG° The sequence that of the IMCs is based suggesting theformation first phaseoftoFe–Al be formed Fe2Alon 5. the thermodynamic data of the free energy ◦ (Fe Al ) < ∆G◦ (FeAl ) < ∆G◦ (FeAl ) < ∆G◦ (FeAl) < 0 < ∆G◦ (Fe Al) [38–41], indicates that ∆G 2 5 3 The nature of the IMCs compounds in the joint 2was assessed by XRD analysis3 (Figure 13a). suggesting thatstoichiometry the first phaseofto beFe formed is Fe Al5 .FeAl2 compounds is very close each other, it is not Because the the 2Al5, FeAl 3, 2and The nature of the IMCs compounds in the joint was assessed by XRD analysis (Figure area, 13a). a possible to distinguish them by EDS chemical analysis. Particularly, in the intermetallic Because the stoichiometry of the Fe Al , FeAl , and FeAl compounds is very close each other, it is not 2 5was employed 3 precision X-ray diffraction analysis to 2try and identify the compounds in the thinner possible to distinguish them by EDS chemical analysis. Particularly, in the intermetallic area, a precision intermetallic layer. Both the fusion zone of aluminum and steel was analyzed by XRD (Figure 13b,c). X-ray diffraction analysis employed and identify theof compounds the Iron, thinner intermetallic In the steel fusion zonewas were detected to thetry diffraction peaks Aluminuminand meanwhile in the layer. Both the fusion zone of aluminum and steel was analyzed by XRD (Figure 13b,c). In the steel Al zone only the aluminum peak were detected. The XRD spectrum in the intermetallic zone fusion zone were the diffraction peaks of Aluminum andmatrix, Iron, meanwhile the of Al more zone only identified onlydetected the FeAl 2 compound together with the Al while no in trace stable thecompounds aluminum peak were detected. Thecould XRD be spectrum the intermetallic zone identified only the was found. The reason the lowinamount of the more stable compounds (i.e., FeAl compound together with the Al matrix, while no trace of more stable compounds was Fe22Al5). In fact, the joint solidification is a non-equilibrium process, which is characterizedfound. by high The reason speed could (2 bem/min) the lowand amount of the more stable compounds (i.e., crystallization Fe2 Al5 ). In fact, the joint welding cooling rate. Therefore, the compounds’ could be not solidification is a non-equilibrium process, which is characterized by high welding speed (2 m/min) strictly in accordance with thermodynamic condition. So, if thermodynamically more stable and cooling rate. Therefore, compounds’ be not strictly in accordance withthe compounds (such as Fe2Althe 5), being diffusioncrystallization controlled, docould not have enough time to grow during thermodynamic So,other if thermodynamically more stable (such nucleate as Fe2 Al5and ), being cooling of thecondition. joint, some less stable compounds (suchcompounds as FeAl2) could grow diffusion controlled, do not have enough time to grow during the cooling of the joint, some other less preferentially [42]. Vickers micro-hardness measurements on the intermetallic interface layer (Figure stable compounds (such as FeAl ) could nucleate and grow [42]. Vickers 14) were in accordance with2the values reported in thepreferentially literatures for FeAl or Femicro-hardness 2Al5 (Figure 14a) measurements on the intermetallic interface layer (Figure 14) were in accordance with the values compounds [1,3]. In such a case, the values of hardness could be underestimated because of the Al reported in the literatures for FeAl or Fe Al (Figure 14a) compounds [1,3]. In such a case, the values 2 5 matrix (Figure 14b). of hardness could be underestimated because of the Al matrix (Figure 14b).
Figure 13.13. (a)(a) Precision X-ray diffraction analysis in the thinner intermetallic layer. X-ray diffraction Figure Precision X-ray diffraction analysis in the thinner intermetallic layer. X-ray diffraction analysis in the (b) aluminum and (c) steel fusion zone. analysis in the (b) aluminum and (c) steel fusion zone.
Metals 2017, 7,7, 282 Metals 2017, 282 Metals 2017, 7, 282
1111ofof1717 11 of 17
Figure14. 14.Optical Opticalmicrographs micrographsofofjoint joints1s1shows showsthe theresult resultofofVickers Vickersmicro-hardness micro-hardnessmeasurements measurements Figure theinterface interfacealuminum/steel: aluminum/steel:(a) (a)hardness hardnessvalue valuedue dueto IMC(b) (b)hardness hardnessvalue valuedue duetotoeffects effectsofof ononthe (a) hardness value due totoIMC IMC (b) interface aluminum/steel: the IMC and Al matrices. the IMC and Al matrices. the IMC and Al matrices.
Figure1515represents representsthe themicrohardness microhardnessatatthe thehalf halfthickness thicknessofofthe thecross crosssection. section.The Thehardness hardness Figure Figure 15 represents the microhardness at the half thickness of the cross section. The hardness of the Al FZ was higher than that in the heat affected zone (HAZ) and the base material (BM). Rapid of the the Al Al FZ FZ was was higher higher than than that that in in the the heat heat affected affected zone zone (HAZ) (HAZ) and and the the base base material material (BM). (BM). Rapid Rapid of solidification,and andtherefore thereforeboth bothgrain grainrefining refiningand andlow lowgrain grainboundaries’ boundaries’precipitation, precipitation,increased increased solidification, solidification, and therefore both grain refining and low grain boundaries’ precipitation, increased the hardness in the FZ. The hardness of the Al HAZ was slightly larger than that in the base material. the hardness hardness in in the the FZ. FZ. The The hardness of the the hardness of the Al Al HAZ HAZ was was slightly slightly larger larger than than that that in in the the base base material. material. Thisresult resultmay maybebedue due tothe thedissolution dissolution ofsoluble solublecompounds compoundsand and theconsequent consequentstrengthening strengthening This This result may be due totothe dissolution ofof soluble compounds and thethe consequent strengthening by by solid solution. Figure 15 shows that an increase of hardness in the steel was due to grain refinement by solid solution. Figure shows that increase hardnessininthe thesteel steelwas wasdue dueto to grain grain refinement refinement solid solution. Figure 15 15 shows that anan increase ofofhardness promotedduring duringthe thewelding weldingprocess process[43,44]. [43,44]. promoted promoted during the welding process [43,44].
Vickers Microhardness (HV 0.1/15) Vickers Microhardness (HV 0.1/15)
600 600 550 550 500 500 450 450 400 400 350 350 300 300 250 250 200 200
Interface Interface FZ FZ
Steel Steel
Aluminum Aluminum
50 50
-2000 -1500 -1000 -2000 -1500 -1000
-500 -500
0
0
500 500
1000 1000
1500 1500
2000 2000
Distancefrom fromthe thecentreline centreline[μ[m] μm] Distance Figure 15. Cross weld section microhardness profile for the laser offset welding. Figure15. 15.Cross Crossweld weldsection sectionmicrohardness microhardnessprofile profilefor forthe thelaser laseroffset offsetwelding. welding. Figure
Microhardness the the Microhardnesswas washigh highin thefusion fusionzone zonedue dueto thefiner finergrain grainsize size(Figure (Figure16) 16)The Theaverage average Microhardness was high ininthe fusion zone due totothe finer grain size (Figure 16) The average size of the grains in the BM steel was 30 ± 5.7 µm, meanwhile in the FZ (at both the interface with size of the grains in the BM steel was 30 ± 5.7 μm, meanwhile in the FZ (at both the interface with size of the grains in the BM steel was 30 ± 5.7 μm, meanwhile in the FZ (at both the interface with steel HAZ and Al FZ) it was equal to 6 ± 1.2 µm. In the literature, there are several works on the steelHAZ HAZand andAl AlFZ) FZ)ititwas wasequal equaltoto6 6± ±1.2 1.2μm. μm.InInthe theliterature, literature,there thereare areseveral severalworks workson onthe thelaser laser steel laser welding steel/aluminum which showed an increased hardness due to the refinement of the grain welding steel/aluminum steel/aluminum which which showed showed an an increased increased hardness hardness due due toto the the refinement refinement ofof the the welding size [44,45]. grain size [44,45]. grain size [44,45].
Metals 2017, 7, 282
12 of 17
Metals 2017, 7, 282
12 of 17
Figure 16. Optical micrographs showing (a) base material of 316L stainless steel and (b) fine structure Figure 16. Optical micrographs showing (a) base material of 316L stainless steel and (b) fine structure in the fusion zone due to the fast solidification. in the fusion zone due to the fast solidification.
Grain boundary precipitation on the aluminum side did not occur during the joint solidification Grain boundary precipitation the aluminum side didoccurred, not occurthe during the joint solidification because of the rapid cooling. If grainon boundary precipitation hardness of AA5754 would because of the rapid cooling. If grain boundary precipitation occurred, the hardness of AA5754 would strongly decrease. The precipitation of Al–Mg particles inside the grains leads to strongly decrease. softening [27,36]. The precipitation of Al–Mg particles inside the grains leads to softening [27,36]. 5. Laser Hybrid Welding Results 5. Laser Hybrid Welding Results Figure 17 shows the cross section of the joint produced by hybrid laser-MIG welding. Excessive Figure 17 shows the cross section of the joint produced by hybrid laser-MIG welding. Excessive weld metal was observed at the top surface, while the bottom part presented a slight lack of penetration. weld metal was observed at the top surface, while the bottom part presented a slight lack of The reason why these geometric defects occurred can be explained by assessing the process dynamics. penetration. The reason why these geometric defects occurred can be explained by assessing the Excessive weld metal resulted from the high wire deposition rate. Lower wire feeding speeds were process dynamics. Excessive weld metal resulted from the high wire deposition rate. Lower wire adopted to enhance the geometric outcome and reduce the defectiveness. Anyhow, reducing the feeding speeds were adopted to enhance the geometric outcome and reduce the defectiveness. deposition rate of filler metal must correspond to a reduction of the heat input to keep the process Anyhow, reducing the deposition rate of filler metal must correspond to a reduction of the heat input energy balance and avoid wire overheating. Then, several experiments were performed with lower to keep the process energy balance and avoid wire overheating. Then, several experiments were values of total power and wire feeding speed. The laser power was kept constant, because it is mainly performed with lower values of total power and wire feeding speed. The laser power was kept responsible for penetration. However, even if the laser power was kept constant, the reduction of the constant, because it is mainly responsible for penetration. However, even if the laser power was kept MIG power had a detrimental effect on the geometry of the joint, since the amount of total energy constant, the reduction of the MIG power had a detrimental effect on the geometry of the joint, since was not enough to fully penetrate the sheets’ thickness and generate a consistent bond. Thus, the the amount of total energy was not enough to fully penetrate the sheets’ thickness and generate a most satisfactory outcome was evaluated for the present analysis (see Table 3). As shown in Figure 17, consistent bond. Thus, the most satisfactory outcome was evaluated for the present analysis (see a good compromise between penetration and excessive weld metal was found. A slight lack of weld Table 3). As shown in Figure 17, a good compromise between penetration and excessive weld metal penetration was observed at the bottom part (less than 0.3 mm depth), while the excessive weld metal was found. A slight lack of weld penetration was observed at the bottom part (less than 0.3 mm was limited to 0.6 mm. depth), while the excessive weld metal was limited to 0.6 mm. As stated above, the stability of the process is dependent on the keyhole dynamics. The balance As stated above, the stability of the process is dependent on the keyhole dynamics. The balance over different force contribution is needed to sustain the plasma inside the cavity in stable conditions. over different force contribution is needed to sustain the plasma inside the cavity in stable conditions. Either higher pressure of vapor gases or excessive viscous action of liquid walls might lead to keyhole Either higher pressure of vapor gases or excessive viscous action of liquid walls might lead to keyhole collapse. Since the beam was focused at the interfaces between two dissimilar materials, such a collapse. Since the beam was focused at the interfaces between two dissimilar materials, such a condition was critical for keyhole stability in hybrid welding, which suffered from additional forces condition was critical for keyhole stability in hybrid welding, which suffered from additional forces gradients. The risk of a collapsing keyhole is less significant in the fiber laser since the absorptivity by gradients. The risk of a collapsing keyhole is less significant in the fiber laser since the absorptivity metal gas vapors is much less. by metal gas vapors is much less. However, the significant difference in liquid metal viscosity, thermal properties, and surface However, the significant difference in liquid metal viscosity, thermal properties, and surface tension compromised the process dynamics, leading to the collapse of the keyhole and consequent tension compromised the process dynamics, leading to the collapse of the keyhole and consequent entrapment of gas bubbles. Because of the rapid contraction of liquid walls and the rapid solidification entrapment of gas bubbles. Because of the rapid contraction of liquid walls and the rapid rate, gas inclusions did not have enough time and energy to escape from the weld pool [46]. Thus, solidification rate, gas inclusions did not have enough time and energy to escape from the weld pool macro voids formed in the fusion zone, and their direction was determined by the viscous metal flows [46]. Thus, macro voids formed in the fusion zone, and their direction was determined by the viscous during keyhole collapse. metal flows during keyhole collapse. Because of the significant difference in thermal expansion coefficient between the two metals and Because of the significant difference in thermal expansion coefficient between the two metals the brittleness of IMCs structures, solidification cracks formed at the interface. and the brittleness of IMCs structures, solidification cracks formed at the interface.
Metals 2017, 7, 282 Metals 2017, 7, 282 Metals 2017, 7, 282
13 of 17 13 of 17 13 of 17
A huge energy was directly provided at the between the sheets. Thus, hugeamount amountofofthermal thermal energy was directly provided at interface the interface between the sheets. A huge amount of thermal energy was directly provided at the interface between the sheets. large forces forces of molten metalsmetals were generated. The boundary between the two was Thus,viscous large viscous of molten were generated. The boundary between the metals two metals Thus, large viscous forces of molten metals were generated. The boundary between the two metals highly irregular and non-homogeneous. The behavior of the metal the interface not governed was highly irregular and non-homogeneous. The behavior of theat metal at the was interface was not was highly irregular and non-homogeneous. The behavior of the metal at the interface was not by controllable thermal gradients. Liquid flows wereflows uncontrolled, since the distribution of viscous governed by controllable thermal gradients. Liquid were uncontrolled, since the distribution governed by controllable thermal gradients. Liquid flows were uncontrolled, since the distribution forces within thewithin thickness was not scientifically predictable. The hydrodynamic pressure of the of viscous forces the thickness was not scientifically predictable. The hydrodynamic pressure of viscous forces within the thickness was not scientifically predictable. The hydrodynamic pressure molten steel at theattop of the weld hadhad enough energy totopenetrate of the molten steel thepart top part of the weld enough energy penetratethe thealuminum aluminum substrate substrate of the molten steel at the top part of the weld had enough energy to penetrate the aluminum substrate (see Figures Figures 17 17 and and 18), 18), while while aa large large volume volume of of liquid liquid aluminum aluminum was was pulled pulled down by gravity at the (see Figures 17 and 18), while a large volume of liquid aluminum was pulled down by gravity at the bottom side. bottom side.
Figure 17. Optical macrograph of cross cross section by by hybrid laser-MIG laser-MIG welding. Figure 17. 17. Optical macrograph macrograph of of Figure Optical cross section section by hybrid hybrid laser-MIG welding. welding.
Figure 18. SEM picture showing the highly irregular and non-homogeneous Steel/Al interface. Figure 18. SEM picture showing the highly irregular and non-homogeneous Steel/Al interface. Figure 18. SEM picture showing the highly irregular and non-homogeneous Steel/Al interface.
The geometry of the IMC layer was inspected by electron microscopy. Figure 19a,b show that The geometry of the IMC layer was inspected by electron microscopy. Figure 19a,b show that the width exceeded the value oflayer 14 μm. The process control did not benefit from the hybrid laser-arc The geometry the IMCof wasThe inspected electron Figure shows that the width exceededof the value 14 μm. processby control didmicroscopy. not benefit from the19a,b hybrid laser-arc combination. The arc promoted a lower cooling rate and non-uniform energy distribution within the the width exceeded value of a14lower µm. The process control did not benefit from the hybrid laser-arc combination. The arcthe promoted cooling rate and non-uniform energy distribution within the thickness. Longer reaction time for IMC growth occurred. As mentioned above, such a result is combination. The reaction arc promoted a lower and non-uniform energy distribution within thickness. Longer time for IMC cooling growth rate occurred. As mentioned above, such a result is undesirable for tensile properties [17]. Micro-cracks were detected at both the upper and lower side the thickness. time forMicro-cracks IMC growth were occurred. As mentioned a result is undesirable forLonger tensilereaction properties [17]. detected at both theabove, upper such and lower side of the interface. IMC structures at the interface are hugely brittle and no plastic behavior was undesirable for tensile Micro-cracks werehugely detected at both andbehavior lower side of of the interface. IMC properties structures[17]. at the interface are brittle andthenoupper plastic was detected, because of the nearly-zero dislocation mobility. During solidification, local stresses the interface. IMC structures at the interface are hugely brittle and no plastic behavior was detected, detected, because of the nearly-zero dislocation mobility. During solidification, local stresses exceeded the elastic limit, leading to small fractures both perpendicular and parallel to the exceeded the elastic limit, leading to small fractures both perpendicular and parallel to the layer width. layer width.
Metals 2017, 7, 282
14 of 17
because of the nearly-zero dislocation mobility. During solidification, local stresses exceeded the elastic limit, 2017, leading Metals 7, 282to small fractures both perpendicular and parallel to the layer width. 14 of 17 Metals 2017, 7, 282
14 of 17
Figure 19. SEM SEM pictures pictures show: show: (a) (a) Close-up Close-up of of the the upper upper side side of of the the interface interface of of the sample sample (5000 (5000×); Figure 19. ×); Figure 19. SEM pictures show: (a) Close-up of the upper side of the interface the of the sample (5000×); (b) Close-up Close-up of of the the lower lower side side of of the the interface interface of of the the sample sample (6000 (6000×). (b) × ). (b) Close-up of the lower side of the interface of the sample (6000×).
Figure 20 shows the micro-hardness profile detected from the cross section of the sample. Figure shows the micro-hardness profile detected from the cross ofsection of theAdding sample. Figure 20 20 shows the micro-hardness profile detected from the cross section the sample. Adding arc increased the thermal energy and volume of molten metal compared to single laser arc the increased the thermal and of molten metal to compared to single laser arcAdding increased thermal energy andenergy volume of volume molten metal compared single laser welding. welding. Therefore, even if the welding speed was the same as the autogenous laser process, the welding.even Therefore, even if speed the welding was same as the process, the Therefore, if the welding was thespeed same as thethe autogenous laserautogenous process, thelaser thermal inertia thermal inertia of the fusion zone was higher and the cooling rate was attenuated, leading to grain inertia thehigher fusionand zone higher cooling rate was to attenuated, to and grain ofthermal the fusion zoneof was thewas cooling rateand wasthe attenuated, leading grain size leading widening size widening and lower hardness values in the FZ. size hardness wideningvalues and lower hardness values in the FZ. lower in the FZ.
Vickers Microhardness (HV 0.1/15) Vickers Microhardness (HV 0.1/15)
Interface Interface 400 400
FZ FZ
350 350 300 300 250 250
Aluminum Aluminum
Steel Steel
200 200 150 150 100 100 50
50 -2500 -2000 -1500 -1000 -500 0 -2500 -2000 -1500 -1000 -500 0
500 1000 1500 2000 2500 500 1000 1500 2000 2500
Distance from the centreline [μm] Distance from the centreline [μm]
Figure Figure 20. Cross Cross weld weld section section microhardness profile for the hybrid laser-MIG. Figure 20. Cross weld section microhardness profile for the hybrid laser-MIG.
The indentation presented presented in in Figure Figure 21 21 refers refers to to the the aluminum/steel aluminum/steel interface and reports on aa The indentation reports onon The indentation presented in Figure 21 refers to the aluminum/steelinterface interfaceand and reports a micro-hardness value of 850 Vickers. The IMC area resulted much harder than single-alloy fusion micro-hardness 850 Vickers. area resulted much harder than single-alloy fusion micro-hardnessvalue valueofof 850 Vickers.The TheIMC IMC area resulted much harder than single-alloy fusion zones and presented aa high high gradient gradient of of thermal thermal expansion expansion coefficient. Therefore, this area is locally zones and presented coefficient. Therefore, this area is is locally zones and presented a high gradient of thermal expansion coefficient. Therefore, this area locally subjected to compressive and tensile stresses during the non-uniform solidification, which potentially subjected to compressive and tensile stresses during the non-uniform solidification, which potentially subjected to compressive and tensile stresses during the non-uniform solidification, which potentially enables crack propagation. propagation. enables crack enables crack propagation.
Metals 2017, 7, 282
15 of 17
Metals 2017, 7, 282
15 of 17
Figure 21. Indentation of the intermetallic layer. Figure 21. Indentation of the intermetallic layer.
6. Conclusions 6. Conclusions The present work reported the characterization of the microstructure and the intermetallic The present work reported the characterization of the microstructure and the intermetallic compounds (IMCs) in Fe–Al dissimilar welds obtained by fiber off-set and hybrid laser welding. The compounds (IMCs) in Fe–Al dissimilar welds obtained by fiber off-set and hybrid laser welding. following considerations were pointed out: The following considerations were pointed out: • The EDS/XRD analysis revealed the presence of FeAl2 in the laser welded joint. The revealed the presence of FeAl2 in laser welded joint. The interaction •• Full EDS/XRD penetrationanalysis and low defectiveness were obtained bythe laser offset welding. • Full penetration and low were obtained by attenuated laser offsetby welding. The the interaction between liquid phases wasdefectiveness restricted. Viscous forces were optimizing process between liquid phases was restricted. Viscous forces were attenuated by optimizing the process energy balance. Moreover, the high cooling rate and low mix between the two metals enabled energy balance. Moreover, high cooling andAs lowstated mix between the two metals enabled IMC IMC layer growth, which the was as thick asrate 6 μm. in the literature, a thin IMC layer layer growth, which was as thick as 6 µm. As stated in the literature, a thin IMC layer improves improves the mechanical properties of the weld. Brittle phases were detected but hot cracks the mechanical were avoided. properties of the weld. Brittle phases were detected but hot cracks were avoided. Hybrid In fact, fact, an an excessive weld crown crown was •• Hybrid laser-arc laser-arc welding welding resulted resulted less less effective. effective. In excessive weld was observed observed and the weld presented a lack of penetration. The process was instable because of the significant and the weld presented a lack of penetration. The process was instable because of the significant difference difference in in thermalthermal- and and fluid-dynamic fluid-dynamic properties properties of of the the two two metals, metals, which which compromised compromised the the keyhole stability. The interface was highly irregular and non-homogeneous, due to the action of keyhole stability. The interface was highly irregular and non-homogeneous, due to the action of the viscous forces. the viscous forces. It can be concluded that LOW effects on Al–Fe dissimilar metallurgy and IMC can be controlled investigation onon thethe weldability of better than than those those of of the thehybrid hybridlaser-arc laser-arcwelding. welding.Therefore, Therefore,further further investigation weldability Al–Fe dissimilar welds will focus on on thethe LOW welding technique. of Al–Fe dissimilar welds will focus LOW welding technique. Author Contributions: Giuseppe Casalino and Michelangelo Mortello dealt with the fabrication of the welds, Author Contributions: Giuseppe Casalino and Michelangelo Mortello dealt withthe theX-ray fabrication ofAlessandra the welds, Paola Leo and Patrizias Perulli handled the microstructure analisys and performed analysis, Varone advised the interpretation of the X-ray spectra. Paola Leo and on Patrizias Perulli handled the microstructure analisys and performed the X-ray analysis, Alessandra advised on thedeclare interpretation of the X-ray spectra. Conflicts ofVarone Interest: The authors no conflict of interest.
Conflicts of Interest: The authors declare no conflict of interest.
References References 1.
1. 2. 2. 3. 3. 4. 4.
5.
Yang, J.; Long, L.Y.; Zhang, H. Microstructure and mechanical properties of pulsed laser welded Al/steel dissimilar joint.L.Y.; Trans. Nonferrous Met. Soc. China 2016, 26, 994–1002. [CrossRef] Yang, J.; Long, Zhang, H. Microstructure and mechanical properties of pulsed laser welded Al/steel Fridlyander, I.N.;Trans. Sister,Nonferrous V.G.; Grushko, O.E.;China Berstenev, dissimilar joint. Met. Soc. 2016, V.; 26,Sheveleva, 994–1002. L.M.; Ivanova, L.A. Aluminium alloys: Promising materials in theV.G.; automotive industry. Met. Sci. Heat Treat. 2002,L.M.; 44, 365–370. [CrossRef] Fridlyander, I.N.; Sister, Grushko, O.E.; Berstenev, V.; Sheveleva, Ivanova, L.A. Aluminium Torkamany, M.J.; Tahamtan, S.; Sabbaghzadeh, J. Dissimilar welding of carbon steel to 5754 aluminum alloy alloys: Promising materials in the automotive industry. Met. Sci. Heat Treat. 2002, 44, 365–370. by Nd:YAG pulsed laser. Mater. 2010, 31, 458–465. [CrossRef] Torkamany, M.J.; Tahamtan, S.;Des. Sabbaghzadeh, J. Dissimilar welding of carbon steel to 5754 aluminum Chen,byS.;Nd:YAG Zhai, Z.; Huang, Zhao,Des. X.; 2010, Xiong, Interface microstructure and fracture behavior of alloy pulsed laser.J.;Mater. 31, J. 458–465. single/dual-beam welded steel-Al produced with copper Int. J. Adv. Chen, S.; Zhai, Z.;laser Huang, J.; Zhao, X.;dissimilar Xiong, J. joint Interface microstructure andinterlayer. fracture behavior of Manuf. Technol. 2016, 82, 631–643. [CrossRef] single/dual-beam laser welded steel-Al dissimilar joint produced with copper interlayer. Int. J. Adv. Manuf.
Technol. 2016, 82, 631–643. Hiroaki, O.; Schlesinger, M.E.; Mueller, E.M. Alloy Phase Diagrams, 3rd ed.; ASM International: Geauga County, OH, USA, 1992; ISBN 978-1-62708-070-5.
Metals 2017, 7, 282
5.
Hiroaki, O.; Schlesinger, M.E.; Mueller, E.M. Alloy Phase Diagrams, 3rd ed.; ASM International: Geauga
MetalsCounty, 2017, 7, 282 OH, USA, 1992; ISBN 978-1-62708-070-5.
6. 6. 7. 7. 8. 8. 9. 9. 10. 10. 11. 11. 12. 12. 13. 13. 14. 14. 15. 15. 16. 16. 17. 17.
18. 19. 20. 21. 22. 23. 23. 24. 24. 25.
25. 26. 26. 27. 27. 28. 28. 29.
30. 31.
16 of 17
16 of 17
Çam, G.; Erim, S.; Yeni, Ç.; Koçak, M. Determination of mechanical and fracture properties of laser beam Çam, G.;steel Erim, S.; Yeni, Koçak, Determination of mechanical and fracture properties of laser beam welded joints. Weld.Ç.; J. 1999, 78,M. 193–201. welded steel joints. Weld. J. 1999, 78, 193–201. Çam, G.; Yeni, Ç.; Erim, S.; Ventzke, V.; Koçak, M. Investigation into properties of laser welded similar and Çam, G.; Yeni, Erim,Sci. S.; Technol. Ventzke,Weld. V.; Koçak, M. Investigation into properties of laser welded similar and dissimilar steelÇ.; joints. Join. 1998, 3, 177–189. [CrossRef] dissimilar Sci. Technol. J.; Weld. Join. 1998, 3, 177–189. high-strength steels: Fusion welded joints, Mvola, B.;steel Kah,joints. P.; Martikainen, Suoranta, R. Dissimilar Mvola, B.; Kah, P.; Martikainen, J.; Suoranta, R. Dissimilar high-strength steels: Fusion welded joints, mismatches, and challenges. Rev. Adv. Mater. Sci. 2016, 44, 146–159. mismatches, and challenges. Rev. Adv. Mater. Sci. 2016, 44, 146–159. Liu, X.; Lan, S.; Ni, J. Analysis of process parameters effects on friction stir welding of dissimilar aluminum Liu, S.; Ni,high J. Analysis of steel. process parameters effects on friction stir welding of dissimilar aluminum alloyX.; toLan, advanced strength Mater. Des. 2014, 59, 50–62. [CrossRef] alloy to advanced high strength steel. Mater. Des. 2014, 59,Wang, 50–62.C.J. Effect of annealing treatment on joint Movahedi, M.; Kokabi, A.H.; Reihani, S.S.; Cheng, W.-J.; Movahedi, Kokabi, A.H.;friction Reihani, W.-J.; Des. Wang, C.J.44, Effect of annealing treatment on joint strength of M.; aluminum/steel stirS.S.; lapCheng, weld. Mater. 2013, 487–492. [CrossRef] strength of aluminum/steel friction stir lap weld. Mater. Des. 2013, 44, 487–492. Habibnia, M.; Shakeri, M.; Nourouzi, S.; Givi, M.B. Microstructural and mechanical properties of friction stir Habibnia, M.;AlShakeri, M.;304 Nourouzi, Givi, M.B.Int. Microstructural mechanical of friction welded 5050 alloy and stainlessS.; steel plates. J. Adv. Manuf.and Technol. 2015, 76,properties 819–829. [CrossRef] stir welded 5050 Al and 304 stainless steel plates. Int. J.by Adv. Manuf. Technol.Int. 2015, 76, 819–829. Sahin, M. Joining of alloy stainless-steel and aluminium materials friction welding. J. Adv. Manuf. Technol. Sahin, M.487–497. Joining of stainless-steel and aluminium materials by friction welding. Int. J. Adv. Manuf. Technol. 2009, 41, [CrossRef] 2009, 41, 487–497. Campanelli, S.L.; Casalino, G.; Casavola, C.; Moramarco, V. Analysis and comparison of friction stir welding Campanelli, S.L.; friction Casalino, Casavola, C.; Moramarco, V. Analysis and comparison of friction stir and laser assisted stirG.; welding of aluminum alloy. Materials 2013, 6, 5923–5941. [CrossRef] welding and laser assisted friction welding ofH. aluminum alloy.compounds Materials 2013, 6, 5923–5941. Ratanathavorn, W.; Melander, A.; stir Magnusson, Intermetallic in friction stirred lap joints Ratanathavorn, W.; Melander,ultra-high A.; Magnusson, Intermetallic in friction stirred [CrossRef] lap joints between AA5754/galvanised strength H. steel. Sci. Technol.compounds Weld. Join. 2016, 21, 653–659. between AA5754/galvanised ultra-high strength steel. Sci. Technol. Weld. Join. 2016, 21, 653–659. Oikawa, H.; Ohimiya, S.; Yoshimura, T.; Saitoh, T. Resistance spot welding of steel and aluminum sheet Oikawa, H.; metal Ohimiya, S.;Sci. Yoshimura, T.; Saitoh, T. Resistance welding of steel and aluminum sheet using insert sheet. Technol. Weld. Join. 1999, 4, 80–88. spot [CrossRef] using insert metalMeng, sheet.X.M.; Sci. Technol. Weld. Join. 1999, 4, 80–88. Qin, G.; Su, Y.H.; Fu, B.L. Numerical simulation on MIG arc brazing-fusion welding of aluminum Qin, Su Y.H.; Meng, X.M.;Int. Fu,J. Adv. B.L. Numerical simulation MIG arc [CrossRef] brazing-fusion welding of alloy G.; to galvanized steel plate. Manuf. Technol. 2015, 78,on 1917–1925. aluminum alloy C.; to galvanized plate. Int. J. Adv. Manuf. Technol. 2015, 78, and 1917–1925. Gao, M.; Chen, Mei, S.W.; steel Wang, L.; Zeng, X.Y. Parameter optimization mechanism of laser–arc Gao, M.; Chen, C.; Mei, S.W.; Wang, L.; Zeng, X.Y. Parameter optimization and mechanism of laser–arc hybrid welding of dissimilar Al alloy and stainless steel. Int. J. Adv. Manuf. Technol. 2014, 74, 199–208. hybrid welding of dissimilar Al alloy and stainless steel. Int. J. Adv. Manuf. Technol. 2014, 74, 199–208. [CrossRef] Çam, Friction stir stirwelded weldedstructural structuralmaterials: materials:Beyond BeyondAlAlalloys. alloys.Int. Int.Mater. Mater. Rev. 2011, 1–48. Çam, G. Friction Rev. 2011, 56,56, 1–48. [CrossRef] Chen, interlayer on on Fe/Al Fe/Al dissimilar Chen, S.; Huang, J.; Ma, K.; Zhang, H.; Zhao, X. Influence of a Ni-foil interlayer dissimilar joint joint by by laser penetration welding. Mater. Lett. 2012, 79, 296–299. laser Mater. 2012, 79, 296–299. [CrossRef] Mathieu, Matteї,, S.; Grevey, Grevey, D. D. Laser Laser brazing brazing of of aasteel/aluminum steel/aluminum Mathieu, A.; A.; Pontevicci, Pontevicci, S.; S.; Viala, J.; Cicala, E.; Matte assembly assembly with hot filler wire (88% Al, 12% Si). Mater. Sci. Eng. A A 2006, 2006, 435, 435, 19–28. 19–28. [CrossRef] Dharmendra, Dharmendra, C.; C.; Rao, Rao, K.; K.; Wilden, Wilden, J.; J.; Reich, Reich, S. S. Study Study on on laser laser welding-brazing welding-brazing of of zinc zinc coated coated steel to aluminum aluminum alloy with a zinc based filler. Mater. Sci. Eng. 2011, 528, 1497–1503. [CrossRef] Song, J.; Yang, C.; C.; Ma,Ma, G.; Liu, Spreading behavior and microstructure characteristics of dissimilar Song, J.; Lin, Lin,S.;S.; Yang, G.; H. Liu, H. Spreading behavior and microstructure characteristics of metals TIGmetals welding brazing of aluminum alloy to stainless steel. Sci.steel. Eng. 2009, dissimilar TIG welding brazing of aluminum alloy to Mater. stainless Mater.509, Sci.31–40. Eng. [CrossRef] 2009, 509, Choi, C.; Kim, D.; Nam, D.; Kim, Y.; Park, Y. A hybrid joining technology for aluminum/zinc coated steels in 31–40. vehicles. J. Mater. Technol. 2010, 858–864. [CrossRef] Choi, C.; Kim, D.; Sci. Nam, D.; Kim, Y.;26, Park, Y. A hybrid joining technology for aluminum/zinc coated steels Zhang, K.; Zhenglong, Chen, Y.; Liu,26, M.; Liu, Y. Microstructure characteristics and mechanical properties in vehicles. J. Mater. Sci.L.;Technol. 2010, 858–864. of laser-TIG hybrid welded Ti–22Al–27Nb and TA15. Opt.characteristics Laser Technol. 2015, 73, 139–145. Zhang, K.; Zhenglong, L.;dissimilar Chen, Y.;joints Liu,ofM.; Liu, Y. Microstructure and mechanical [CrossRef] of laser-TIG hybrid welded dissimilar joints of Ti–22Al–27Nb and TA15. Opt. Laser Technol. 2015, properties Thomy, C.; Vollertsen, F. Laser-Mig Hybrid Welding of Aluminium to Steel Effect of Process Parameters on 73, 139–145. Joint Properties. Weld. World 2012, 56,Hybrid 124–132. [CrossRef] Thomy, C.; Vollertsen, F. Laser-Mig Welding of Aluminium to Steel Effect of Process Parameters Leo, P.; Renna, G.; Casalino, G.; Olabi, A.G. Effect of power distribution on the weld quality during hybrid on Joint Properties. Weld. World 2012, 56, 124–132. laserP.; welding anCasalino, Al–Mg alloy. Opt. Laser 73,distribution 118–126. [CrossRef] Leo, Renna,ofG.; G.; Olabi, A.G. Technol. Effect of2015, power on the weld quality during hybrid Casalino, G.; Campanelli, Ludovico, A.D. Laser-arc hybrid welding of wrought to selective laser molten laser welding of an Al–MgS.L.; alloy. Opt. Laser Technol. 2015, 73, 118–126. stainless steel. Int. J. Adv. Manuf. Technol. 2013, 209–216. hybrid [CrossRef] Casalino, G.; Campanelli, S.L.; Ludovico, A.D.68,Laser-arc welding of wrought to selective laser Zeng, Z.; Li, X.;steel. Miao, Wu, Manuf. G.; Zhao, Z. Numerical and experiment analysis of residual stress on molten stainless Int.Y.;J. Adv. Technol. 2013, 68, 209–216. magnesium and steel hybrid laser-TIG welding. Comput. Mater. Sci.of2011, 50, 1763–1769. Zeng, Z.; Li,alloy X.; Miao, Y.b,butt Wu,joint G.; by Zhao, Z. Numerical and experiment analysis residual stress on [CrossRef] alloy and steel butt joint by hybrid laser-TIG welding. Comput. Mater. Sci. 2011, 50, 1763–1769. magnesium Casalino, G.; G.; Mortello Mortello,M.; M.;Peyre, Peyre,P.P. Yb–YAG Yb–YAG laser laser offset offset welding welding of of AA5754 AA5754 and and T40 T40 butt butt joint. joint. J.J. Mater. Mater. Casalino, Process. Technol. 2015, 223, 139–149. [CrossRef]
Rathod, M.J.; Kustuna, M. Joining of aluminum alloy 5052 and low carbon steel by laser roll welding. Weld. J. Res. Suppl. 2004, 83, 16–26. Casalino, G.; Mortello, M. Modeling and experimental analysis of fiber laser offset welding of Al-Ti butt joints. Int. J. Adv. Manuf. Technol. 2016, 83, 89–98.
Metals 2017, 7, 282
30. 31. 32. 33. 34. 35. 36. 37. 38. 39. 40. 41. 42. 43. 44. 45. 46.
17 of 17
Rathod, M.J.; Kustuna, M. Joining of aluminum alloy 5052 and low carbon steel by laser roll welding. Weld. J. Res. Suppl. 2004, 83, 16–26. Casalino, G.; Mortello, M. Modeling and experimental analysis of fiber laser offset welding of Al-Ti butt joints. Int. J. Adv. Manuf. Technol. 2016, 83, 89–98. [CrossRef] Casalino, G.; Guglielmi, P.; Lorusso, V.D.; Mortello, M.; Peyre, P.; Sorgente, D. Laser offset welding of AZ31B magnesium alloy to 316 stainless steel. J. Mater. Process. Technol. 2017, 242, 49–59. [CrossRef] Miranda, R.M.; Assunção, E.; Silva, R.J.C.; Oliveira, J.P.; Quintino, L. Fiber laser welding of NiTi to Ti-6Al-4V. Int. J. Adv. Manuf. Technol. 2015, 81, 1533–1538. [CrossRef] Pardal, G.; Meco, S.; Ganguly, S.; Williams, S.; Prangnell, P. Dissimilar metal laser spot joining of steel to aluminium in conduction mode. Int. J. Adv. Manuf. Technol. 2014, 73, 365–373. [CrossRef] Kumar, S.; Nadendla, H.B.; Scamans, G.M.; Eskin, D.G.; Fan, Z. Solidification behavior of an AA5754 alloy ingot cast with high impurity content. Int. J. Mater. Res. 2012, 103, 1228–1234. [CrossRef] Smith, W.F. Structure and Properties of Engineering Alloys, 1st ed.; McGraw-Hill: New York, NY, USA, 1992; pp. 186–191. ISBN 0-07-59172-5. Davis, J.R. Aluminum and Aluminum Alloys, 1st ed.; ASM International: Geauga County, OH, USA, 1993; ISBN 978-0-87170-496-2. Miao, Y.G.; Han, D.F.; Yao, J.Z.; Li, F. Microstructure and interface characteristics of laser penetration brazed magnesium alloy and steel. Sci. Technol. Weld. Join. 2010, 15, 97–103. [CrossRef] Kobayashi, S.; Yakou, T. Control of intermetallic compound layers at interface between steel and aluminum by diffusion-treatment. Mater. Sci. Eng. A 2002, 338, 44–53. [CrossRef] Sun, J.; Yan, Q.; Gao, W.; Huang, J. Investigation of laser welding on butt joints of Al/steel dissimilar materials. Mater. Des. 2015, 83, 120–128. [CrossRef] Qiu, R.; Shi, H.; Zhang, K.; Tu, Y.; Iwamotoc, C.; Satonaka, S. Interfacial characterization of joint between mild steel and aluminum alloy welded by resistance spot welding. Mater. Charact. 2010, 61, 684–688. [CrossRef] Messler, R.W. Principles of Welding: Processes, Physics, Chemistry, and Metallurgy, 1st ed.; Wiley-VCH: New York, NY, USA, 2007; pp. 406–423. ISBN 0-471-25376-6. Brooks, J.; Lippold, J. Welding, Brazing, and Soldering, 1st ed.; ASM International: Geauga County, OH, USA, 1993; ISBN 978-0-87170-382-8. Kumar, N.; Mukherjee, M.; Bandyopadhyay, A. Comparative study of pulsed Nd:YAG laser welding of AISI 304 and AISI 316 stainless steels. Opt. Laser Technol. 2017, 88, 24–39. [CrossRef] Sathiya, P.; Mishra, M.K.; Shanmugarajan, B. Effect of shielding gases on microstructure and mechanical properties of super austenitic stainless steel by hybrid welding. Mater. Des. 2012, 33, 203–212. [CrossRef] Cao, X.; Wallace, W.; Immarigeon, J.P.; Poon, C. Research and Progress in Laser Welding of Wrought Aluminum Alloys. II. Metallurgical Microstructures, Defects, and Mechanical Properties. Mater. Manuf. Process. 2003, 18, 23–49. [CrossRef] © 2017 by the authors. Licensee MDPI, Basel, Switzerland. This article is an open access article distributed under the terms and conditions of the Creative Commons Attribution (CC BY) license (http://creativecommons.org/licenses/by/4.0/).