Vol. 19: 111–127, 2013 doi: 10.3354/ab00527
AQUATIC BIOLOGY Aquat Biol
Published online September 24
OPEN ACCESS
Effects of ocean acidification and global warming on reef bioerosion—lessons from a clionaid sponge Max Wisshak1,*, Christine H. L. Schönberg2, Armin Form3, André Freiwald1 1
Senckenberg am Meer, Marine Research Department, 26382 Wilhelmshaven, Germany Australian Institute of Marine Science (AIMS), University of Western Australia, Crawley, Western Australia 9006, Australia 3 GEOMAR Helmholtz Centre for Ocean Research, Marine Biogeochemistry, 24105 Kiel, Germany
2
ABSTRACT: Coral reefs are under threat, exerted by a number of interacting effects inherent to the present climate change, including ocean acidification and global warming. Bioerosion drives reef degradation by recycling carbonate skeletal material and is an important but understudied factor in this context. Twelve different combinations of p CO2 and temperature were applied to elucidate the consequences of ocean acidification and global warming on the physiological response and bioerosion rates of the zooxanthellate sponge Cliona orientalis — one of the most abundant and effective bioeroders on the Great Barrier Reef, Australia. Our results confirm a significant amplification of the sponges’ bioerosion capacity with increasing p CO2, which is expressed by more carbonate being chemically dissolved by etching. The health of the sponges and their photosymbionts was not affected by changes in p CO2, in contrast to temperature, which had significant negative impacts at higher levels. However, we could not conclusively explain the relationship between temperature and bioerosion rates, which were slightly reduced at both colder as well as warmer temperatures than ambient. The present findings on the effects of ocean acidification on chemical bioerosion, however, will have significant implications for predicting future reef carbonate budgets, as sponges often contribute the lion’s share of internal bioerosion on coral reefs. KEY WORDS: Global change · Carbon dioxide · Temperature · Bioerosion · Cliona orientalis · Great Barrier Reef
INTRODUCTION The growing human population has severe environmental impacts, often summarised under the term ‘global change’. In the marine realm, 2 of the main forces causing significant changes are global warming and ocean acidification (OA), both largely driven by the burning of fossil fuels that has led to the current dramatic rise in carbon dioxide partial pressure (p CO2) and increasing sea surface temperatures. Coral reefs are perceived as one of the main victims of this development, where warming and OA potentially have significant consequences for the calcium carbonate (CaCO3) balance (Hoegh-Guldberg et al. 2007, Erez et al. 2011, Veron 2011). While the com*Email:
[email protected]
plex effects of temperature may both promote or interfere with coral calcification (Reynaud et al. 2003, Rodolfo-Metalpa et al. 2011), OA was demonstrated to have chiefly negative effects on health, reproduction, growth, and survival of corals and other marine biota (De’ath et al. 2009, Kroeker et al. 2010, 2013, Andersson et al. 2011, Pandolfi et al. 2011). Nevertheless, some organisms and processes appear to benefit in a high-CO2 world, as evidenced for instance by greater cover of non-calcareous macrophytes and the massive coral Porites — but also a significant increase of internal macrobioerosion within the latter species at a Papua New Guinean coral reef with a naturally reduced pH (Fabricius et al. 2011). Bioerosion is a key process in the carbonate budget © The authors 2013. Open Access under Creative Commons by Attribution Licence. Use, distribution and reproduction are unrestricted. Authors and original publication must be credited. Publisher: Inter-Research · www.int-res.com
112
Aquat Biol 19: 111–127, 2013
of coral reefs, yet it is understudied. It acts at various scales and is performed by a multitude of organisms encompassing chemical and/or mechanical means during superficial grazing, attachment, or internal micro- and macrobioerosion (e.g. Wisshak & Tapanila 2008, Tribollet & Golubic 2011, Tribollet et al. 2011). While healthy reefs maintain a positive budget or at least equilibrium between calcification and bioerosion, certain environmental conditions can tip the scale towards erosion (e.g. Glynn 1997, Perry et al. 2008). Acknowledging the importance of bioerosion for structuring coral reefs, recent experimental studies have looked at the effects of OA and confirmed an acceleration of bioerosion with increasing p CO2 for 2 principal agents of internal bioerosion: phototrophic microbial euendoliths (Tribollet et al. 2006, 2009, Reyes-Nivia et al. 2013) and bioeroding sponges (Wisshak et al. 2012). These studies considered OA as the sole factor or used fixed scenarios preventing separate evaluation of environmental factors, and we still cannot answer how global warming may support, balance, or counteract increasing rates of reef bioerosion. Different scenarios may be possible for temperature effects on chemical bioerosion (i.e. biogenic dissolution of CaCO3), because on the one hand, the speed of a biochemical reaction is directly proportional to temperature (Atkins & De Paula 2009), but on the other hand, the capacity of physicochemical dissolution of CaCO3 in seawater is negatively proportional to temperature (Mehrbach et al. 1973), possibly counteracting the effects of OA on bioerosion (Wisshak et al. 2012). In the present study, we report observations on sponge bioerosion affected by OA, global warming, and their interactions, resulting from an experiment involving 12 different combinations of temperature and p CO2. The bioeroding organism chosen for the experiment was Cliona orientalis Thiele, 1900, a dominant and rapidly bioeroding, zooxanthellate sponge and member of the ‘Cliona viridis species complex’ which is ubiquitous on tropical coral reefs worldwide (Schönberg 2000, 2002a,b, van Soest et al. 2013). C. orientalis may reach several square metres in colony surface area at over 1 cm of penetration depth, and routinely invades and kills live corals (Schönberg 2000, Schönberg & Wilkinson 2001). C. orientalis was reported to survive and increase in abundance after a heating event causing severe coral bleaching (Schönberg & Ortiz 2009), and it is particularly robust and overall very suitable for experimental studies (Schönberg & Wilkinson 2001, Schönberg 2002b, Wisshak et al. 2012). C. orientalis erodes by biochemical dissolution, leading to the formation of cup-shaped grooves
and the mechanical extraction of so-called sponge chips (Schönberg 2008), a very effective mode of penetration resulting in annual bioerosion rates of >10 kg CaCO3 m−2 of calcareous substrate for this species (Schönberg 2002b). Within the local community of bioeroding sponges at the Great Barrier Reef, C. orientalis is the most abundant species with respect to the infested reef surface area (Schönberg & Ortiz 2009), and owing to its high rate of bioerosion (Schönberg 2002b), it is also the most destructive one, emphasising the relevance of potential effects of climate change on the bioerosion rate of this species.
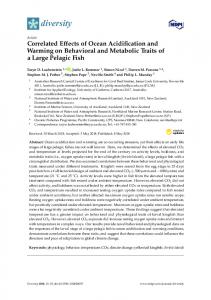
MATERIALS AND METHODS Sampling and maintenance of Cliona orientalis All sampling and experimental procedures were conducted at Orpheus Island Research Station (OIRS), located on Orpheus Island, central Great Barrier Reef, Australia (Fig. 1). The local community of bio-
Fig. 1. Location map of Queensland, with Orpheus Island (Palm Island Group) on the central Great Barrier Reef (top). The sample site in Little Pioneer Bay is just north of the Orpheus Island Research Station (OIRS)
Wisshak et al.: Global change impacts on sponge bioerosion
eroding sponges is diverse, comparatively well studied (e.g. Schönberg 2000, 2001), and has recently increased in abundance, possibly as a result of declining reef health related to a heating event resulting in widespread coral death (Schönberg & Ortiz 2009). At the leeward fringing reef, C. orientalis was coresampled in 1 to 3 m water depth from massive Porites sp. colonies with an air-drill and hole-saw (inner diameter: 30 mm), and later trimmed to 25 mm in length with an air-cutter, so that cores included spongepenetrated material in the upper half and clean coral skeleton below (see Fig. 1D in Wisshak et al. 2012). Individual variation in the amount of sponge tissue in C. orientalis cores was assumed to be insignificant, as evident from the very even erosion pattern in this species (Schönberg & Shields 2008) and the low standard deviations both for penetration depth as well as sponge biomass measured in 128 sponge-bearing cores taken from 10 different C. orientalis colonies in Little Pioneer Bay (see Table 1 in Wisshak et al. 2012). Cores were kept for 4 d in an outdoor flowthrough tank for recovery, allowing tissue to fully heal before transferring them to a constant-temperature room, offering an acclimatisation period of 24 h. Acclimatisation and experiments were conducted in total darkness to avoid fluctuations in pH caused by alterations of photosynthesis and respiration due to light/dark cycling and variations in temperature caused by lamps (Wisshak et al. 2012). Directly before and after the experiment, the condition of the sponge cores was documented with digital photography including a colour chart. Photographs were visually examined, assessing images on greyscale and colour, and scoring them as follows: 10: dark chocolate brown, 9: milk chocolate brown (normal before dark adaptation), 8: toffee brown, 7: brownochre (normal after dark adaptation), 6: ochre/yellow-ochre, 5: pale ochre, 4: very pale to translucent, 3: with patches of black disease, likely to recover, 2: most tissue black, but with small portions alive, unlikely to recover, 1: recently dead, black with white film, 0: dead, black, tissue mostly disintegrated. Thus we recorded paling when symbionts were shifted into deeper tissue layers, a process which is affected by light changes, but also by stress and other discolouration (Schönberg & Suwa 2007), with special attention given to tissue death. The photosymbiosis between the sponge and its dinoflagellate symbionts was assumed to be vital to the sponges’ health and physiological functions (e.g. Rosell 1993, Weisz et al. 2010, Hill & Hill 2012), and photosynthetic parameters were monitored in the dark-adapted samples at the beginning and at the
113
end of the experiment, using pulse-amplitude modulated fluorometry (PAM; Maxi-iPAM, Walz). Photosynthetic efficiency or quantum yield Fv /Fm (ratio of variable to maximum photosynthetic fluorescence) provided a proxy for the health of the symbionts, while baseline photosynthetic fluorescence F 0 was used as a proxy for chlorophyll concentration, allowing us to recognise whether symbionts were shifted deeper into the sponge cores, which can be a reaction to stress (e.g. Schönberg & Suwa 2007).
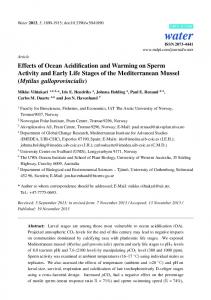
Experimental setup All experiments were performed under constant conditions under which the sponge-bearing cores were subjected to different standardised measurements and sampling protocols in a semi-closed system (Fig. 2). To establish consistent water quality and properties throughout the experiment, ambient seawater was filtered to 5 µm (thereby retaining picoplankton < 3 µm as the main source of nutrition, see e.g. Lynch & Phlips 2000), and stored in a 600 l reservoir tank connected to a pump and UV unit. Stable experimental temperatures were achieved through climate control of the entire room. A series of 4 independent 72 h experiments were run at ~22°C (colder than ambient), ~25°C (ambient), ~28°C (warmer than ambient), and ~31°C (stress temperature). Each set of temperatures was run against 3 levels of p CO2 (present-day: ca. 400 µatm, moderately elevated: ca. 750 µatm, and strongly elevated: ca. 1700 µatm), resulting in a treatment matrix with 12 different combinations of temperature and p CO2. The different p CO2 levels were achieved by perturbation with gases specifically mixed with Digamix 5KA 36A/9 pumps on M755-1.2 consoles (H. Wösthoff) using food-grade CO2 and compressed air with ambient p CO2, and only compressed air for the present-day p CO2. Each treatment included 4 replicate bioreactors (graded 3 l beakers), each with 8 sponge-bearing cores sitting on a tethered plastic grid in an aliquot of 2.5 l of pre-filtered seawater taken from the reservoir tank. Since donor effects can be caused by genetic differences of the sampled sponges (Maldonado et al. 2008), we attempted the best possible spread of donor diversity per bioreactor, with cores from at least 6 specimens per set. Due to sampling restrictions, we were unable to include true controls (clean coral cores), but we had demonstrated earlier that over such a short period of time, potential abiotic chemical dissolution of the substrate or possible bio-
114
Aquat Biol 19: 111–127, 2013
Fig. 2. Setup of experimental system situated in a constant temperature room at Orpheus Island Research Station with individual semi-closed bioreactors (4 replicates per treatment level), carrying 8 sponge-bearing cores each, and 1 bioreactor with seawater only for monitoring purposes, all situated in a larger tank to maintain the respective treatment temperature. The moderately and strongly elevated pCO2 levels were adjusted by perturbation with specifically mixed gases; for the present-day scenario, compressed air was used. Pre-filtered seawater for all treatments was taken from an aerated 600 l reservoir tank connected to a pump and UV unit
erosion by microendoliths remains negligible, even under strongly elevated p CO2 (Wisshak et al. 2012). However, in each treatment, one additional bioreactor with seawater only (blank) served the purpose of monitoring the water chemistry. The temperature in the bioreactors was kept very stable by placing them into 150 l temperature buffer tubs with water adjusted to the constant room temperature. Uniform perturbation per bioreactor proceeded via a flow controller that pumped the gas mixes into the bioreactors at fixed, equal rate per bioreactor, and inert silicon tubing was used in order to prevent stress potentially exerted by plasticisers. The constant perturbation effectively resulted in mixing that prevented the water from becoming dysoxic. A lid covered each bioreactor in order to minimise evaporation and stabilise the p CO2 in the headspace filled with the gas mixture. Humidifying the gas flow in gas-wash bottles filled with de-ionised water further reduced risk of evaporation, which was found to be negligible at 0.2 ± 0.1% d−1 on average (n = 60). The 72 h exposure period in potentially stressful conditions inherent to laboratory experiments or crowded aquaria (Osinga et al. 1999) is well within the tolerance limits of Cliona orientalis. We tested our experimental setup in an additional 5 d experimental run at ambient temperature (25°C) and present-day p CO2. Daily carbonate system assessments indicated that all sponges continuously bioeroded and survived with few if any stress symptoms. In addition, after the series of p CO2 × temperature treatments, all surviving sponges were transferred back into an outdoor flow-through system and fully recovered.
Carbonate system parameters As a basis for an accurate assessment of the amount of CaCO3 dissolved by Cliona orientalis during the experiment, the seawater carbonate system and the variables characterising or controlling this system were closely monitored (equilibria between aqueous carbon dioxide CO2aq, bicarbonate HCO3−, and carbonate ions CO32−; see Zeebe & Wolf-Gladrow 2001 for a review). This comprised measurements of the dissolved inorganic carbon (DIC), total alkalinity (TA), pH, temperature, salinity, and dissolved inorganic nutrients. Based on these variables, the remaining carbonate system parameters, as well as the dissolution of carbonate, were quantified (see Table 1). During the experiment, temperature was recorded in 5 min intervals with Starmon Mini highresolution loggers (Star Oddi; accuracy: ± 0.02°C). Water samples were taken and sterile-filtered with 0.2 µm PES filters at the start and end of the experiment. Samples for DIC and TA were treated with 0.02 vol % saturated HgCl2 solution to arrest biological activity, whereas samples for nutrient analyses were left untreated, but stored refrigerated and in the dark. Before water sampling, salinity was measured on the PSS scale using a SevenGo DUO meter (Mettler-Toledo) equipped with an InLab 738-ISM conductivity probe calibrated daily with 12.88 mS cm−1 NIST-certified buffer solution. The relative order and timing of all procedures was kept constant over the course of the experiments to avoid natural diurnal variation (Wisshak et al. 2012).
Wisshak et al.: Global change impacts on sponge bioerosion
Prior to chemical analyses, pH of the water samples was quantified on the total scale using a flatmembrane glass electrode (6.0256.100; Deutsche Metrohm) calibrated against seawater standards of known pH to match ionic strength between samples and buffer solutions. Nitrate, nitrite, and phosphate were evaluated photometrically (U-2000; Hitachi) according to standard methods described by Hansen & Koroleff (1999) with precision levels of ± 0.5, ± 0.02, and ± 0.05 µmol l−1, respectively; ammonium was quantified fluorometrically (SFM 25; Kontron Instruments) according to Holmes et al. (1998) to ± 0.08 µmol l−1. TA was determined in duplicate, using potentiometric open-cell titration following Dickson et al. (2003). Seawater was weighed (1416B MP8-1; Sartorius) and titrated with 0.005 N HCl in an automatic titrator (Titrando 808; Deutsche Metrohm); the average precision between duplicate water samples was ≤4 µmol kg−1. DIC was measured photochemically following Stoll et al. (2001) using an automated segmented flow analyser (QuAAtro; Bran+Luebbe) equipped with an autosampler (± 5 μmol kg−1 precision). Both TA and DIC were calibrated with certified seawater reference material (CRM standards supplied by Andrew Dickson, Scripps Institution of Oceanography). The carbonate system was computed from the obtained temperature, salinity, TA, and pH using the CO2SYS program (EXCEL macro v. 2.1; Pierrot et al. 2006) with dissociation constants for carbonic acid from Mehrbach et al. (1973) as refit by Dickson & Millero (1987) and the KSO4 dissociation constant from Dickson (1990). TA and pH were chosen for the carbonate system calculations in order to avoid inconsistencies in carbonate chemistry potentially affected from calculations by DIC and TA (Hoppe et al. 2012). Moreover, as a control of the whole procedure, the measured pH values were compared with calculated pH values (via DIC and TA) and found to differ by only 1.3 ± 1.6% on average (n = 108).
Assessment of bioerosion rates Carbonate dissolution (mg bioreactor–1) was computed by adapting the alkalinity anomaly technique (Smith & Key 1975, Chisholm & Gattuso 1991) from the change in total alkalinity ΔTA during the 72 h of incubation, involving a correction for nitrogen nutrients and phosphate according to Jacques & Pilson (1980), and using the TA definition of Dickson et al. (2003) (Eq. 1).
115
ΔCaCO3 = 0.5 × [ΔTA + ΔPO4 − ΔNH4 + Δ(NO3 + NO2)] × 100 × Vsw × ρsw /103 (1) The factor 0.5 reflects the 2:1 relationship between the increase of TA during carbonate dissolution, the multiplier 100 is the molecular mass of CaCO3, Vsw the seawater volume per bioreactor (l), ρSW the density of seawater (kg l−1) as a function of temperature and salinity calculated with R using the package ‘SeaCarb’ version 2.4 (www.cran.r-project.org/ package=seacarb), and the divider 103 converts to the weight unit milligrams. Evaluation of bioerosion in the 31°C treatment was complicated by cases of sponge mortality in 5 out of the 12 bioreactors. The affected sponge tissue turned black, fouling the water and making it more viscous and impossible to filter, thus disabling accurate measurements for carbonate system calculations — therefore data from these bioreactors were excluded from all analyses except for a health assessment. The remaining 7 bioreactors in the 31°C treatment yielded high nutrient concentrations at the end of the experiment, with ammonium levels above the threshold for accurate determination (dilution factor > 8). In order to allow adequate correction for nutrients, a conservative estimation of 100 µmol l−1 was applied, i.e. a level just above the highest values of ammonium with measurements within the threshold of accurate determination. Dissolved CaCO3 was then converted to chemical bioerosion rates as kg m−2 yr−1 by relating the value to the combined sponge tissue surface area of the 8 cores in each bioreactor. Core-sampling generated new surface with feeding apertures, i.e. the sponge was not only supported by the upper circle of original surface, but also by a ring of healed surface around the sides of the cores. As bioerosion underneath this ring-shaped surface area acted on skeleton also underneath the upper surface area, we included only half of this surface into the reference unit in order not to underestimate bioerosion rates. Ring surface area was calculated using the mean tissue penetration depth of 1.32 ± 0.14 cm, which was determined from min/max measurements in 128 sponge-bearing cores taken from 10 different Cliona orientalis colonies in Little Pioneer Bay.
Statistical analyses All statistical calculations used means per bioreactor, which represented the replicate level. Despite running the temperature treatments in a temporal se-
116
Aquat Biol 19: 111–127, 2013
quence, they were regarded as independent, because each time the experiment was adjusted to a new temperature and new sponge cores were used. Mortality occurred in the 31°C stress treatment, which resulted in the removal of 5 replicates (bioreactors) in the respective datasets relating to photosynthesis parameters and bioerosion, but ‘sponge health’ remained fully replicated, because ‘death’ was part of the health assessment and a result. Increased variation of response values in the extreme treatments also meant that heteroscedasticity was common, and some other assumptions such as normal distribution were occasionally violated as well, which could not always be removed by transformation. Simple non-parametric Kruskal-Wallis tests allowed for neither the recognition of interaction effects nor for post hoc analysis at treatment level. Therefore, we looked for general differences in 5 separate, non-parametric permutational multivariate analysis of variance (PERMANOVA) models calculated in the software Primer 6 and PERMANOVA (Anderson 2005) based on resemblance matrices with Euclidean distance, with 9999 permutations of residuals under a reduced model and with Type III sums of squares (Anderson et al. 2008; models for ‘health score’, ‘Fv /Fm’, ‘F0’, ‘bioerosion rate’, and ‘ΔNH4’). The experimental factors were entered as fixed effects (p CO2 with 3 levels: presentday, moderately elevated, and strongly elevated; temperature with 4 levels: 22, 25, 28, and 31°C). Significant results were followed up with PERMANOVA pairwise comparisons. Evaluations of ‘health score’, ‘Fv /Fm’, and ‘F0’ partly depended on chlorophyll concentrations in the surface layer of the sponge. They slightly differed between sponge individuals and also were slightly affected by the acclimatisation to constant dark (see Fig. 4 for differences comparing ‘before’ with ‘after’ values employing Wilcoxon signed rank tests performed in SPSS 19, IBM). Therefore, these parameters were statistically tested in PERMANOVA as % of the originally measured value. We then checked relationships between treatments and response values in multiple linear regressions in SPSS. While this was used to answer the central cause-effect query, we also displayed results of additional simple linear regressions to obtain more detailed information on causes and responses and to provide equations for individual settings, e.g. for modelling purposes. The linear regressions may also be useful, because the relationship between ‘bioerosion rate’ and temperature remained unclear, and at the same time a weak interaction effect was found between temperature and p CO2. Therefore, for ‘bioerosion rate’, it is more accurate to regard the results
for subsets of data than for the multiple linear regression. Slope equations resulting from regressions led to predictions for bioerosion under future conditions (SigmaPlot 12; Systat).
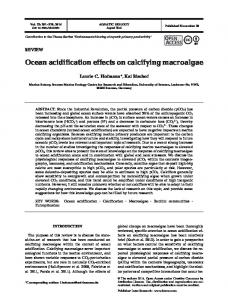
RESULTS General physiological responses Physiological responses not directly related to bioerosion were monitored for Cliona orientalis: health of the sponge cores and their photosymbionts by visual assessment and by PAM, mortality, recovery, and quantification of dissolved nutrients in the culture water (Figs. 3 & 4, Table 1). An overall slight paling of sponge cores was observed after 1 d in darkness for acclimatisation (cf. Fig. 3a & 3d). While sponges in the 22°C treatment retained their healthy appearance, paling increased with higher temperatures, and F0 decreased (Fig. 3d), suggesting that gradually more zooxanthellae were moved away from the surface and deeper into the sponge body. A number of dead or partially dead cores occurred in the 31°C stress temperature treatment (Fig. 3c), which was the only situation in which photosynthetic efficiency was also slightly lowered (Fig. 4f). Visual health score and photosynthetic parameters decreased between ‘before’ and ‘after’ the experiment (Fig. 3d−f). However, these responses only differed with and were only correlated to temperature increase, not to increased p CO2 (Table 2; and Tables S1 & S2 in the Supplement at www.int-res.com/articles/suppl/b019 p111_supp.pdf). Thus no negative effect could be attributed to elevated p CO2, but it may have reduced the temperature stress, as evidenced by our bar graphs (Fig. 4c,f,i) and possibly supported by interaction effects near the significance threshold for Fv /Fm and F0 (Table 2). All cores fully recovered within a week after being placed back into the outdoor flowthrough tanks (Fig. 3b), except for those that were already dead or nearly dead. Cores with smaller black patches lost the affected tissue but recovered. Initial levels of all examined nutrients in the filtered culture water were very low at 0.06 ± 0.11 µmol l−1 NO3, 0.02 ± 0.02 µmol l−1 NO2, 0.04 ± 0.04 µmol l−1 PO4, and 0.48 ± 0.85 µmol l−1 NH4 (all replicates; n = 48). At the end of the experiment, the levels for nitrate, nitrite, and phosphate had increased but remained at a low level, with mean values per treatment < 2.60 µmol l−1 (Table 1). In contrast, ammonium levels increased and varied considerably. This increase (ΔNH4 = 10.95 ± 15.78 µmol l−1 at 22°C, 28.91
Wisshak et al.: Global change impacts on sponge bioerosion
117
Fig. 3. Monitoring of Cliona orientalis health in symbiosis with zooxanthellae, ‘before’ (= after acclimatisation) and ‘after’ the experiment in continuous dark. Only representative figures for different temperature treatments are shown; different p CO2 did not change the appearance within temperature levels. One replicate set of 8 sponge cores each (a) ‘before’ the experiment, (b) ‘after’ the experiment and a recovery period of several days in ambient temperature and flow-through conditions, and (c) a set of dead cores from the 31°C treatment. Appearance of cores at each temperature level (d) ‘before’ and ‘after’ the experiment, and corresponding pulse-amplitude modulated fluorometry (PAM) images illustrating (e) photosynthetic efficiency Fv /Fm and (f) the proxy for chlorophyll concentration F0
± 21.70 µmol l−1 at 25°C, 44.09 ± 32.97 µmol l−1 at 28°C, and a critical level of 98.73 ± 15.78 µmol l−1 at 31°C) showed significant correlation with temperature but not with p CO2 (Table 2).
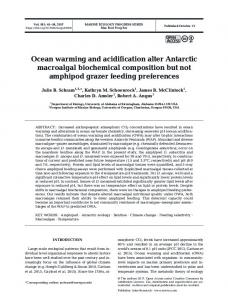
Bioerosion rates Bioerosion by Cliona orientalis differed significantly with p CO2 and temperature, and the factors interacted (Figs. 4j & 5, Table 2). Interaction was most
likely caused by the fact that pairwise comparisons between p CO2 levels were always significant, except at 31°C, where omission of replicates resulted in the loss of support and the failure of finding significances (Table S1). This is expected to be a Type II error of not finding a difference when there should be one, because the plotted data still display the same trend as for the other 3 temperature levels (cf. Fig. 5d and 5a−c). However, in contrast to a clear linear and directly proportional relationship with pCO2, and consequently a negative correlation with pH (Fig. 5a−d,
118
Aquat Biol 19: 111–127, 2013
Fig. 4. Means of experimental response values (a,d,g) ‘before’ (= after acclimatisation period) and (b,e,h) ‘after’ the experiment, and as (c,f,i) percent of ‘before’, complemented by (j) the respective rates of chemical bioerosion. Error bars are SD. Displayed significances compare ‘before’ and ‘after’ values using a non-parametric Wilcoxon signed-rank test (partial tests separating out the effects of pCO2 and temperature (T) were conducted for ambient conditions of the respective other treatment factor). Significant values in bold. Five replicates for all ‘after’ and percentage datasets except for the health score were omitted due to mortalities in the 31°C treatment series
Wisshak et al.: Global change impacts on sponge bioerosion
119
Table 1. Experimental settings related to the carbonate system. List of measured (temperature, salinity, pH, mean and Δ total alkalinity [TA]) and computed carbonate system parameters (dissolved inorganic carbon [DIC], carbon dioxide partial pressure [p CO2], hydrogen carbonate [HCO3] and carbonate ion [CO3] molality, saturation states for aragonite [ΩAr] and calcite [ΩCa]), nutrients (nitrate [NO3], nitrite [NO2], ammonium [NH4], phosphate [PO4]), and rates of chemical sponge bioerosion. Salinity, pH, and TA were measured in duplicate. All values are given as mean ± SD among the replicates after 3 d of exposure Temp. level 22°C
Variable
Present-day p CO2
Moderately elevated p CO2
Temperature (°C) 21.8 ± 0.2 22.1 ± 0.2 Salinity (PSS) 34.2 ± 0.0 34.3 ± 0.0 pH (total scale) 8.00 ± 0.01 7.80 ± 0.01 TA (µmol kg−1) 2305.3 ± 12.6 2384.9 ± 10.2 112.5 ± 23.2 266.8 ± 19.2 ΔTA (µmol kg−1) DIC (µmol kg−1) 2061.2 ±16.8 2227.8 ± 13.3 p CO2 (µatm) 455.0 ± 19.6 804.6 ± 27.3 HCO3 (µmol kg−1) 1869.4 ± 19.1 2076.3 ± 14.3 CO3 (µmol kg−1) 177.7 ± 3.8 126.8 ± 2.3 ΩAr 2.80 ± 0.06 2.00 ± 0.04 ΩCa 4.29 ± 0.09 3.06 ± 0.06 −1 ΔNO3 (µmol l ) 0.49 ± 1.14 1.26 ± 0.99 −1 ΔNO2 (µmol l ) 0.21 ± 0.46 0.74 ± 0.47 14.31 ± 19.33 16.67 ± 19.10 ΔNH4 (µmol l−1) −1 ΔPO4 (µmol l ) 0.86 ± 0.43 1.64 ± 0.19 Chemical bioerosion rate (kg m−2 yr−1) 0.15 ± 0.04 0.37 ± 0.05 25°C Temperature (°C) 23.9 ± 0.2 24.5 ± 0.2 Salinity (PSS) 34.3 ± 0.1 34.3 ± 0.0 pH (total scale) 8.04 ± 0.00 7.84 ± 0.01 2317.9 ± 8.2 2414.1 ± 9.8 TA (µmol kg−1) ΔTA (µmol kg−1) 178.0 ± 13.4 368.0 ± 22.9 2031.8 ± 6.3 2221.5 ± 12.9 DIC (µmol kg−1) p CO2 (µatm) 418.2 ± 2.6 742.2 ± 21.7 HCO3 (µmol kg−1) 1814.0 ± 5.0 2050.5 ± 14.3 −1 CO3 (µmol kg ) 205.7 ± 1.8 150.0 ± 2.5 ΩAr 3.27 ± 0.03 2.39 ± 0.04 ΩCa 4.98 ± 0.04 3.63 ± 0.06 −1 ΔNO3 (µmol l ) 1.16 ± 0.36 0.75 ± 0.59 −1 ΔNO2 (µmol l ) 0.90 ± 0.14 0.94 ± 0.29 ΔNH4 (µmol l−1) 35.88 ± 31.10 20.96 ± 11.47 −1 2.25 ± 0.85 2.58 ± 0.95 ΔPO4 (µmol l ) Chemical bioerosion rate (kg m−2 yr−1) 0.21 ± 0.04 0.51 ± 0.04 28°C Temperature (°C) 27.8 ± 0.3 27.9 ± 0.3 Salinity (PSS) 34.3 ± 0.0 34.3 ± 0.0 pH (total scale) 8.03 ± 0.02 7.81 ± 0.02 TA (µmol kg−1) 2283.2 ± 10.0 2359.0 ± 20.7 −1 ΔTA (µmol kg ) 90.7 ± 19.4 238.5 ± 41.9 DIC (µmol kg−1) 1973.4 ± 21.8 2157.2 ± 26.5 p CO2 (µatm) 418.9 ± 28.8 773.8 ± 42.9 HCO3 (µmol kg−1) 1741.4 ± 28.8 1981.8 ± 29.0 −1 CO3 (µmol kg ) 221.0 ± 8.0 155.2 ± 4.6 ΩAr 3.58 ± 0.13 2.52 ± 0.08 ΩCa 5.39 ± 0.19 3.78 ± 0.11 −1 ΔNO3 (µmol l ) 1.06 ± 0.77 2.06 ± 0.83 −1 1.51 ± 0.12 1.99 ± 0.75 ΔNO2 (µmol l ) ΔNH4 (µmol l−1) 31.98 ± 30.48 70.90 ± 5.25 −1 1.61 ± 1.24 1.76 ± 0.63 ΔPO4 (µmol l ) Chemical bioerosion rate (kg m−2 yr−1) 0.09 ± 0.02 0.25 ± 0.06 30.9 ± 0.1 30.8 ± 0.1 31°Ca Temperature (°C) Salinity (PSS) 34.8 ± 0.0 34.9 ± 0.0 pH (total scale) 8.07 ± 0.01 7.92 ± 0.01 TA (µmol kg−1) 2350.2 ± 16.9 2403.7 ± 13.4 −1 ΔTA (µmol kg ) 180.7 ± 23.4 279.9 ± 33.2 DIC (µmol kg−1) 1974.6 ± 24.1 2120.4 ± 8.9 p CO2 (µatm) 380.0 ± 21.4 598.6 ± 8.8 HCO3 (µmol kg−1) 1699.2 ± 27.6 1897.3 ± 6.6 −1 CO3 (µmol kg ) 266.0 ± 4.1 208.3 ± 3.8 4.36 ± 0.07 3.41 ± 0.06 ΩAr ΩCa 6.50 ± 0.10 5.08 ± 0.09 −1 ΔNO3 (µmol l ) 0.90 ± 0.02 1.69 ± 1.00 −1 2.03 ± 0.41 2.15 ± 0.39 ΔNO2 (µmol l ) ΔNH4 (µmol l−1)b 98.94 ± 0.82 97.93 ± 2.36 −1 1.76 ± 0.90 2.29 ± 1.61 ΔPO4 (µmol l ) Chemical bioerosion rate (kg m−2 yr−1) 0.13 ± 0.03 0.28 ± 0.05 a 5 replicates excluded due to mortality in the 31°C treatment b End concentrations exceeding upper limit of measurement range were set to 100 µmol l−1
Strongly elevated p CO2 22.1 ± 0.2 34.3 ± 0.0 7.52 ± 0.01 2607.3 ± 33.7 711.3 ± 67.1 2553.2 ± 35.0 1782.2 ± 49.1 2420.5 ± 33.7 78.1 ± 1.5 1.23 ± 0.02 1.88 ± 0.04 0.41 ± 0.83 0.18 ± 0.31 1.87 ± 2.41 0.86 ± 0.59 1.04 ± 0.10 24.5 ± 0.2 34.3 ± 0.0 7.57 ± 0.01 2614.0 ± 25.3 766.5 ± 41.6 2526.3 ± 26.2 1594.7 ± 53.5 2384.7 ± 25.7 96.3 ± 3.1 1.54 ± 0.05 2.33 ± 0.08 1.23 ± 0.55 0.97 ± 0.13 29.90 ± 21.87 1.99 ± 0.97 1.09 ± 0.04 27.9 ± 0.3 34.3 ± 0.0 7.55 ± 0.02 2583.5 ± 20.2 676.2 ± 23.7 2487.5 ± 14.0 1676.8 ± 67.1 2342.9 ± 11.6 100.9 ± 4.6 1.64 ± 0.08 2.46 ± 0.11 2.07 ± 0.75 1.87 ± 0.49 29.39 ± 39.83 0.97 ± 0.63 0.95 ± 0.08 30.8 ± 0.1 34.9 ± 0.0 7.56 ± 0.01 2705.9 ± 86.7 900.7 ± 171.1 2581.5 ± 86.5 1710.8 ± 65.2 2417.4 ± 82.5 122.1 ± 2.4 2.00 ± 0.04 2.98 ± 0.06 0.15 ± 0.21 1.92 ± 0.11 99.73 ± 0.38 2.43 ± 1.82 1.18 ± 0.25
120
Aquat Biol 19: 111–127, 2013
Tables 2, S1 & S2), no clear relationship with temperature could be demonstrated, also evidenced by only few and weakly significant differences found when testing temperature levels pairwise against each other (Fig. 4j, Tables 2, S1 & S2). The weaker and somewhat inconclusive temperature effect was confirmed by the multiple linear regressions yielding a clear significance for the factor p CO2 and a negligible contribution of temperature (Table S2). At any given p CO2 level, bioerosion rates were highest at 25°C (approx. ambient winter temperature), and slightly decreased towards colder as well as towards warmer temperatures (Fig. 4j). Temperature effects on bioerosion rates were most pronounced between 25 and 28°C, whereas for 22 and 31°C, intermediate rates were determined (Table S1). The well-defined slopes of the linear regressions for bioerosion at different levels of p CO2 were nearly identical for 22, 25, 28, and 31°C, which again shows the low impact of
temperature (Fig. 5a−d). Based on the very well supported results of the multiple linear regression, and the fact that the overall equation is very clearly driven by p CO2, rather than temperature (Fig. 5e, Table S2), equations for chemical sponge bioerosion rates with respect to p CO2 (Eq. 2) and to pH (Eq. 3) were derived from this, complemented by a regression expressing the % increase relative to the present-day p CO2 (Eq. 4): Chemical bioerosion rate (kg m−2 yr−1) = 0.0007 p CO2 (µatm) − 0.1547
(2)
Chemical bioerosion rate (kg m−2 yr−1) = −1.8665 pH + 15.082
(3)
Chemical bioerosion (% of present-day rate) = 0.5989 p CO2 (µatm) − 130.79
(4)
The latter equation was applied for plotting the percent increase in chemical sponge bioerosion for 3 of the Special Report on Emissions Scenarios (SRES) as illustrated in Fig. 6. Table 2. PERMANOVAs with Type III sums of squares and 9999 permutaKeeping methodological differences in tions of residuals for the dependent variables health score, photosynthetic efficiency (Fv /Fm), chlorophyll concentration (F0), chemical bioerosion rate, mind (see ‘Discussion’), a comparison of and ΔNH4, with fixed effects, 3 levels for carbon dioxide partial pressure the regression for total Cliona orientalis (p CO2), and 4 for temperature (T) . Significant values in bold bioerosion (data from Wisshak et al. 2012) with the chemical bioerosion rates reSource of df SS MS Pseudo-F p Unique ported herein allows a tentative deducvariation (perm) perm tion of the ratio between chemical and Health score (% of ‘before’ values) mechanical bioerosion and its change with 2 163.9 82.0 0.4199 0.6606 9953 p CO2 increasing p CO2 (Fig. 7). While under T 3 20272.0 6757.3 34.6160 0.0001 9957 6 1203.3 200.6 1.0273 0.4298 9948 p CO2 × T present-day conditions apparently only Residual 36 7027.5 195.2 9.2% of the substrate was removed by Total 47 28667.0 chemical dissolution, this fraction almost Fv /Fm (% of ‘before’ values)a tripled to 26.5% at 1500 µatm p CO2. p CO2 2 4.0 2.0 1.3826 0.2655 9959 T 3 593.4 197.8 6 19.6 3.3 p CO2 × T Residual 31 45.0 1.5 Total 42 641.0 F0 (% of ‘before’ values)a p CO2 2 36.5 18.2 T 3 2390.3 796.8 6 260.8 43.5 p CO2 × T Residual 31 442.7 14.3 Total 42 3201.6 Chemical bioerosion rate (kg m−2 yr−1)a p CO2 2 6.0 3.0 T 3 0.2 0.1 6 0.1 0.0 p CO2 × T Residual 31 0.2 0.0 Total 42 6.7 ΔNH4 (µmol l−1)a p CO2 2 1129.8 564.9 T 3 27577.0 9192.5 6 3930.1 655.0 p CO2 × T Residual 31 14604.0 471.1 Total 42 48357.0 a
136.1600 2.2476
0.0001 0.0621
9949 9948
DISCUSSION 1.3 55.8 3.0
0.2995 0.0001 0.0191
9952 9935 9930
597.8 11.7 3.2
0.0001 0.0001 0.0132
9961 9951 9949
1.2 19.5 1.4
0.3131 0.0001 0.2456
9945 9947 9955
5 replicates excluded due to mortality in the 31°C treatment
General conclusions relating to the experimental conditions We were able to show that, despite conducting the experiment in continuous darkness, the photosymbiotic sponge Cliona orientalis was not impaired for the short duration of the experiment. Zooxanthellae were shifted deeper into the sponge in darkness, as was expected (Schönberg & Suwa 2007), but this process was not uniform across treatment temperatures. Monitoring its visual appearance and the photosynthetic parameters Fv /Fm and F0 demonstrated
Wisshak et al.: Global change impacts on sponge bioerosion
121
Fig. 5. Rates of chemical bioerosion per replicate bioreactor as a function of p CO2 levels (present-day, moderately elevated, strongly elevated), and for the various temperature settings, with (a) ~22°C (colder than ambient), (b) ~25°C (ambient), (c) ~28°C (warmer than ambient), (d) ~31°C (stress temperature; representing only replicates without mortality), and (e) all treatments including the percent change relative to the present-day rates (blanks omitted). Linear regressions are plotted with 95% confidence and prediction bands and are highly significant for all treatments
122
Aquat Biol 19: 111–127, 2013
that while photosynthetic efficiency was temporarily reduced in cores in the 31°C treatment (Tables 1, 2 & S1), and health appearance and chlorophyll concentrations decreased with increasing temperature (Figs. 3 & 4, Tables 1, 2 & S1), all surviving cores quickly recovered to their original appearance under flow-through/ambient conditions after the experi-
Fig. 6. Projected percent increase in chemical sponge bioerosion relative to the present-day level, calculated for the BERN-CC model based on the Special Report on Emissions Scenarios (SRES) A2 (red), A1B (blue), and B1 (green)
Fig. 7. Chemical bioerosion rates from the present study’s 25°C treatment compared to the 25°C total bioerosion rates reported by Wisshak et al. (2012). The significant increase in total bioerosion rates is to a large extent governed by the increase in chemical bioerosion, while mechanical bioerosion increases only slightly. The fraction of chemical versus total bioerosion increases from 1/10 at 390 µatm to 1/5 at 1000 µatm and 1/4 at 1500 µatm
ment (Fig. 3b). While strongly increased temperature apparently had a negative effect on the sponge’s health and on the photosynthesis of its symbionts, p CO2 did not (Tables 2 & S1), or might even have had a slightly ameliorating effect on the temperature stress, a hypothesis which may be supported by interaction effects between temperature and p CO2 found near the significance level (Fig. 4c, Table 2). The effects of p CO2 on bioerosion can thus be identified as direct effects and were not caused by indirect impacts through lowered fitness. The experimentally determined carbonate dissolution can be assigned with confidence to chemical bioerosion by Cliona orientalis. In all 12 settings of the p CO2 × temperature treatment matrix, the culture seawater was saturated with respect to both aragonite and calcite (Ω > 1; Table 1), even under conditions where the lowest saturation state would be expected, i.e. the 22°C treatment with strongly elevated p CO2. In order to maintain a stable pH and saturation regime without a diurnal rhythmicity induced by CO2 uptake during photosynthesis of the photosymbionts and by increasing temperatures during the illumination phase, such as recorded by Wisshak et al. (2012), the experiment was run in constant darkness. Therefore, our bioerosion values may be underestimations, because zooxanthellate clionaids receive supplementing nutrients from their symbionts, and over longer periods erode more in light than in shade (Schönberg 2006 and references therein, Weisz et al. 2010). However, over a short period of only few days, this would not significantly affect bioerosion, as filter-feeding was not impaired, and clionaids are also known to assimilate dissolved nutrients from the water column (Maldonado et al. 2012). Moreover, clionaids may switch their symbiotic relationships depending on circumstances and digest zooxanthellae (Rosell 1993, Hill & Hill 2012). We would expect a lag period before physiological functions would be affected by the missing addition from the symbionts. A potential contribution of nonsponge endoliths to the recorded bioerosion in the coral cores that would have led to overestimated sponge bioerosion rates was assumed negligible based on the observation that substrate occupied by C. orientalis is not usually infested by other macroborers. Moreover, the overlying sponge tissue apparently prevents establishment of a significant microendolith community (coral matrix and potential microendoliths = mass of organics in coral substrate made up less than 1%; Fang et al. 2013). Important additional support for reporting unbiased sponge bioerosion is provided by the fact that control cores in a
Wisshak et al.: Global change impacts on sponge bioerosion
previous experiment did not lose weight during 10 d of exposure (Wisshak et al. 2012). While bacterial bioerosion in the 31°C treatment cannot be discounted, tissue death only occurred late in the experiment, thus only allowing a short period for bias, and apart from that, bioreactors with dead sponges were excluded from the calculations for bioerosion. We furthermore ruled out unrelated shifts in the carbonate system of the culture seawater by monitoring bioreactor blanks that did not contain any sponge or coral material, none of which exhibited a relevant ΔTA over the course of the experiment (Fig. 5a−d). Hence, the positive ΔTA in the bioreactors containing sponge cores is interpreted to be caused solely by chemical sponge bioerosion.
Influence of temperature and p CO2 on sponge bioerosion Temperature effects on Cliona orientalis bioerosion rates did not follow a clear linear trend in our experiment (Fig. 4j, Table S2) and may in part also reflect effects of the ammonium building up. The highest bioerosion rates were reached at the local ambient temperature of 25°C, decreasing towards colder as well as warmer temperatures. Overall, the influence of temperature on the bioerosion capacity of C. orientalis appears to be very low to negligible despite other physiological responses caused by heat (Fig. 4, Tables 1, 2, S1 & S2), particularly with respect to ammonium, that can be interpreted as a sign of excretion and/or disintegrative processes (Wright 1995, Francis-Floyd et al. 2009). The observed significant positive correlation of ammonium with temperature (Table 2) likely suggests increasing heat stress, with resulting ammonium and/or ammonia potentially acting as an additional indirect stressor (Bower & Bidwell 1978, Osinga et al. 1999). In contrast to temperature, p CO2 does not correlate with the observed ammonium levels (Table 2). However, high pH favours the formation of the more toxic ammonia (Osinga et al. 1999), which may partly explain the slightly more negative response in the low-p CO2 treatments (Fig. 4). Little is known about the rate of ammonium/ammonia generation and tolerance in sponges (Osinga et al. 1999). According to Sipkema et al. (2004), isolated cells of the Mediterranean demosponge Suberites domuncula (Olivi, 1792) were not affected by very high ammonium treatments (up to 25 000 µmol l−1; compared to our maximum of 100 µmol l−1), but were clearly negatively affected by heat (12 to 28°C). Moreover, the sponge samples
123
originated from a coastal reef that is subject to large fluctuations of seasonal and disturbance-related water quality (e.g. Fabricius & Dommisse 2000); however, they are very successful at this site (Schönberg & Ortiz 2009). We thus regard the overall effect of ammonium as smaller than the heat treatment. While the increase of ammonium levels across the temperature treatments was significant, the concentrations alone may not have been high enough to cause the observed mortality, but the strongly elevated ammonium in the 31°C treatment may well be a result of tissue death towards the end of the experiment. Sponge cores that survived the stress temperature yielded comparatively high bioerosion rates. Nevertheless, critically high sea surface temperatures may harm bioeroders to a similar degree as calcifiers and may trigger diseases, reduction in symbiont viability, and mortality in both organism guilds (Osinga et al. 1999, Schönberg et al. 2008). Temperature having little influence on sponge bioerosion rates was surprising and could possibly be explained by 3 partly antagonistic processes: (1) Acceleration of biochemical processes with increasing temperature may lead to increased rates of chemical bioerosion within metabolic tolerance limits (van’t Hoff equation and its derivations: 2 to 4× reaction speed with every 10°C increase; Q10 factor >1; Atkins & De Paula 2009). (2) Rising temperatures will reduce the physicochemical dissolution capacity of CaCO3 in seawater (Mehrbach et al. 1973) and may thus decrease bioerosion capabilities. (3) Metabolic processes inherent to Cliona orientalis may function best at local ambient temperature the sponge is adapted to. Options (1) and (2) may cancel each other out to some degree, but will only function within the limits of (3). The latter would also explain the observation of most pronounced bioerosion recorded at ambient conditions, because re-adaption to colder or warmer temperatures may cost energy and thus lead to a temporary loss in bioerosion efficiency as a trade-off. Our observation of temperature having little or possibly a non-linear effect on bioerosion rates was most recently confirmed for a related species, Cliona cf. celata Grant, 1826 (explants on scallop shells; Duckworth & Peterson 2013). The latter authors found no significant relationship between shell weight loss and temperature, using 26°C as an ambient setting and 31°C for the year 2100. Cliona orientalis chemical bioerosion rates consistently and significantly increased with increasing pCO2, and the present observations are thus in good
124
Aquat Biol 19: 111–127, 2013
accordance with earlier findings on total sponge bioerosion of the same species (Wisshak et al. 2012), as well as that of the related C. cf. celata (Duckworth & Peterson 2013; acid-regulated experiment with bioerosion rates doubling from pH 8.1 to 7.8). This clearly confirms our initial hypothesis that sponge bioerosion can be predicted to escalate with progressing OA. Applying Eq. (4), the increase of chemical bioerosion by C. orientalis converts to a 268.3% escalation by the end of this century, following the BERN-CC model based on the Special Report on Emissions Scenarios (SRES) A2 emission scenario (2100 p CO2 = 836 µatm; IPCC 2001). The most optimistic B1 model (p CO2 = 540 µatm) would lead to a 91.0% increase in C. orientalis chemical bioerosion, and the moderate A1B model (p CO2 = 703 µatm) to an elevation of 185.2% (Fig. 6). The observed rise in chemical bioerosion is one order in magnitude stronger than for total bioerosion of C. orientalis as predicted by Wisshak et al. (2012; compare to Fig. 5b therein). Predictions based on the Representative Concentration Pathways (RCPs; Meinshausen et al. 2011) — a set of 4 scenarios for use in climate modelling — result in similar figures of 86.5, 164.1, and 320.6% increase in C. orientalis chemical bioerosion for the RCP 4.5 (2100 p CO2 = 538 µatm), 6 (p CO2 = 670 µatm), and 8.5 (p CO2 = 936 µatm) scenarios, respectively. Hence, doubling to quadrupling of chemical bioerosion by C. orientalis can be expected by the year 2100, depending on which emission scenario is considered. At the same time, according to the IPCC (2001), surface air temperatures are expected to rise by 1.98°C (SRES B1 model) to 3.79°C (A2 model), which may push many tropical coral reefs into a temperature range where bioeroding sponges may be seasonally exposed to heat stress and possibly to mortality, thus limiting the range of the p CO2 effect on reef bioerosion. Sponge bioerosion is therefore much more clearly and strongly influenced by p CO2 than by temperature, and follows a directly proportional, linear trend for p CO2, while the response to temperature and/or ammonium is more complicated. Temperature may cause a threshold response with respect to the sponge’s physiology, and bioerosion ceases when other physiological functions are impaired. In contrast, the relationship between p CO2 and sponge bioerosion may act along 2 pathways: the acceleration of chemical bioerosion by lowering the pH gradient that needs to be overcome in the related biochemical reaction (Wisshak et al. 2012), and the enhancement of the sponges’ energy budget by translocation of carbon stemming from the photosymbionts (Weisz et al.
2010), a process that may be facilitated by OA, not inhibiting the sponge’s physiology. Considering the important role of bioeroding sponges for reef carbonate budgets (e.g. Acker & Risk 1985, Schönberg 2002b, Nava & Carballo 2008, Perry et al. 2008), observations that their abundances increased after disturbance and stress (e.g. Rützler 2002, Ward-Paige et al. 2005, Schönberg & Ortiz 2009), the fact that other organisms using chemical bioerosion exhibited similar trends in climate change studies (Tribollet et al. 2006, 2009, Reyes-Nivia et al. 2013), and that advanced internal bioerosion facilitates external bioerosion by grazers (e.g. Tribollet et al. 2011), we fully expect that total bioerosion will increase in future until the physiological limits of the involved organisms are reached. However, while short-term aquarium experiments were very conclusive with respect to the effects of p CO2 on bioerosion rates of single species or microbial communities (Tribollet et al. 2006, 2009, Wisshak et al. 2012, Reyes-Nivia et al. 2013), we only have very little evidence from natural environments at the community level and over longer periods of time (but see e.g. Fabricius et al. 2011). Therefore, further studies are required to understand future trends of bioerosion in a larger context and how they will affect reef carbonate budgets in different environments.
Chemical versus mechanical bioerosion in Cliona orientalis Sponge bioerosion is a process involving chemical etching that leads to the mechanical removal of sponge chips which are then expelled (e.g. Schönberg 2008). Compared to our value of 9% chemical bioerosion in Cliona orientalis, a considerable range of ratios between contributions of chemical and mechanical sponge bioerosion have been reported in the literature. Warburton (1958) estimated that