Open Access Proceedings
Drinking Water
Drink. Water Eng. Sci., 4, 25–35, 2011 www.drink-water-eng-sci.net/4/25/2011/ doi:10.5194/dwes-4-25-2011 © Author(s) 2011. CC Attribution 3.0 License.
Engineering and Science
Open Access
Open Access
Earth System
Effects of ozonation and temperature on the Science biodegradation of natural organic matter in biological granular activated carbon filters
Data
L. T. J. van der Aa1,2 , L. C. Rietveld2 , and J. C. van Dijk2 1
2
Waternet, P.O. Box 94370, 1090 GJ Amsterdam, The Netherlands Delft University of Technology, P.O. Box 5048, 2600 GA Delft, The Netherlands
Received: 13 January 2010 – Published in Drink. Water Eng. Sci. Discuss.: 1 February 2010 Revised: 10 January 2011 – Accepted: 10 January 2011 – Published: 28 January 2011
Abstract. Four pilot (biological) granular activated carbon ((B)GAC) filters were operated to quantify the
effects of ozonation and water temperature on the biodegradation of natural organic matter (NOM) in (B)GAC filters. The removal of dissolved organic carbon (DOC), assimilable organic carbon (AOC) and oxygen and the production of carbon dioxide were taken as indicators for NOM biodegradation. Ozonation stimulated DOC and AOC removal in the BGAC filters, but had no significant effect on oxygen consumption or carbon dioxide production. The temperature had no significant effect on DOC and AOC removal, while it had a positive effect on oxygen consumption and carbon dioxide production. Multivariate linear regression was used to quantify these relationships. In summer, the ratio between oxygen consumption and DOC removal was approximately 2 times the theoretical maximum of 2.6 g O2 g C−1 and the ratio between carbon dioxide production and DOC removal was approximately 1.5 times the theoretical maximum of 3.7 g CO2 g C−1 . The production and loss of biomass, the degassing of (B)GAC filters, the decrease in the NOM reduction degree and the temperature effects on NOM adsorption could only partly explain these excesses and the non-correlation between DOC and AOC removal and oxygen consumption and carbon dioxide production. It was demonstrated that bioregeneration of NOM could explain the excesses and the non-correlation. Therefore, it was likely that bioregeneration of NOM did occur in the (B)GAC pilot filters.
1
Introduction
The main reasons to use activated carbon (AC) in drinking water treatment are for the removal of organic micropollutants, for the removal of precursors for disinfection byproducts and for the removal of organic compounds causing color, taste and odor. Granular activated carbon (GAC) filtration is often preceded by a pre-oxidation step such as ozonation. Pre-oxidation is used for disinfection, oxidation of micro-pollutants and the improvement of color, taste and odor (Kruithof and Maschelein, 1999). Another important effect of pre-oxidation is that it increases the biodegradability of natural organic matter (NOM) (Carlson and Amy, 1997; Hammes et al., 2006; Rietveld et al., 2008; Siddiqui et al., 1997; van der Kooij et al., 1989; Yavich et al., 2004).
Correspondence to: L. T. J. van der Aa (
[email protected])
This enhances the growth of biomass in subsequent treatment steps and results in biological granular activated carbon (BGAC) filtration, also known as biological activated carbon filtration (Graveland, 1994; Jekel, 1979; Sontheimer et al., 1988). In BGAC filters, adsorption and biodegradation of NOM occur simultaneously. Biomass grows on the external surface of the AC grains and in the macro-pores. Micropores are too small for bacteria to enter (Labouyrie et al., 1997; Walker and Weatherley, 1998). Adsorption of NOM seriously hinders the adsorption of organic micro-pollutants due to pore blocking, competition and pre-loading (Carter et al., 1992; Carter and Weber, 1994; Knappe et al., 1997). When some of the NOM is biodegraded, adsorption of organic micro-pollutants is less hindered. As a result BGAC filtration is found to be more effective than GAC filtration for the removal of NOM (Graveland, 1994; Sontheimer et al., 1988), atrazine (Orlandini, 1999), micro-cystines (Wang et al., 2007) and other organic micro-pollutants (van der Aa, 2011). If the biodegradable NOM, produced by the
Published by Copernicus Publications on behalf of the Delft University of Technology.
26
L. T. J. van der Aa et al.: Effects of ozonation and temperature on the biodegradation of NOM in BGAC filters
pre-oxidation, is not sufficiently removed in subsequent treatment steps, this will have a negative impact on the biostability of the treated water. In the Netherlands, drinking water is often distributed without any residual disinfectant. Therefore, much attention is given to biofilm formation and regrowth in the distribution system (Escobar et al., 2001; Servais et al., 2004; van der Kooij, 1992). In BGAC filters, biomass has a large influence on the removal of biodegradable NOM and also, therefore, on biostability. NOM consists of a mixture of compounds (Leenheer and Crou´e, 2003). Heterotrophic bacteria take up some of these organic substances to build up cell material (assimilation) and to oxidize it to generate energy for growth and maintenance (dissimilation). During the biodegradation of NOM, heterotrophic bacteria consume oxygen and produce carbon dioxide and water (van der Kooij et al., 1982b). Aerobic biodegradation can be assessed by measuring oxygen consumption (Urfer and Huck, 2001) and carbon dioxide production. Some of the NOM compounds are biodegraded easily, while others are hardly biodegraded at all. In natural waters used for drinking water production, NOM is usually not easily biodegradable because bacteria already have consumed the easily biodegradable part. Pre-oxidation increases the biodegradability of NOM, indicated by increased concentrations of biodegradable dissolved organic carbon (BDOC), easily assimilable organic carbon (AOC) and organic acids, such as oxalate, formiate and acetate (Carlson and Amy, 1997; Hammes et al., 2006; Siddiqui et al., 1997; van der Kooij et al., 1989; Yavich et al., 2004). AOC is typically less than 10% of the BDOC in a water sample (Hammes et al., 2006; van der Kooij et al., 1982a, 1989). It is assumed that in drinking water the carbon source is usually the limiting factor for biodegradation by heterotrophic bacteria. However, in some cases also phosphate limitation was reported (Juhna and Rubulis, 2004). Biodegradation in (B)GAC filters increases with increased water temperature and with empty bed contact time (EBCT). Exhausted (B)GAC filters typically remove 10% to 35% of the NOM from the influent (Graham, 1999; Sontheimer et al., 1988). However, extreme removal ratios were reported from practically no dissolved organic carbon (DOC) removal (Juhna and Rubulis, 2004) to 65% removal (Jekel, 1979). Nowadays, many drinking water treatment plants (DWTPs) have installed (B)GAC filters. Because influent water quality and operations vary, the need for dynamic models for optimization of operational conditions has increased (van der Helm et al., 2008; Bosklopper et al., 2004). Because biodegradation of NOM is a key process in BGAC filtration, it should be incorporated in such models. The objective of this study was to quantify the effects of ozonation and water temperature on the biodegradation of NOM in (B)GAC filters. Because reported biodegradation in (B)GAC filters varies a lot, this study was conducted specifically for the Weesperkarspel pilot plant. One GAC and three BGAC pilot filters were operated to treat surface Drink. Water Eng. Sci., 4, 25–35, 2011
water. After approximately half a year of operation, the (B)GAC filters were assumed not to adsorb NOM any more. The removal of DOC, AOC and oxygen and the production of carbon dioxide were taken as indicators for NOM biodegradation. An additional objective was to determine the correlation between these indicators. 2 2.1
Materials and methods Weesperkarspel pilot plant: surface water
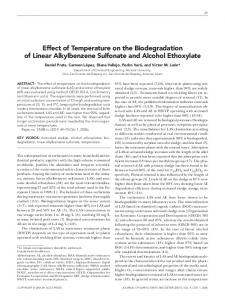
At Loenen – Weesperkarspel DWTP of Waternet, the water cycle company of Amsterdam and surrounding areas, the raw water originates from seepage water from the Bethune polder, with a high concentration of humic substances (Baghoth et al., 2008). The DOC concentration varies between 8 and 10 g C m−3 and the water temperature between 3 and 21 ◦ C. This water is pre-treated in the full-scale plant with coagulation, sedimentation, a reservoir with an average residence time of 100 days and rapid sand filtration. The pilot plant consisted of three ozone bubble columns plus contact chambers, followed by four identical gravity filters operated in down-flow mode. The influent waters of filters W-GAC8, W-BGAC5, W-BGAC6 and W-BGAC7 received net ozone doses of 0, 0.5, 1.5 and 2.5 g O3 m−3 , respectively. The filter medium in the (B)GAC filters was Norit GAC830, with a density of 450 × 103 g AC m−3 . The flow rates were kept constant at 0.88 × 10⁻³ m s−1 and the EBCTs were 40 min. Figure 1 and Table 1 provide an overview of the pilot plant and its characteristics. During operation, the (B)GAC filters were backwashed with air and water every 4 to 20 days, depending on filter bed resistance. The columns were monitored twice per month on influent, effluent and over-the-bed height. The measured parameters were DOC, extinction of ultraviolet light at a wavelength of 254 nm, AOC, pH, oxygen and temperature. 2.2
Analytical methods
Ozone was analyzed according to the diethyl-pphenylenediamine method (Gilbert, 1981). AOC was measured in duplicate, applying the simultaneous incubation of strains P17 and NOX (van der Kooij et al., 1982b). For measurements of adenosine tri-phosphate (ATP) on AC, the method described by Magic-Knezev and van der Kooij (2004) was used. Other water quality parameters were determined according to standard procedures (Standard Methods, 1998). Carbon dioxide was not analyzed, but calculated from the carbonic equilibrium using pH, conductivity, temperature and bicarbonate concentration (van Schagen et al., 2008).
www.drink-water-eng-sci.net/4/25/2011/
L. T. J. van der Aa et al.: Effects of ozonation and temperature on the biodegradation of NOM in BGAC filters
27
Table 1. Characteristics and influent water qualities pilot plant Weesperkarpsel.
Column
W-GAC8
W-BGAC5
W-BGAC6
W-BGAC7
Column diameter [m] Bed height [m] Carbon type [–] Operation time [s] Flow [m3 s−1 ] Surface load [m s−1 ] EBCT [s]
0.25 2.10 GAC830 586·24·3600 4.3 × 10⁻⁵ 8.7 × 10⁻⁴ 40·60
0.25 2.10 GAC830 600·24·3600 4.3 × 10⁻⁵ 8.7 × 10⁻⁴ 40·60
0.25 2.10 GAC830 559·24·3600 4.3 × 10⁻⁵ 8.7 × 10⁻⁴ 40·60
0.25 2.10 GAC830 586·24·3600 4.3 × 10⁻⁵ 8.8 × 10⁻⁴ 40·60
Net ozone dose [g O3 m−3 ]
–
0.5
1.5
2.5
Temp [◦ C] pH [–] DOC [g C m−3 ] UV254 [m−1 ] Oxygen [g O2 m−3 ] Carbon dioxide [g CO2 m−3 ] AOC [10−3 g acetate-C m−3 ]
12.8 (3.0–20.6) 7.7 (7.3–7.9) 6.0 (5.0–6.9) 14.4 (11.7–17.8) 10.0 (7.9–12.9) 8.1 (4.6–10.7) 11.5 (5.7–32)
12.2 (3.6–20.6) 7.7 (7.3–7.8) 6.0 (5.2–7.6) 13.5 (11.6–16.9) 11.0 (8.3–14.2) 7.7 (0.1–15.7) 35.0 (16–99)
11.6 (3.8–20.6) 7.7 (7.1–7.8) 5.9 (4.9–7.5) 10.8 (5.4–14.4) 11.1 (7.4–13.7) 8.6 (5.8–39.7) 85.0 (40–199)
11.6 (3.8–20.6) 7.7 (7.6–7.8) 5.8 (4.9–6.7) 8.5 (6.4–10.4) 11.6 (9.5–14.3) 7.2 (5.5–10.1) 114.1 (42–265)
Notes water quality parameters: table values are average concentrations; values between parentheses are minimum and maximum concentrations; carbon dioxide concentrations calculated according (van Schagen et al., 2008).
Bethunepolder
Amsterdam-Rhine-canal
Coagulation-flocculation
Sedimentation
Reservoir t=100 days
Rapid sand f iltration
Ozonation
Ozonation
datasets. The procedure “robust” was used to assign lower weights to outliers. The input variables were considered to correlate significantly with the target variables, when the pvalue was smaller than 0.05. Multivariate linear regressions (MLRs) were used to determine which input variable(s) from a group of input variables influenced the target variable. The Matlab® procedure “robust” (Mathworks, 2007) was used to assign lower weights to outliers. For each target variable, MLRs were made for all possible combinations of the input variables. MLRs that included one or more input variables with no significant correlation to the target variable (p-value larger than 0.05) were rejected. The MLRs with the lowest root mean sigma error (RMSE) were considered the best MLRs.
Ozonation
3 W-BGAC5
W-BGAC6
W-BGAC7
W-GAC8
Figure 1. Flow scheme at the Weesperkarspel pilot plant.
2.3
Results and discussion
Figure 2 shows the concentrations of DOC, AOC and oxygen and the pH of the (B)GAC filters at the Weesperkarspel pilot plant at different ozone doses. The minimum, maximum and average influent concentrations are included in Table 1.
Statistical methods
The Matlab® procedure “anova1” (Mathworks, 2007) was used to study differences between datasets. The datasets were considered significantly different from each other, when the p-value was smaller than 0.05, which means that the chance that the different datasets did not originate from the same distribution function is more than 95%. The Matlab® procedure “robustfit” (Mathworks, 2007) was used to make linear regressions between different www.drink-water-eng-sci.net/4/25/2011/
3.1
Effects of ozonation and water temperature on water quality
Based on the water quality after ozonation, MLRs were made for the following target parameters: DOC, AOC, oxygen, carbon dioxide and pH (see Table 2). The following input parameters were used: ozone dose, water temperature, DOC, AOC, oxygen, carbon dioxide and pH, all from the raw water. All target parameters after ozonation correlated significantly Drink. Water Eng. Sci., 4, 25–35, 2011
28
L. T. J. van der Aa et al.: Effects of ozonation and temperature on the biodegradation of NOM in BGAC filters
Table 2. MLRs water quality parameters after ozonation.
MLR – Robust Input variables: O3 , temp, [DOC]raw , [AOC]raw , [O2 ]raw , [CO2 ]raw [DOC]inf = 0.51 + 0.92 [DOC]raw − 0.070 O3 [AOC]inf = 1.0 × 10
−3
+ 1.0 [AOC]raw + 35 × 10
−3
O3
[O2 ]inf = 0.46 + 0.98 [O2 ]raw + 0.57 O3
Notes:
raw
0.86
0.49 0.35
indicates raw water (i.e., water before ozonation) and inf indicates (B)GAC influent (i.e., water after ozonation).
30 20
Temperature [°C]
DOC [g C· m-3]
0
100
200
300
400
500
0
600 (b)
2
1
10
30 20
Temperature [°C]
10
10 0
0
100
200
300
400
500
0
600
12 10 8 6
30
4
20
2
Temperature [°C]
(c)
14
10
0
0 0
100
200
300
400
500
600 (d)
8.4 8.2 8 7.8 7.6
30
7.4
20
7.2
Temperature [°C]
AOC [·10-3 g acetate-C·m-3]
10 × 10−3
0.013
10
O2 [g O2· m-3]
0.62 0.15
2
pH [-]
0.14
0.48
4
7
0.60
[CO2 ]inf = 0.44 + 0.94 [CO2 ]raw − 0.32 O3
6
10
RMSE
pHinf = 0.17 + 0.98 pHraw + 0.014 O3
(a)
0
R2
10 0
W-GAC8: 0 g O3·m-3
100
200 W-BGAC5: 0.5 g O3·m-3
300
Time [days]
400
W-BGAC6: 1.5 g O3·m-3
500
600
0
W-BGAC7: 2.5 g O3·m-3
influent
influent
influent
influent
EBCT 40 min
EBCT 40 min
EBCT 40 min
EBCT 40 min
Temperature
DOC (a), AOC (b), oxygen (c) and pH (d) in Weesperkarpsel pilot (B)GAC filters. Figure 2.
with their value before ozonation. The linear coefficients were all between 0.92 and 1.0. All target parameters after ozonation also correlated significantly with the ozone dose, as seen in Table 2. The DOC concentration after ozonation mainly depended on the DOC concentration in the raw water and decreased slightly with increasing ozone doses. At the highest ozone dose of 2.5 g O3 m−3 , resulting in an average ozone/DOC ratio of 0.43 g O3 g C−1 , the average DOC Drink. Water Eng. Sci., 4, 25–35, 2011
removal was 0.17 g C m−3 (3%), as seen in Table 1. Other studies reported NOM removal of 3% to 16%, depending on the ozone dose (Sontheimer et al., 1988). Apparently this DOC was completely oxidized to carbon dioxide. However, the carbon dioxide concentration did not increase with increasing ozone doses. On the contrary, it decreased with increasing ozone doses, although the correlation was weak (see Table 2). The ozone was dosed via a bubble column, using an ozone-air mixture. It was assumed that the produced carbon dioxide was stripped in the bubble column. No data about carbon dioxide concentrations in the off-gas were available to confirm this assumption. The oxygen concentration increased with the ozone dose. Apparently, additional oxygen dissolved from the gas mixture that was dosed in the bubble columns. Also, some of the ozone did not react with substances in the water and was converted to oxygen. The AOC concentration increased with the ozone dose. The increase in AOC of 35 × 10−3 g C g O−1 3 was within the broad range of values between 20 × 10−3 and 250 × 10−3 g C g O−1 3 found by other researchers (Hammes et al., 2006; van der Helm et al., 2007; van der Kooij et al., 1989). There was no significant correlation between AOC concentration after ozonation and the DOC concentrations in the raw water. Other studies have shown that the formation of AOC and BDOC during ozonation does increase with the concentration of NOM in the raw water (Carlson and Amy, 1997; van der Helm, 2007). The limited variation in the DOC concentration in the raw water in this study could be a reason for not finding a significant correlation. It is know that the ozone decay rate increases with temperature. Therefore, at a constant ozone dose, the concentration multiplied by the contact time (CT) for ozone decreases with increasing temperatures. Neither the DOC nor the AOC concentration after ozonation depended on the water temperature. Apparently both concentrations depended more on the total amount of ozone dosed than on the CT-value. Van der Helm et al. (2007) also found that the reaction of ozone with NOM was linear with the ozone dose, and not with the CT-value. Hammes et al. (2006), on the other hand, found that the formation of AOC did increase with CT.
www.drink-water-eng-sci.net/4/25/2011/
L. T. J. van der Aa et al.: Effects of ozonation and temperature on the biodegradation of NOM in BGAC filters
29
Table 3. Biological conversions in (B)GAC pilot filters.
Column Net ozone dose [g O3 m−3 ]
W-GAC8
W-BGAC5
W-BGAC6
W-BGAC7
0
0.5
1.5
2.5
−3
∆DOC [g C m ]
−1.2 (−20%)
−1.3 (−21%)
−1.5 (−25%)
−1.8 (−30%)
∆AOC [10−3 g acetate-C m−3 ]
+2.7 (+21%)
−12.3 (−35%)
−68.3 (−73%)
−85.4 (−68%)
∆O2 [g O2 m−3 ]
−3.3 (−54%)
−3.4 (−55%)
−3.6 (−59%)
−3.5 (−59%)
∆CO2 [g CO2 m−3 ]
+2.6 (+33%)
+3.4 (+44%)
+0.9 (+10%)
+2.7 (+39%)
3.2
2.8
2.3
1.9
−2.4
−2.7
−0.4
−1.4
∆O2 ∆DOC−1 [g O2 g C−1 ] ∆CO2 ∆DOC
−1
−1
[g CO2 g C ]
Notes: table values are the average difference in (B)GAC influent and effluent concentrations Ceff −Cinf from day 194 to day 559; percentage values are the average relative removal percentages (Ceff −Cinf )/Cinf from day 194 to day 559.
Figure 2 shows that in all (B)GAC filters initial NOM removal was high; at the first day of operation 92% to 96% of the DOC and 90% to 100% of the AOC was removed. After 40 days of operation, both DOC and AOC concentrations in the effluents increased rapidly according to a typical S-shaped adsorption breakthrough curve. However, complete breakthrough was not reached. Instead, after approximately half a year of operation, DOC and AOC removal in all (B)GAC filters reached more or less a steady-state. It was assumed that the main NOM removal process in this “steadystate” situation was biodegradation. It was also assumed that biodegradation of NOM was the only biodegradation process in the filters. From experiences in the full-scale plant, it was known that there was no microbial oxidation of inorganic compounds because ammonium, nitrite and iron were absent due to pre-treatment by rapid sand filtration (see Fig. 1). To take seasonal effects into account, the biological removal of DOC and AOC, the consumption of oxygen, and the production of carbon dioxide in the (B)GAC filters were analyzed for a period of one year, during steady-state conditions from day 194 to day 559 (see Table 3). During this selected period, the average DOC removal was significantly greater at higher ozone doses, 1.2 g C m−3 (20%) at 0 g O3 m−3 and 1.8 g C m−3 (30%) at 2.5 g O3 m−3 , at almost identical DOC influent concentrations. Also, the average AOC removal was significantly higher at higher ozone doses. Note that the AOC influent concentrations were increased due to ozonation. However, in none of the filters receiving ozonated water were AOC concentrations reduced to the concentrations before ozonation (see Table 1). The BGAC filters removed up to 70% of the produced AOC. The GAC effluent on average contained more AOC than the influent, as seen in Table 3. Apparently, the GAC filter produced AOC. Therefore, both GAC filtration and ozonation followed by BGAC filtration were expected to have a negative effect on biostability. www.drink-water-eng-sci.net/4/25/2011/
100
7 (a)
0 -50 -100 -150 -200 -3
(b)
6
50 dCO2 [g CO2· m-3]
Effects of ozonation and water temperature on biodegradation of NOM in (B)GAC filters
dAOC [10-3 g acetate-C·m-3]
3.2
5 4 3 2 1 0
-2.5
-2
-1.5
-1
dDOC [g C·m-3]
-0.5
0
-1 -8
-7
-6
-5
-4
-3
-2
-1
0
dO2 [g O2· m-3]
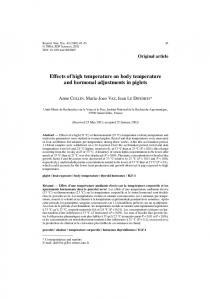
Figure 3. Linear regressions plus 95% confidence intervals for data
from all 4 (B)GAC filters: ∆AOC = 64 × 10−3 ∆DOC + 60 × 10−3 (R2 = 0.36) (a) and ∆CO2 = −0.79 ∆O2 + 0.19 (R2 = 0.13) (b).
Neither average oxygen consumption nor the average carbon dioxide production depended on the ozone dose. The significant correlations between the biological removal of DOC, AOC and oxygen, and the production of carbon dioxide were ∆AOC = 64 × 10−3 ∆DOC + 60 × 10−3 (R2 = 0.36) and ∆CO2 = −0.79 ∆O2 + 0.19 (R2 = 0.13) (see Fig. 3). MLRs were made for the biological removal of DOC and AOC, the consumption of oxygen and the production of carbon dioxide in the (B)GAC filters, again for the selected period of one year. Different sets of input variables were used: (a) water quality after ozonation (the ozone dose was not used), (b) water quality after ozonation plus the ozone dose, (c) raw water quality plus the ozone dose, and (d) water temperature plus the ozone dose. When only the water quality variables after ozonation were used as input parameters (set a), 3 MLRs showed negative values for R2 . This indicates that this set was severely influenced by outliers. Therefore, this set was excluded from further examination. Adding the ozone dose as an input variable (set b) reduced this problem and was therefore useful for predicting biodegradation in (B)GAC filters. Using the water quality variables from the raw water instead of those from the water after ozonation (set c) increased the RMSEs, meaning that the quality of the MLRs decreased. This is the result of additional noise in the input variables caused by the ozonation. The simplest Drink. Water Eng. Sci., 4, 25–35, 2011
L. T. J. van der Aa et al.: Effects of ozonation and temperature on the biodegradation of NOM in BGAC filters (a)
dDOC [g C·m-3]
0
dAOCtotal [10-3 g C·m-3]
30
-1 -2 -3 0
5
10
15
20
Temperature [°C]
2
25
0
0.5
1.5 1 Ozone dose [g O3· m-3]
(b)
0 -50 -100 -150 -200 0
2.5
5
10
15
20
Temperature [°C]
(c)
25
0.5
0
2.5 2 1.5 1 -3 Ozone dose [g O3·m ]
(d)
0 dCO2 [g CO2· m-3]
dO2 [g O2· m-3]
8 -2 -4 -6 -8 0
5
2.5
10
15
20
25
0
Temperature [°C]
6 4 2
0 2.5
2 1.5 2 1.5 0.5 1 1 -3 Ozone dose [g O3· m ] Ozone dose [g O · m-3] 3
15
0.5
0
20
25
10 5 0 Temperature [°C]
multiple lineair regression model W-GAC8: 0 g O3· m-3 EBCT 40 min - inf
W-BGAC5: 0.5 g O3·m-3 EBCT 40 min - inf
W-BGAC6: 1.5 g O3·m-3 EBCT 40 min - inf
W-BGAC7: 2.5 g O3· m-3 EBCT 40 min - inf
Figure 4. MLRs for biological conversions of DOC (a), AOC (b), oxygen (c) and carbon dioxide (d) as a function of the ozone dose and
temperature from day 194 to 559 (set d).
set (d) only used the temperature and the ozone dose as input. Figure 4 illustrates the results of the MLRs for set (d). The results of the MLRs for sets b, c and d are shown in Table 4. Figure 3, Table 4 and Fig. 4 illustrate that the removals of DOC and AOC correlated with each other and were greater at higher ozone doses. They were not significantly influenced by the water temperature. Oxygen consumption and carbon dioxide production correlated with each other and increased with temperatures. They were not significantly influenced by the ozone dose. The removal of DOC and AOC did not correlate significantly with the consumption of oxygen and the production of carbon dioxide. It is known that different substrates require different amounts of oxygen for complete oxidation. For example, for complete oxidation of glucose (C6 H12 O6 ) 2.7 g O2 g C−1 , for cellulose (C6 H10 O5 )n 2.7 g O2 g C−1 and for ethanol (CH3 OH) 4.0 g O2 g C−1 is needed. Perdue and Ritchie (2004) reviewed different studies on NOM and collected the compositions of NOM in 57 fresh waters. The average NOM of these 57 samples had a C:H:O ratio of 400:660:645. For complete oxidation of this average NOM 2.6 g O2 g C−1 is needed. The oxygen consumption of all the NOM samples always was between 2.1 g O2 g C−1 and 3.4 g O2 g C−1 . Complete oxidation of NOM always results in a carbon dioxide production of 3.7 g CO2 g C−1 . Drink. Water Eng. Sci., 4, 25–35, 2011
Figure 5 shows that in the pilot (B)GAC filters both the ratio between oxygen consumption and DOC removal and the ratio between carbon dioxide production and DOC removal were higher at higher temperatures. In summer more oxygen was consumed and more carbon dioxide was produced than was needed for complete NOM oxidation (approximately 200% and 150% respectively). This was also observed by Jekel (1979) and Sontheimer et al. (1988). It was assumed that in the pilot filters the type of NOM remained fairly constant during the year and that always 2.6 g O2 g C−1 was needed for complete oxidation. When biodegradation of NOM from the water phase is assumed to be the only relevant process for run times longer than 194 days, the removal of DOC and AOC, the consumption of oxygen and the production of carbon dioxide: (a) should correlate with each other, (b) should all be higher at higher temperatures, (c) should all be higher at higher ozone doses, and (d) should not have oxygen consumption exceeding 2.6 g O2 g C−1 and should not have carbon dioxide production exceeding 3.7 g CO2 g C−1 . None of these requirements were completely fulfilled. It was suggested that, besides biodegradation of NOM from the water phase, the following mechanisms could explain the observations from the pilot plant: a decrease in the NOM reduction degree (see Uhl, 2000) by ozonation, the degassing of (B)GAC filters, www.drink-water-eng-sci.net/4/25/2011/
L. T. J. van der Aa et al.: Effects of ozonation and temperature on the biodegradation of NOM in BGAC filters
31
Table 4. MLRs biological conversions in (B)GAC pilot filter.
MLR – Robust – set b Input variables: O3 , temp, [DOC]inf , [AOC]inf , [O2 ]inf , [CO2 ]inf
R2
RMSE
0.53
0.22
0.96
6.3 × 10⁻³
∆[O2 ] = 173 − 0.57 temp − 0.27 [O2 ]inf − 20 pHinf − 1.5 [CO2 ]inf
−7.1
0.50
∆[CO2 ] = −5.4 + 0.36 temp + 0.54 [O2 ]inf − 0.18 [CO2 ]inf − 0.57 O3
0.46
0.94
∆[DOC] = 1.2 − 0.39 [DOC]inf − 0.26O3 ∆[AOC] = 13 × 10
−3
−3
− 0.90 [AOC]inf − 4.0 × 10
O3
MLR – Robust – set c Input parameters: O3 , temp, [DOC]raw , [AOC]raw , [O2 ]raw , [CO2 ]raw ∆[DOC] = −1.2 − 0.23 O3
0.34
0.25
∆[AOC] = 179 × 10−3 − 29 × 10−3 [DOC]raw − 34 × 10−3 O3
0.58
15 × 10−3
∆[O2 ] = 7.3 − 0.38 temp − 0.48 [O2 ]raw − 0.13 [CO2 ]raw
0.88
0.53
∆[CO2 ] = −0.58 + 0.27 temp
0.20
1.0
0.34
0.25
0.49
16 × 10−3
∆[O2 ] = 0.20 − 0.27 temp
0.73
0.64
∆[CO2 ] = −0.58 + 0.27 temp
0.20
1.0
MLR – Robust – set d Input parameters: O3 , temp ∆[DOC] = −1.2 − 0.23 O3 ∆[AOC] = 0.92 × 10
−3
Notes: raw indicates raw water (i.e., water before ozonation); concentrations Ceff −Cinf from day 194 to day 559.
−3
− 29 × 10
inf
O3
indicates (B)GAC influent (i.e., water after ozonation); ∆ indicates the difference in (B)GAC influent and effluent
biomass production and losses, the temperature effects on NOM adsorption and bioregeneration. These hypotheses are discussed in the following sections.
fore, the decrease of the NOM reduction degree by ozonation could not (completely) explain the observations from the pilot plant.
3.2.1
3.2.2
Decrease of the NOM reduction degree by ozonation
The average ratio between oxygen consumption and DOC removal was lower at higher ozone doses, 3.2 g O2 g C−1 at 0 g O3 m−3 and 1.9 g O2 g C−1 at 2.5 g O3 m−3 (see Table 3). However, the significance was relatively low (p-value 0.06). The MLRs from sets d for DOC and oxygen consumption, and for DOC and carbon dioxide production (see Table 4) were combined into equations for the ratio between oxygen consumption and DOC removal and for the ratio between carbon dioxide production and DOC removal, as seen in Fig. 5. Both ratios were higher at higher temperatures and lower at higher ozone doses. Due to the reaction of NOM and ozone, more oxygen atoms are incorporated in the NOM molecules, resulting in a decrease in the reduction degree of the NOM. For biodegradation of NOM with a lower reduction degree, less oxygen is consumed (Uhl, 2000). From his data, Uhl derived that, due to this NOM oxidation, the reduction degree of NOM reduced by 0.26 to 0.48 in four different (B)GAC filters, corresponding to an oxygen uptake of 0.13 to 0.24 g O2 g C−1 . This is less than the observed difference of 3.2–1.9 = 1.3 g O2 g C−1 that was found in this study. Therewww.drink-water-eng-sci.net/4/25/2011/
Degassing of (B)GAC filters
The average ratio between carbon dioxide production and DOC removal was between 0.4 and 2.7 for all (B)GAC filters and did not depend on the ozone dose (see Table 3). As 3.7 is the ratio between the molecular mass of carbon diox−1 ide (44 g mol CO−1 2 ) and carbon (12 g mol C ), this means that not all removed NOM carbon was found as carbon dioxide in the effluent. For example, in filter W-GAC8 only 2.4 · 12/44 = 65% of the biologically removed NOM carbon was found as carbon dioxide in the effluent. For filters WBGAC5, W-BGAC6 and W-BGAC7 this was 11%, 38% and 74%, respectively. Ozone was dosed at a water depth of 5 m, while the supernatant water in the (B)GAC filters was at atmospheric pressure. The supernatant water was supersaturated with gas. In summer, gas bubbles frequently were observed in the (B)GAC filters. The escaping gas contained relatively high amounts of carbon dioxide (2%). No information on the amount of gas escaping was available to assess its effect on the carbon balance. However, the gas was escaping at atmospheric pressure, so the density was approximately 1.2 × 10³ g m−3 . The concentration of carbon dioxide as carbon was approximately 1.2 × 10−3 · 2% · 12/44 = 6.5 g C m−3 . Drink. Water Eng. Sci., 4, 25–35, 2011
32
L. T. J. van der Aa et al.: Effects of ozonation and temperature on the biodegradation of NOM in BGAC filters
40
6
30
4
20
2
10
0
0
100
200
300
Time [days]
400
500
Temperature [°C]
dO2·dDOC-1 [g O2·g C-1]
(a) 8
0
600
combined MLRs set d
6
d[DOC]/d[O2]=(-1.2-0.23· O3)/(0.20-0.27·temp)
4 2
-dCO2·dDOC-1 [g C·g C-1]
0
0
5
15 20 Temperature [°C]
25
30 (c)
30
4
20
2
10
0
0
-2
-10 0
-dCO2·dDOC-1 [g C·g C-1]
10
6
Temperature [°C]
dO2· dDOC-1 [g O2·g C-1]
(b) 8
100
200
300
Time [days]
400
500
600 (d)
6 4 2 0
combined MLRs set d d[DOC]/d[CO2]=(-1.2-0.23·O3)/(-0.58+0.27·temp)
-2 0
5 -3
W-GAC8: 0 g O3·m
10
15 20 Temperature [°C] -3
W-BGAC5: 0.5 g O3·m
25
30
-3
W-BGAC7: 2.5 g O3·m-3
W-BGAC6: 1.5 g O3·m
EBCT 40 min - inf
EBCT 40 min - inf
EBCT 40 min - inf
EBCT 40 min - inf
combined MLRs set d
combined MLRs set d
combined MLRs set d
combined MLRs set d
Temperature
Figure 5. Oxygen consumption to DOC removal ratio (a), oxygen consumption to DOC removal ratio as function of temperature from day 194 to 559 (b), carbon dioxide production to DOC removal ratio (c) and carbon dioxide production to DOC removal ratio as function of temperature from day 194 to day 559 (d).
For example, for filter W-GAC8 it was demonstrated that 35% of the biologically removed NOM carbon was not found as carbon dioxide in the effluent. If this was caused by degassing of the filters, 35% · 1.2/6.5 = 0.065 m3 of gas per m3 of treated water should have escaped from the filters. At a surface loading of 8.7 × 10⁻⁴ m s−1 this corresponded to 4.9 m3 gas per m2 filter bed per day, which is not realistic. Therefore, the degassing of the (B)GAC filters could not (completely) explain the observations from the pilot plant. 3.2.3
Biomass production and losses
A part of the biologically removed NOM carbon is converted into biomass. For aquatic bacteria the bacterial growth efficiency, or yield, varies from less than 0.05 to 0.6 g C g C−1 , depending on type and concentration of the substrate, type of bacteria, growth phase of bacteria, temperature and other water quality parameters (del Giorgio and Cole, 1998). For bacteria growing at a yield of 0.05 g C g C−1 , both the oxygen Drink. Water Eng. Sci., 4, 25–35, 2011
consumption and the carbon dioxide production per amount of biodegraded NOM is about 2 times higher than for bacteria growing at a yield of 0.6 g C g C−1 . In the pilot (B)GAC filters these figures were more than 5 times higher in summer than in winter (see Fig. 5). In theory, this would only be possible at a maximum yield (in winter) of 0.8 g C g C−1 or more, which is not realistic. Variable yields also cannot explain why in summer more than 2.6 g O2 g C−1 was consumed and more than 3.7 g CO2 g C−1 was produced. The produced biomass can either accumulate in the filter bed, or leave the filter with the effluent or with the backwash water. Besides, it is possible that the biomass dies, disintegrates (lysis) and serves as a carbon source for other microorganisms. Furthermore, bacteria in a starvation or limitation phase can utilize internally stored carbon. In this study, the concentrations of ATP, as a measure of active biomass, were determined in the filter influents, effluents and backwash water (data not shown). Assuming a biomass carbon/ATP ratio of 250 g C g ATP−1 (Magic-Knezev and van der Kooij, 2004), the amounts of biomass, expressed in carbon (biomass carbon), in the influents and effluents were less than 1% of the NOM that was biologically removed in the (B)GAC filters. During a backwash, 13% of the biomass was removed from pilot filter W-BGAC6 (1 observation). At a maximum frequency of 1 backwash per 4 days, the biomass carbon removed during backwashing was approximately 1% of the NOM that was biologically removed in the filter during 4 days. The observed changes in biomass activity were always between +4 × 10⁻⁹ g ATP g AC−1 day−1 (net biomass growth) and −4 × 10⁻⁹ g ATP g AC−1 day−1 (net biomass removal), which corresponded to less than 1% of the NOM that was biologically removed. Therefore, biomass growth, accumulation in the filter bed, lysis and the loss of carbon with biomass in the effluent and backwash water could not explain the discrepancy between biological NOM removal and carbon dioxide production in the BGAC filters. 3.2.4
Temperature effects on NOM adsorption
In theory, adsorption should be less at higher temperatures (Schreiber et al., 2007). This was shown experimentally for some individual compounds, e.g., phenol and ocresol (Abuzaid and Nakhla, 1997). However, experiments showed more NOM adsorption at higher water temperatures (Schreiber et al., 2005 and 2007; Summers and Roberts, 1988). In this study, the adsorption isotherms were only determined at 12 ◦ C. Therefore, the effect of temperature on the adsorption isotherm could not be assessed. It is possible that at higher temperatures adsorption decreases, or even completely stops, and simultaneously biodegradation of NOM increases. Because of the increased biodegradation, the oxygen consumption and carbon dioxide production typically increases in summer, while the DOC and AOC removal typically remains fairly constant. The phenomenon that NOM adsorbs in winter and is biodegraded in summer www.drink-water-eng-sci.net/4/25/2011/
L. T. J. van der Aa et al.: Effects of ozonation and temperature on the biodegradation of NOM in BGAC filters
cannot explain why, in summer, the oxygen consumption exceeded 2.6 g O2 g C−1 and the carbon dioxide production exceeded 3.7 g CO2 g C−1 . Temperature effects on NOM adsorption could only partly explain the discrepancy between DOC and AOC removal on one side and oxygen consumption and carbon dioxide production on the other. 3.2.5
Bioregeneration
Bioregeneration of AC is biodegradation of (previously) adsorbed NOM, which results in a decrease in the NOM loading on the AC (Sontheimer et al., 1988). Several authors described two possible mechanisms for bioregeneration. The first hypothesis is that biomass on the external AC surface takes up substrate. Therefore, the concentration of the substrate on the external AC surface becomes smaller than the internal equilibrium concentration. This causes diffusion of the substrate from the internal pores towards the external AC surface, where it is biodegraded. The concentration inside the pores decreases, which results in desorption. The AC is available for adsorption again: it has been bioregenerated. The second hypothesis is that the biomass releases extracellular enzymes that enter the meso-pores of the AC; micropores are believed to be too small for the exo-enzymes to enter. The exo-enzymes convert part of the adsorbed substrate into less adsorbable products. These products desorb and diffuse from the internal pores towards the external AC surface, where they are biodegraded. Again, the AC is bioregenerated. In both hypotheses, both desorption and biodegradation are conditions for bioregeneration (Aktas and C¸ec¸en, 2007; Klimenko et al., 2003; Walker and Weatherley, 1998). During bioregeneration, oxygen is consumed and carbon dioxide is produced. The NOM that is biodegraded originates from the adsorbed phase. An increase in oxygen consumption and carbon dioxide production is possible, without any effect on the measured DOC and AOC concentrations in the filter effluent. During complete oxidation of 1 g C 2.6 g oxygen is needed and 3.7 g carbon dioxide is produced. Assume that in winter, during a period of 6 months, 1.0 g C m−3 NOM adsorbed onto the AC and that 0.2 g C m−3 NOM was biodegraded. The oxygen consumption and the carbon dioxide production, per amount of NOM removed from the water phase, would have been 0.2 · 2.6/1.2 = 0.4 g O2 g C−1 and 0.2 · 3.7/1.2 = 0.6 g CO2 g C−1 . Assume that in summer, during a period of 6 months, no NOM adsorbed, that 1.2 g C m−3 NOM was biodegraded from the water phase and that all adsorbed NOM from the previous winter period was biodegraded. The oxygen consumption and the carbon dioxide production, per amount of NOM removed from the water phase, would have been (1.2+1)·2.6/1.2 = 4.8 g O2 g C−1 and (1.2+1)·3.7/1.2 = 6.8 g CO2 g C−1 . These figures correspond well to the measured results from the pilot experiment, as seen in Fig. 5. AC bioregeneration was reported for different specific compounds in (industrial) waste waters (Aktas and C¸ec¸en, www.drink-water-eng-sci.net/4/25/2011/
33
2007; Klimenko et al., 2003; Walker and Weatherley, 1998). Although no hard evidence was found, some researchers suggested that bioregeneration of NOM in drinking water is possible (Sontheimer et al., 1988). Both desorption and biodegradation of the compounds are conditional for bioregeneration. It is obvious that a part of the NOM in the pilot (B)GAC filters was biodegradable and adsorbable (Fig. 2 and Table 3). For batch experiments, desorption of 4% to 58% of previously adsorbed NOM was reported. The percentage of NOM desorption depended on the type of NOM and on the type of AC (Yapsakli et al., 2009), Therefore, in theory, the conditions for biodegradation and for desorption can be met. Because in summer the reported ratio between oxygen consumption and DOC removal exceeded 2.6 g O2 g C−1 and the ratio between carbon dioxide production and DOC removal exceeded 3.7 g CO2 g C−1 , it was likely that bioregeneration of NOM did occur in the (B)GAC pilot filters. 4
Conclusions
In this study the influence of ozonation on the biodegradation of NOM in (B)GAC filters was assessed in four pilot (B)GAC filters. To study a period with biodegradation as the main NOM removal process and to take seasonal effects into account, the filters were judged for a period of one year, from day 194 to day 559. The main effect of the ozonation was the increase in the AOC concentration in the (B)GAC influents by 35 × 10−3 g acetate-C g O−1 3 . Ozonation also resulted in limited decreases in the DOC and oxygen concentrations, and in limited increases in the pH and (calculated) carbon dioxide concentration. The BGAC filters receiving ozonated water removed up to 70% of the produced AOC. However, in none of the BGAC filters were AOC concentrations reduced to the concentration levels before ozonation. The GAC filter produced small amounts of AOC. Therefore, both GAC filtration and preoxidation followed by BGAC filtration were expected to have a negative effect on biostability. Ozonation also stimulated the removal of DOC in the (B)GAC filters. At the highest ozone dose of 2.5 g O3 m−3 , which resulted in an average ozone/DOC ratio of 0.43 g O3 g C−1 , the DOC removal was 30% versus 20% in the filter receiving non-ozonated water. The removals of DOC and AOC correlated with each other and were greater at higher ozone doses. They were not significantly influenced by the water temperature. Oxygen consumption and carbon dioxide production correlated with each other and were higher at higher temperatures. They were not significantly influenced by the ozone dose. The removal of DOC and AOC did not correlate significantly with the removal of oxygen and the production of carbon dioxide. This discrepancy indicated that, besides biodegradation, other processes were relevant for NOM removal in the filters. In summer, the ratio between oxygen consumption Drink. Water Eng. Sci., 4, 25–35, 2011
34
L. T. J. van der Aa et al.: Effects of ozonation and temperature on the biodegradation of NOM in BGAC filters
and DOC removal was approximately 2 times the theoretical maximum of 2.6 g O2 g C−1 and the ratio between carbon dioxide production and DOC removal was approximately 1.5 times the theoretical maximum of 3.7 g CO2 g C−1 . Theoretical calculations demonstrated that the production and losses of biomass, the degassing of (B)GAC filters, the decrease in the NOM reduction degree and the temperature effects on NOM adsorption could only partly explain these excesses and the discrepancy between DOC and AOC removal and oxygen consumption and carbon dioxide production. Bioregeneration of NOM could explain the excesses and the noncorrelation. Therefore, it was likely that bioregeneration of NOM did occur in the (B)GAC pilot filters. It is recommended that adsorption, desorption and biodegradation experiments be performed with labeled 14 Cglucose (Servais et al., 1994), or if possible with larger (both biodegradable and non-biodegradable) 14 C-NOM molecules. This will make it possible to determine the fate of NOM and to quantify relevant processes in BGAC filtration. Possibly, hard evidence for bioregeneration of NOM will be found. Acknowledgements. This research was conducted by Water-
net, Vitens, KWR, Norit, Delft University of Technology and Wageningen and Research. The research was part of the project BAKF/SCWR, which was co-funded by SenterNovem (currently Agentschap NL), agency of the Dutch Ministry of Economic Affairs. Edited by: B. Heijman
References Abuzaid, N. S. and Nakhla, G. F.: Modeling of the temperature variation effects on the polymerization reactions of phenolics on granular activated carbon, Sep. Sci. Technol., 32, 1255–1272, 1997. ¨ and C Aktas, O. ¸ ec¸en, F.: Bioregeneration of activated carbon: A review, Int. Biodeter. Biodegr., 59, 257–272, 2007. Baghoth, S. A., Maeng, S. K., Salinas Rodriguez, S. G., Ronteltap, M., Sharma, S., Kennedy, M., and Amy, G. L.: An urban water cycle perspective of natural organic matter (NOM): NOM in drinking water, wastewater effluent, storm water and seawater, Water Sci. Technol. Water Supply, 8, 701–707, 2008. Bosklopper, T. G. J., Rietveld, L. C., Babuska, R., Smaal, B., and Timmer, J.: Integrated operation of drinking water treatment plant at Amsterdam water supply, Water Sci. Technol. Water Supply, 4, 263–270, 2004. Carlson, K. and Amy, G.: The formation of filter-removable biodegradable organic matter during ozonation, Ozone Sci. Eng., 19, 179–199, 1997. Carter, M. C. and Weber Jr., W. J.: Modeling adsorption of TCE by activated carbon preloaded by background organic matter, Environ. Sci. Technol., 28, 614–623, 1994. Carter, M. C., Weber Jr., W. J., and Olmstead, K. P.: Effects of background dissolved organic matter on TCE adsorption by GAC, J. Am. Water Works Assn., 84, 81–91, 1992.
Drink. Water Eng. Sci., 4, 25–35, 2011
del Giorgio, P. A. and Cole, J. J.: Bacterial growth efficiency in natural aquatic systems, Annu. Rev. Ecol. Syst., 29, 503–541, 1998. Escobar, I. C., Randall, A. A., and Taylor, J. S.: Bacterial growth in distribution systems: effect of assimilable organic carbon and biodegradable dissolved organic carbon, Environ. Sci. Technol., 35, 3442–3447, 2001. Gilbert, E.: Photometrische Bestimmung niedriger Ozonkonzentrationen in Wasser mit Hilfe von Dia¨ethyl-p-phenylendiamin (DPD) (Photometric determination of low ozone concentrations in water using Diethyl-p-phenylenediamine (DPD)), GWF Wasser Abwasser, 122, 410–416, 1981. Graham, N. J. D.: Removal of humic substances by oxidation/biofiltration processes – a review, Water Sci. Technol., 40, 141–148, 1999. Graveland, A.: Application of biological activated carbon filtration at Amsterdam Water Supply, Water Supp., 14, 233–241, 1994. Hammes, F., Salhi, E., K¨oster, O., Kaiser, H.-P., Egli, T., and von Gunten, U.: Mechanistic and kinetic evaluation of organic disinfection by-product and assimilable organic carbon (AOC) formation during the ozonation of drinking water, Water Res., 40, 2275–2286, 2006. Jekel, M.: Experience with biological activated carbon filters, in: Oxidation Techniques in Drinking Water, edited by: Kuhn, W. and Sontheimer, H., US Environmental Protection Agency EPA570/9-79-020, 715–726, 1979. Juhna, T. and Rubulis, J.: Problem of DOC removal during biological treatment of surface water with a high amount of humic substances, Water Sci. Technol. Water Supply, 4, 183–187, 2004. Klimenko, N., Smolin, S., Grechanyk, S., Kofanov, V., Nevynna, L., and Samoylenko, L.: Bioregeneration of activated carbons by bacterial degraders after adsorption of surfactants from aqueous solutions, Colloid. Surface. A, 230, 141–158, 2003. Knappe, D. R. U., Snoeyink, V. L., Roche, P., Prados, M. J., and Bourbigot, M.-M.: The effect of preloading on rapid small-scale column test predictions of atrazine removal by GAC adsorbers, Water Res., 31, 2899–2909, 1997. Kruithof, J. C. and Maschelein, W. J.: State-of-the-art of the application of ozonation in Benelux drinking water treatment, Ozone Sci. Eng., 21, 139–152, 1999. Labouyrie, L., Bec, R. L., Mandon, F., Sorrento, L. J., and Merlet, N.: Comparaison de L’Activite Biologique de Differents Charbons Actifs en Grains Comparison of Biological Activity of Different Types of Granular Activated Carbons, Environ. Technol., 18, 151–159, 1997. Leenheer, J. A. and Crou´e, J.-P.: Characterizing aquatic dissolved organic matter, Environ. Sci. Technol., 37, 18A–26A, 2003. Magic-Knezev, A. and van der Kooij, D.: Optimisation and significance of ATP analysis for measuring active biomass in granular activated carbon filters used in water treatment, Water Res., 38, 3971–3979, 2004. Mathworks: Matlab® The language of technical computing, version 7.5.0.342 (R2007b), The Mathworks Inc, 2007. Orlandini, E.: Pesticide removal by combined ozonation and granular activated carbon filtration, Ph.D. thesis, Wageningen University and International Institute for Infrastructural, Hydraulic and Environmental Engineering, Delft, The Netherlands, 1999.
www.drink-water-eng-sci.net/4/25/2011/
L. T. J. van der Aa et al.: Effects of ozonation and temperature on the biodegradation of NOM in BGAC filters Perdue, E. M. and Ritchie, J. D.: Dissolved Organic Matter in Freshwaters, in: Treatise on Geochemistry, edited by: Drever, J. I., 273–318, 2004. Rietveld, L., van der Helm, A., van Schagen, K., van der Aa, R., and van Dijk, H.: Integrated simulation of drinking water treatment, J. Water Supply Res. Technol. AQUA, 57, 133–141, 2008. Schreiber, B., Brinkmann, T., Schmalz, V., and Worch, E.: Adsorption of dissolved organic matter onto activated carbon – the influence of temperature, absorption wavelength, and molecular size, Water Res., 39, 3449–3456, 2005. Schreiber, B., Schmalz, V., Brinkmann, T., and Worch, E.: The effect of water temperature on the adsorption equilibrium of dissolved organic matter and atrazine on granular activated carbon, Environ. Sci. Technol., 41, 6448–6453, 2007. Servais, P., Billen, G., and Bouillot, P.: Biological Colonization of Granular Activated Carbon Filters in Drinking-Water Treatment, J. Environ. Eng., 120, 888–899, 1994. Servais, P., Anzil, A., Gatel, D., and Cavard, J.: Biofilm in the Parisian suburbs drinking water system, J. Water Supply Res. Technol. AQUA, 53, 313–323, 2004. Siddiqui, M. S., Amy, G. L., and Murphy, B. D.: Ozone enhanced removal of natural organic matter from drinking water sources, Water Res., 31, 3098–3106, 1997. Sontheimer, H., Crittenden, J. C., and Summers, R. S.: Activated carbon for water treatment, 2 Edn., AWWA – DVGW Forschungssstelle Engler Bunte Institut, Karlsruhe, Germany, 1988. Standard Methods: Standard Methods for the examination of water & wastewater, 20 Edn., American Public Health Association/American Water Works Association/Water Environment Federation, Washington DC, USA, 1998. Summers, R. S. and Roberts, P. V.: Activated carbon adsorption of humic substances: II. Size exclusion and electrostatic interactions, J. Colloid Interface Sci., 122, 382–397, 1988. Uhl, W.: Einfluss von Sch¨uttungsmaterial und Prozessparmetern auf die Leistung von Bioreaktoren bei der Trinkwasseraufbereitung (Influence of filter material and process parameters on the performance of bioreactors in the drinking water treatment), Ph.D. thesis, IWW Rheinisch-Westf¨allisches Institut f¨ur Wasserforschung gemeinn¨utzige GmbH, Institut an der GerhardMercator-Universit¨at Duisburg, M¨ulheim an der Ruhr, Germany, 2000. Urfer, D. and Huck, P. M.: Measurement of biomass activity in drinking water biofilters using a respirometric method, Water Res., 35, 1469–1477, 2001.
www.drink-water-eng-sci.net/4/25/2011/
35
van der Aa, L. T. J.: Effects of pre-oxidation and filter run time on the performance of biological granular activated carbon filters, in preparation, 2011. van der Helm, A. W. C.: Integrated modeling of ozonation for optimization of drinking water treatment, Ph.D. thesis, Water Management Academic Press, Delft, The Netherlands, 2007. van der Helm, A. W. C., Smeets, P. W. M. H., Baars, E. T., Rietveld, L. C., and van Dijk, J. C.: Modeling of Ozonation for Dissolved Ozone Dosing, Ozone Sci. Eng., 29, 379–389, 2007. van der Helm, A. W. C., Rietveld, L. C., Bosklopper, T. G. J., Kappelhof, J. W. N. M., and van Dijk, J. C.: Objectives for optimization and consequences for operation, design and concept of drinking water treatment plants, Water Sci. Technol. Water Supply, 8, 297–304, 2008. van der Kooij, D., Oranje, J. P., and Hijnen, W. A. M.: Growth of Pseudomonas aeruginosa in tap water in relation to utilization of substrates at concentrations of a few micrograms per liter, Appl. Environ. Microbiol., 44, 1086–1095, 1982a. van der Kooij, D., Visser, A., and Hijnen, W. A. M.: Determining the concentration of easily assimilable organic carbon in drinking water, J. Am. Water Works Assn., 74, 540–545, 1982b. van der Kooij, D., Hijnen, W. A. M., and Kruithof, J. C.: The effects of ozonation, biological filtration and distribution on the concentration of easily assimilable organic carbon (AOC) in drinking water, Ozone Sci. Eng., 11, 297–311, 1989. van der Kooij, D.: Assimilable organica carbon as indicator of bacterial regrowth, J. Am. Water Works Assn., 84, 57–65, 1992. van Schagen, K. M., Rietveld, L. C., and Babuˇska, R.: Dynamic modelling for optimisation of pellet softening, J. Water Supply Res. Technol. AQUA, 57, 45–56, 2008. Walker, G. M., and Weatherley, L. R.: Bacterial Regeneration in Biological Activated Carbon Systems, Process Saf. Environ., 76, 177–182, 1998. Wang, H., Ho, L., Lewis, D. M., Brookes, J. D., and Newcombe, G.: Discriminating and assessing adsorption and biodegradation removal mechanisms during granular activated carbon filtration of microcystin toxins, Water Res., 41, 4262–4270, 2007. ¨ and Can, Z. S.: Impact of SurYapsakli, K., C ¸ ec¸en, F., Aktas, O., face Properties of Granular Activated Carbon and Preozonation on Adsorption and Desorption of Natural Organic Matter, Environ. Eng. Sci., 26, 489–500, doi:10.1089/ees.2008.0005, 2009. Yavich, A. A., Lee, K.-H., Chen, K.-C., Pape, L., and Masten, S. J.: Evaluation of biodegradability of NOM after ozonation, Water Res., 38, 2839–2846, 2004.
Drink. Water Eng. Sci., 4, 25–35, 2011