MANNING, W. J., W. A. FEDER, I. PERKINS, and M. L. COOPER. 1966. Pathogenic races of the bacterial. GLICKMAN. 1969. Ozone injury and infection of potato.
Ecology and Epidemiology
Effects of Ozone on Infection of Soybean by Pseudomonas glycinea J. A. Laurence and F. A. Wood Department of Plant Pathology, University of Minnesota, St. Paul, MN 55108. Present addresses of the authors: Boyce Thompson Institute for Plant Research, 1086 North Broadway, Yonkers, NY 10701; and Dean for Research, Institute of Food and Agricultural Sciences. University of Florida, Gainesville, FL 32601, respectively. This research was supported, in part, by the National Park Service, U. S. Department of the Interior. Scientific Journal Series Paper No. 9936, Minnesota Agricultural Experiment Station, University of Minnesota, St. Paul, MN 55108. Accepted for publication 6 September 1977. ABSTRACT LAU RENCE, J. A., and F. A. WOOD. 1978. Effects of ozone on infection of soybean by Pseudomonas glycinea. Phytopathology 68: 441-445. of exposure also were protected when inoculated subsequently. Similar effects were observed when primary and young trifoliolate leaves were exposed to 157Mg/m 3 (0.08 ppm) for 4 hr, but not when fully expanded trifoliolate leaves were exposed.
Ozone inhibited infection by Pseudomonas glycinea in primary and trifoliolate leaves of soybean inoculated I day prior to, or several days after fumigation with 490 gg/mm (0.25 ppm) 03 for 4 hr. The protective effect persisted over the period that primary leaves were susceptible to the bacterium, Trifoliolate leaves that were beginning to expand at the time
Additional key words: pollutant-parasite interaction, air pollution, bacterial diseases. Ozone (03) interacts with plant parasites and thus influences plant diseases. It has been demonstrated that exposure of plants to ozone generally reduces infection, invasion, and sporulation by fungal pathogens (5). In some instances, however, diseases caused by facultative parasites may be enhanced by 03 exposure (14, 15, 16) as in the case of Botrytis cinerea on field-grown potatoes. Interactions of bacterial pathogens and 03 have been investigated to a limited extent. Kerr and Reinert (7) reported inhibition of 03 injury surrounding bacterial lesions on Phaseolus vulgaris. Also, it has been reported that 03 explosure decreased nodule formation by Rhizobium sp. on soybean, and nodule number, size, and weight on pinto bean (13, 21). Pellet al. (18) examined the interaction of 03 and a Pseudomonassp. which caused a hypersensitive reaction on soybean. The plant's response to 03 and Pseudomonas sp. combined was more severe than either treatment alone (10, 18). In many states, including Minnesota, substantial cropping of soybeans is done within 150 km of metropolitan areas and those fields may be exposed to elevated 03 concentrations. Ozone-type symptoms have been observed on field-grown soybeans within 120 km of St. Paul (S. Krupa, personal communication), The response of soybean to 03 has been described and genetically controlled sensitivity of cultivars has been documented (22). Symptoms of 03 injury include purple stippling and flecking of the upper leaf surface, and bifacial necrosis when high 03 concentrations are used (19, 20, 22). Bacterial blight of soybean, a disease caused by Pseudomonas glycinea Coerper (syn. P. syringae van 00032-949X/78/000 073$03.00/0 Copyright © 1978 The American Phytopathological Society, 3340 Pilot Knob Road, St. Paul, MN 55121. All rights reserved.
Hall), is widespread in the USA and is a common leafspot disease throughout the upper midwest. Typical symptoms include small, water-soaked angular leafspots, sometimes surrounded by a yellow halo. Owing to the importance of soybean as a crop, the increased periods of elevated 03 concentrations in rural areas (17, 23), and the lack of information on interactions between 03 and bacterial pathogens, studies were undertaken with the objectives of: (i) identifying the relationship of 03 exposure to P. glycinea infection of soybean, and (ii) evaluating the pollutant-parasite interaction as a basis for air quality standards. A summary of a portion of this research has been published (9). MATERIALS AND METHODS Culture of soybean.--Chippewa 64 soybean seeds were sown, seven per 10-cm square pot, in a layer of sand underlain by steamed greenhouse soil mix. Pots were maintained in a greenhouse at approximately 21 C with a 16-hr photoperiod. Sixteen days after planting, seedlings were thinned to three per pot and inspected to assure that neither 03 nor bacterial blight symptoms were present. Twenty-three days after planting, plants were fertilized uniformly with 50 ml of an all-purpose liquid fertilizer (N:P:K: 20-20-20). Culture of Pseudomonas glycinea.-An isolate of P. glycinea obtained from field-grown soybean plants and identified as race 2 after inoculation of standard differential cultivars (1), was used in all experiments. The stock culture was maintained on nutrient agar at 5 C, and was re-isolated periodically from infected plants to maintain pathogenicity. Inoculum was prepared by suspending 48-hr nutrient
441
442
PHYTOPATHOLOGY
agar cultures, grown at 27 C in sterile distilled water, and adjusting the suspension with a colorimeter to 107 cells/ ml.
[Vol. 68
inequality (4) which adjusts the test to reflect the number of treatment comparisons made.
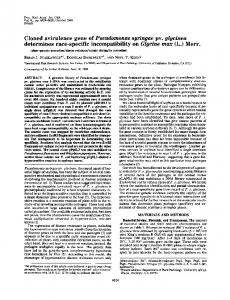
RESULTS Ozone exposure procedure.-Two days prior to treatment, pots were transferred to and randomly placed Relationship of 03 concentration and length of in a conditioning growth chamber receiving charcoalexposure to symptom severity.-The response of filtered air (Environmental Growth Chambers, Model MChippewa 64 soybean was evaluated to determine the 2, Integrated Development and Manufacturing Co., relationship between five pollutant concentrations, four Chagrin Falls, OH 44022). The plants were maintained at periods of exposure, and symptom severity. Two types of 21 C, 80% relative humidity and 26 K Ix illumination with symptoms were commonly observed: a purple stippling of a 12-hr photoperiod. All plants were watered uniformly the adaxial surface, obtained only at an 03 concentration and exposed to light for 1.5 hr prior to exposure to 03. of 392 gg/m 3 (0.20 ppm) for2to4 hr, and a necrotic fleck, Plants then were transferred to a modified growth also on the upper surface, which occurred at higher chamber (24) where they were exposed to 03 from 0800 to concentrations. Bi-facial necrosis was observed on some 1200 hours, under the same environmental regime used plants fumigated with 588 jg/m3 (0.30 ppm) for 4 hr. previously. Ozone was produced with an Orec Model A three-dimensional plot revealed that a true 03 V5-0 03 generator (Ozone Research and Equipment arithmetic dose-response relationship was not present Corp., Phoenix, AZ 85019) and measured continuously since equal concentration X length of exposure products with a calibrated McMillan 1100 chemiluminescence (doses) did not result in similar responses (Fig. 1). It was monitor (McMillan Electronics Company, Houston, TX evident that as either concentration or length of exposure 3 77036). Concentrations of 03 during exposure varied ±19 increased, injury became more severe until, at 588 /Ag/m to 29 jig/m 3 (0.01 - 0.015 ppm) from the desired (0.30 ppm) for4 hr, 80% of the leaf area became necrotic. 3 Based on these results, combinations of 490 Ag/ m concentration. Immediately following exposure, the plants were returned to the initial chamber where they (0.25 ppm) for 4 hr, which produced a uniform necrotic were maintained for 2 days, and then transferred to the fleck on exposed leaves, and 157 lig/lm 3 (0.08 ppm) for 4 greenhouse. hr, which did not produce visible injury, were chosen for Ozone injury was evaluated 7 days after exposure by use in the experiments described below. visual estimates of symptom intensity. Reference charts Ozone - P. glycinea interactions.-Twenty-one days similar to those used by Kohut et al. (8) were employed to after planting, when primary leaves of plants were almost standardize estimates of percent leaf area affected and fully expanded, they were exposed to 490 jg/m3 (0.25 frequency of the symptom. The index ranged from 0 ppm) 03 for 4 hr. These leaves were inoculated with P. (none) to 100 (most severe). glycinea at six times: 2 days, 1 day, and 1 hr before and 1 Inoculation procedure.--Soybean plants were hr, 1 day, and 2 days after exposure. Conditioning inoculated at six different times with P. glycinea by periods, exposure, and inoculation procedures were as applying 0.5 ml/leaf or leaflet of standardized bacterial described in Materials and Methods. The experiment was suspension with a DeVilbiss No. 15 atomizer. Inoculation repeated three times. times ranged from 2 days before 03 exposure to 16 days Ozone symptom severity was recorded 1 wk after after exposure. Noninoculated control plants were exposure. The number of bacterial lesions per leaf was treated identically except that sterile, distilled water was recorded 2 wk after inoculation. Comparisons were made substituted for bacterial suspension. The number of only between exposed and nonexposed plants at the same bacterial lesions per leaf was determined 14 days after time of inoculation. The changes in susceptibility of the inoculation. plant to the bacterium with age, and our inability to Experimental design.--Dose-responseexperiments. A precisely quantify viable inoculum made meaningful completely randomized design was utilized with five comparisons between times of inoculation impossible. replications of three plants each per treatment. Plants When compared to controls, fewer lesions per primary were exposed to 03 at each of five concentrations and four leaf were observed in exposed plants inoculated at I day time periods. The entire experiment was conducted twice. and 1 hr before exposure and at 1 hr, I day, and 2 days Appropriate controls were maintained. Regression after exposure. In many cases, these differences were analysis was used to determine the relationship between significant as indicated by p-values in Fig. 2-A. It is pollutant concentration, length of exposure, and severity apparent that the differences and trends were consistent index, across experiments although the presence of a significant Ozone-Pseudomonas glycinea interaction repetition X time of inoculation interaction did not permit experiments.--Factorial experiments in randomized, the repetitions to be combined for analysis. complete block design involving two leaves per plant, The length of time over which the decrease in bacterial three plants per pot, and four blocks were utilized. All but infection persists was determined by extending the time of one of the experiments were repeated three times; the inoculation. Primary leaves were inoculated at I hr, I day, remaining experiment was repeated twice. To stabilize the 2 days, 4 days, 8 days, and 16 days after exposure. In variance, the data were (re-expressed) as the square root addition, trifoliolate leaflets which were beginning to of the number of bacterial lesions per leaflet and were expand at the time of exposure were inoculated 8 and 16 analyzed by factorial analysis of variance. Non- days after exposure. The experiment was repeated three transformed 03 symptom severities were analyzed in a times. similar fashion. Relationships of treatment means were A lower mean number of lesions per leaf again was examined using two sample t-tests and the Bonferroni observed. At 8 days after exposure, primary leaves of
443
LAURENCE AND WOOD: PSEUDOMONAS/SOYBEAN/OZONE
March 1978]
susceptibility of primary leaves to the bacterium dropped both exposed and nonexposed plants were beginning to sharply 8 days after exposure in both exposed and senesce and were not susceptible to infection. At 8 and 16 nonexposed leaves. Differences were generally smaller days after exposure, exposed trifoliolate leaflets also were than those previously observed and the almost total found to have fewer lesions per leaflet (Fig. 2-B). suppression of bacterial infection noted before was absent Based on results of these experiments, further investigations were made to determine the effect of 03 on at the lower concentration exposure. There was, however, P. glycinea infection in trifoliolate leaves. The times of a reduction in mean number of lesions per leaflet on the inoculation ranged from 2 days before to 2 days after exposed trifoliolate leaflets inoculated 8 and 16 days after exposure as previously described. Plants were fumigated 28 days after planting, when trifoliolate leaves were almost fully expanded. The experiment was repeated three times. Differences were not found in mean number of lesions------------------------------------90 80 ------------------------------------per leaflet between exposed and nonexposed plants when -0 inoculated 2 days prior to exposure. Thereafter, in all but one case, exposed plants had fewer lesions per leaflet than 600 _ did nonexposed plants (Fig. 2-C). 50 >/ 90 Experiments identical to those previously described 3 40 80 -------were made with an exposure of 157 A.g/m (0.08ppm) for o . 70o 4 hr. This exposure regime did not result in visible injury 30 to plants and was used to investigate effects of x z 60 -asymptomatic 03 stress on a plant-parasite interaction. 0 --------In the first of these experiments, inoculations were >. 5o remade from 2 days before to 2 days after exposure. Plants w, were exposed 21 days after planting, when primary leaves 74 --30 were almost fully expanded. The experiment was 20 repeated three times. -0 The results of this experiment were similar to those at 1 A+ 0 the higher concentration exposure (Fig. 3-A). Differences
in mean number of lesions per leaf were observed at 1day and 1hr before exposure and I hr, 1day, and 2 days after exposure (Fig. 3-A). When the time of inoculation was extended to 4, 8, and
16 days after exposure, it was again noted that
& FUMIGATED 10
U NON-FUMIGATED
AI
l
9 8
•
FUMIGATEDU
'
4.
32
411
Fig. 1. Relationship of 03 concentration and length of exposure to 03 symptom severity on Chippewa 64 soybeans. 1
pphm= 19.6
)g/m3.
B
m
FUMIGATED
NON- FUMIGATED
8'
NON-FUMIGATED
-C
8 7 6
4
~f
8 fo
l~j~
15
WPM) OZONECONCENTRATION
76
6
20
25
30
J0
4
3C
3~
206 C
0
I
V
C
~
0
8~
2
I~
0UVI fl ~
o
lC 8E Vlf~3 V~
-761
5i
5
44
63?
99
~86
98 7-
7
7 6
4
4
66 4-
01I
..6-_ U
L
1
1DA96 1D16 2DAYS 2DAYS IDAY 16096 BEFORE EXPOSURE AFTER EXPOSURE OF INOCULATION TIME
f
M Vf
__ 1H0R
1AY
2D
DAYSA
8DAYS 16DAYS
EXPOSURE) TIMEOF INOCULATION(AFTER
3
__
2DAYS IDAY 1HOUR I9OUR IDAY 2DAIS AFTER EXPOSURE BEFORE EXPOSURE TIMEOFINOCULATIOR
, 4 hr) on infection of soybean by Pseudomasglycinea. Absence of a p-value Fig. 2-(A to C). Effect of 03 exposure (490 g!g/m indicates p>0.3. Data are expressed as the mean of the square root of the number of bacterial lesions observed on leaves of exposed and non-exposed Chippewa 64 soybean plants. A) Primary leaves inoculated from 2 days before to 2 days after exposure. B) Leaves inoculated from I hr to 16 days after exposure. Inoculations at 8 and 16 days were of trifoliolate leaves,just beginning to emerge at the time of exposure. C) Trifoliolate leaves inoculated from 2 days before to 2 days after exposure.
444
PHYTOPATHOLOGY
exposure, thus showing a trend similar to that observed at the higher concentration (Fig. 3-B). Trifoliolate leaves also were exposed to 157 Mg!m 3 (0.08 ppm) for 4 hr and inoculated as before. The results were more variable than those in previous experiments, The differences in mean number of lesions per leaflet were generally small and the response observed showed no consistent trend in that, occasionally, exposed leaves had more lesions than did nonexposed leaves (Fig. 3-C). DISCUSSION The 0 3 -P. glycinea interaction experiments indicate that 03 at the dosages used has a detrimental effect on bacterial infection of primary and trifoliolate leaves. It does not appear as though a lack of tissue available for infection was the cause of this reduction since the response occurred at levels of 03 that caused light-tomoderate, or no visible injury. In addition, when leaves were inoculated 2 days prior to exposure, the same amount of 03 injury was observed and there was no difference in number of bacterial lesions present on exposed versus nonexposed plants. A possible explanation for the difference in bacterial infection is the production, by the plant, of a bacteriostatic or bactericidal compound, or compounds, in response to 03 exposure. Keen, and Taylor (6) have reported the production of the isoflavonoid compounds daidzein, coumestrol, and sojagol in soybean foliage following exposure to concentrations of 03 which produced visible symptoms. The soybean phytoalexin, glyceollin, was not produced. They found that elevated
N\ FUMIGATED
U
NON-FUMIGATED
18 -
concentrations of coumestrol began to occur about 10 hr after exposure. This observation would include the accumulation of this compound in the time period needed for infection to take place in a leaf inoculated I day prior to, but in most cases, not 2 days prior to exposure. Lyon and Wood (11) have found coumestrol to be bacteriostatic or bactericidal when tested against Pseudomonas sp. The production of peroxidases occurs in soybean following 03 fumigation (2, 3). These compounds also could be contributing to the difference in bacterial infection observed. The reduced infection of trifoliolate leaves 8 and 16 days after exposure suggests either that (i) compounds inhibiting infection can be produced in young leaf tissue, or (ii) that materials produced in primary leaves are translocated to trifoliolates where their effect becomes evident. In contrast to other reports (7, 12, 18), differences were not detected in severity of 03 injury on infected versus noninfected leaves. It is probable that the inhibition of 03 injury surrounding infection sites (7) occurs when an active, well-established infection is present. In comparison to studies where localized protection has beeni observed, the inoculation procedure used in our studies would probably result in a very small number of bacterial cells being introduced into the leaf. If an accumulation of materials produced by the plant or bacterium is necessary to inhibit 03 injury, it is possible that the reduced number of infections would result in a delayed buildup of the necessary compounds and subsequently, there would be no effect on 03 injury.
FUMIGATED
N
NON-FUMIGATED
R
FIGATED
NON-FUGATED
A-
A
16U-
B
14 12 -
10
0 V
"1
•8
2
14 12-
0 1
102 14
-
I
2 1 1
-
1'I V\' 4i
C
18-
6
3 162
16
14 12 10
\N
[Vol. 68
0 14
46
-12
U -
2
-
I 2DAYS I DAY I HOUR 1 HOUR 1 EXPOSURE DAY 2DAYS AFTER EXPOSURE BEFORE TIME OFINOCULATION
1HOUR TDAY
I 2DAYS 4DAYS 8DAYS I6 DAYS
TIME OFINOCULATION (AFTER EXPOSURE)
i 0
l 2DAYS 1 DAT
1HOUR
1NU
A
2DS
BEFORE EXPOSURE AFTER EXPOSURE TIMEOFINOCULATION
Fig. 3-(A to C). Effect of 03 exposure (157 •g/m 3, 4 hr) on infection of soybean by Pseudomonasglycinea. Absence of a p-value indicates p>0.3. Data are expressed as the mean of the square root of the number of bacterial lesions observed on leaves of exposed and nonexposed Chippewa 64 soybean plants. A) Primary leaves inoculated from 2 days before to 2 days after exposure. B) Leaves inoculated from I hr to 16 days after exposure. Inoculations at 8 and 16 days were of trifoliolate leaves, just beginning to emerge at the time of exposure. C) Trifoliolate leaves inoculated from 2 days before to 2 days after exposure.
March 1978]
LAURENCE AND WOOD: PSEUDOMONAS/ SOYBEAN/OZONE
The response of Chippewa 64 soybean to 03 exposure was similar to that reported by Tingey et al. (22) except that a lower level of injury was observed. The occurrence of stippling at lower concentrations was similar to that nin field-grown soybeans in Minnesota following intMionsof 294lowing to ambien 03bat seen exposure to ambient 03 at concentrations of 294- 392 3 •g/m (0.15 - 0.20 ppm) for 4 to 6 hr (S. Krupa,personal communication. It appears that the response of this cultivar of soybean to 03 exposure is not linear, suggesting that if 03 concentrations increase in rural areas, a substantial increase in injury might be expected. LITERATURE CITED I. CROSS, J. E., B. W. KENNEDY,J. W. LAMBERT,and R. L. COOPER. 1966. Pathogenic races of the bacterial blight pathogen of soybeans, Pseudomonas glycinea. Plant Dis. Rep. 50:557-560. 2. CURTIS, C. R., and R. K. HOWELL. 1971. Increases in peroxidase isoenzyme activity in bean leaves exposed to low doses of ozone. Phytopathology 61:1306-1307. 3. CURTIS, C. R., R. K. HOWELL, and D. R. KREMER. 1976. Soybean peroxidases from ozone injury. Environ. Pollut. 11:189-194. 4. DAVID, H. A. 1970. Order statistics. John Wiley and Sons, New York. 272 p. 5. HEAGLE, A. S. 1973. Interactions between air pollutants and plant parasites. Annu. Rev. Phytopathol. 11:365-388. 6. KEEN, N. T., and 0. C. TAYLOR. 1975. Ozone injury in soybeans. Isoflavonoid accumulation is related to necrosis. Plant Physiol. 55:731-733. 7. KERR, E. D., and R. A. REINERT. 1968. The response of bean to ozone as related to infection by Pseudomonas phaseolicola. Phytopathology 58:1055 (Abstr.). 8. KOHUT, R. J., D. D. DAVIS, and W. MERRILL. 1976. Response of hybrid poplar to simultaneous exposure to ozone and pan. Plant Dis. Rep. 60:777-780. 9. LAURENCE, J. A., and F. A. WOOD. 1976. Ozone exposure protects soybean from Pseudomonas glycinea. Proc. Am. Phytopathol. Soc. 3:226 (Abstr.). 10. LUKEZIC, F. L., E. J. PELL, and R. G. LEVINE. 1976. Ozone pretreatment protects soybean against a bacteriainduced hypersensitive response. Proc. Am. Phytopathol. Soc. 3:241 (Abstr.). 11. LYON, F. M., and R. K. S. WOOD. 1975. Production of
445
phaseollin, coumestrol and related compounds in bean leaves inoculated with Pseudomonas spp. Physiol. Plant Pathol. 6:117-124. 12. MAGDYCZ, W. P., and W. J. MANNING. 1973. Botrytis cinerea protects broad bean against visible ozone injury. Phytopathology 63:204 (Abstr.). 13. MANNING, W. J., W. A. FEDER, and P. M. PAPIA. 1972. Influence of long term low levels of ozone and benomyl on growth and nodulation of pinto bean plants. Phytopathology 62:497 (Abstr.). 14. MANNING, W. J., W. A. FEDER, and 1. PERKINS. 1970. Ozone and infection of geranium flowers by Botrytis cinerea. Phytopathology 60:1302 (Abstr.). 15. MANNING, W. J., W. A. FEDER, and I. PERKINS. 1970. Ozone injury increases infection of geranium leaves by Botrytis cinerea. Phytopathology 60:669-670. 16. MANNING, W. J., W. A. FEDER, I. PERKINS, and M. GLICKMAN. 1969. Ozone injury and infection of potato leaves by Botrytis cinerea. Plant Dis. Rep. 53:691-693. 17. MILLER, P. R., M. H. MC CUTCHAN, and H. P. MILLIGAN. 1972. Oxidant air pollution in the Central Valley, Sierra Nevada foothills, and Mineral King Valley of California. Atmos. Environ. 6:623-633. 18. PELL, E. J., F. L. LUKEZIC, and W. C. WEISSBERGER. 1976. Alteration of ozone injury of soybean foliage preinoculated with Pseudomonas sp. which elicits a hypersensitive response. Proc. Am. Phytopathol. Soc. 3:242 (Abstr.). 19. PELL, E. J., and W. C. WEISSBERGER. 1976. Histopathological characterization of ozone injury to soybean foliage. Phytopathology 66:856-861. 20. RICH, S. 1964. Ozone damage to plants. Annu. Rev. Phytopathol. 2:253-266. 21. TINGEY, D. T., and U. BLUM. 1973. Effects of ozone on soybean nodules. J. Environ. Qual. 2:341-342. 22. TINGEY, D. T., R. A. REINERT, and H. B. CARTER. 1972. Soybean cultivars: Acute foliar response to ozone. Crop. Sci. 12:268-270. 23. U. S. ENVIRONMENTAL PROTECTION AGENCY. 1973. Investigation of high ozone concentration in the vicinity of Garrett County, Maryland and Preston County, West Virginia. Environm. Prot. Agency PubI. EPA-R4-73-019. Jan. 1973. 185 p. 24. WOOD, F. A., D. B. DRUMMOND, R. G. WILHOUR, and D. D. DAVIS. 1974. An exposure chamber for studying the effects of air pollution on plants. Pa. Agric. Exp. Stn. Prog. Rep. 335. 7 p.