Sediment feed material was identical to the bed material (see also van Dijk et al., and Klein- hans et al., this volume). A vegetation density of 2.2 seeds/cm2 was ...
River Flow 2010 - Dittrich, Koll, Aberle & Geisenhainer (eds) - © 2010 Bundesanstalt für Wasserbau ISBN 978-3-939230-00-7
Effects of riparian vegetation on experimental channel dynamics Wietse I. van de Lageweg, Wout M. van Dijk, Remko Hoendervoogt & Maarten G. Kleinhans
Faculty of Geosciences, Universiteit Utrecht, PO Box 80115, 3508 TC, Utrecht, The Netherlands
ABSTRACT: Through bar theory it is known that channel width-depth ratio affects bar pattern and that relatively narrow channels with strong banks are required for meandering. Riparian vegetation is able to alter the channel width-depth ratio and therefore the channel pattern. However, determination of the underlying mechanisms and processes has remained scarce and qualitative and hence these effects are not yet fully understood. The objective of this study is to experimentally determine the effects of riparian vegetation on bank strength, channel pattern and meandering dynamics. Bank erosion and -failure experiments were performed with four different vegetation species to quantify the strength introduced by plant roots at the experimental scale. To study pattern evolution and morphodynamics we used a 1.25x7.5 m flume with a constant discharge and sediment feed. The introduction of vegetation in experiments results in narrower and deeper channels. Higher vegetation density leads to static channels with occasional sharp bends. Vegetation increases the threshold for erosion and failure of bank material as indicated by higher measured cohesion values and lower bank erosion rates. We conclude that a low vegetation density is crucial to maintain a dynamic fluvial system. Keywords: Riparian vegetation, Channel pattern, River bank erosion, Fluvial morphology
1 INTRODUCTION
sediment such that bars will develop into levees earlier (Kleinhans, 2010). Whilst many field and laboratory studies describe these processes or model some of them, the entire suite of processes and feedbacks which riparian vegetation exerts on channel pattern remain poorly understood. Large-scale experiments with self-formed patterns could enhance our quantitative insights if the scaling of bank strength can be done properly (see also Kleinhans et al., this volume). The main objective of this study is to determine and quantify the effects of riparian vegetation on experimental bank strength and channel pattern development. This is done by a series of systematic tests involving detailed bank erosion and failure experiments, and large-scale flume experiments.
1.1 Channel pattern and bank strength Natural rivers show a wide variety of channel patterns ranging from nearly straight to meandering and braided. The channel pattern determines how a river flows through the landscape, and develops its surrounding banks, levees and floodplains. Bank strength determines elementary characteristics of rivers such as channel width-depth ratio, bar and channel pattern, and natural flooding frequency (Kleinhans, 2010). Without bank strength natural and experimental rivers evolve into wide and shallow braided rivers with a chaotic bar pattern (Parker, 1998). When bank strength is present rivers are narrower and deeper, and often have alternating bars (Struiksma et al., 1985; Camporeale et al., 2007; see also van Dijk et al., this volume). Pools in between these alternating bars can lead to systematic bank erosion (Darby et al., 2002) which often leads to a meandering channel pattern. This process can be enhanced by riparian vegetation which adds strength and traps cohesive
1.2 Bank failure At the interface of flow and river bank the relation between the resisting forces of the bank material and the hydraulic force of the flow determine the failure process (Simon et al., 1999). Bank erosion 1331
results in bank undercutting after which the geotechnical forces of the bank material determine whether the bank fails. Bank failure occurs when the gravitational force exceeds the resisting strength of the bank material. In its simplest form of a planar failure of unit width and length, the gravitational force is given by: G = W ⋅ sin β
Furthermore, some roots break during mass failure, while others are pulled out but remain intact. The hydrologic effects of riparian vegetation concern canopy interception and evapotranspiration. These processes lead to drier and better drained banks with a reduced weight as well as lower positive pore pressures, which decrease the risk of bank failure (Simon and Collisson, 2002). Riparian vegetation can also decrease bank stability. It creates a higher hydraulic roughness, or locally diverts the flow to the banks, which may lead to bank erosion and can therefore be the onset of bank instability (Rowntree and Dollar, 1999). The weight of the riparian vegetation can either be detrimental by adding additional mass on a potential failure plane, or beneficial by adding normal stress and thereby shear strength (Simon and Collisson, 2002). During a number of flume studies vegetation was introduced. Gran and Paola (2001), Tal et al. (2004) and Tal and Paola (2007) seeded alfalfa to a braided experimental river in non-cohesive uniform sediment during low flow. The roots provided strength to the banks and the stems created a higher hydraulic roughness to the flow during floods, which resulted in the transition from a fully braided to a wandering pattern. Braudrick et al. (2009) obtained low-sinuosity meanders using alfalfa which increased bank strength and trapped the light-weight sediment that filled-in lower areas of the floodplain.
(1)
where W=weight of failure block (N) and β=angle of the failure plane (°). The resisting force can be represented by the Coulomb equation for welldrained conditions:
τ f = c'+σ ' f tan ϕ '
(2)
where τf=shear strength at failure (N/m2), c’=effective cohesion (N/m2), σf’=effective stress at failure (N/m2), and φ’=effective angle of internal friction (°). Stability can be expressed by assuming limiting equilibrium between the driving force G and the shearing resistance mobilized along the length of the failure plane. Often these two forces are expressed in the factor of safety (Fs) which is the ratio of the resisting (Eq. 2) to driving (Eq. 1) geotechnical forces. (Simon et al., 1999). 1.3 Effect of riparian vegetation on bank failure The role of riparian vegetation in affecting bank stability has been widely recognized (e.g. Ziemer, 1981; Thorne, 1990; Simon and Collison, 2002; Tal et al., 2004). The main effects of riparian vegetation on bank strength can be divided into mechanical and hydrological ones. Mechanically, riparian vegetation increases bank strength by roots which physically bind sediment particles so the threshold shear stress for erosion increases (Thorne, 1990; Simon and Collison, 2002). Soil without roots has a high compressional strength (the ability to maintain the original shape) but little tensile strength (the ability to stretch and extend). Roots add tensile strength and elasticity, which help to distribute stresses and thus enhance the bulk shear strength of the soil (Simon and Collison, 2002). An increase of root density leads to increased soil strength (Ziemer, 1981; Simon and Collisson, 2002). Individual roots become stronger as they become larger, but the strength of roots varies for different species (Ziemer, 1981). Pollen et al. (2004) and Pollen (2007) concluded that the root tensile strength does not simply add soil strength. The tensile strength added by the vegetation is a function of bank material and moisture content.
2 METHODS 2.1 Materials In this study four plant species were selected based on their hypothesized fast growth capacity and root system characteristics. These species were alfalfa (Medicago sativa), garden cress pepper weed (Lepidium sativum), garden rocket (Eruca sativa) and thale cress (Arabidopsis thaliana). The applied sediment was well-sorted, finegrained and of unimodal size-distribution. The median grain size (D50) was 180 μm and the D10 and D90 were 119 μm and 248 μm respectively. 2.2 Experimental setups To gain specific knowledge on riparian vegetation and bank strength a number of auxiliary experiments were conducted. This specific knowledge was applied in setting up and interpreting the large-scale flume experiments.
1332
2.2.1 Vegetation experiments
2.2.4 Flume experiments
Vegetation was grown under five different environmental conditions (Table 1) to provide additional insight into the growth process, reaction to stresses and root characteristics of different vegetation species. All experiments had a duration of eight days and every day the evapo(transpi)ration, number of plants, height of the plants and the length of the roots were observed.
The large-scale flume experiments were conducted in a 7.5x1.25 m flume set at a slope of 0.005 m/m. The setup consisted of a closed water circulating system with sediment input at the upstream boundary. Water and sediment entered the flume by a 0.3 m long supply channel placed at an angle of 30° to initiate meandering. The initial straight channel was 0.07 m wide and 0.015 m deep. Sediment feed material was identical to the bed material (see also van Dijk et al., and Kleinhans et al., this volume). A vegetation density of 2.2 seeds/cm2 was applied after thirty hours of flow. The vegetation grew for three days under saturated conditions and under a grow lamp before the steady flow of 0.5 l/s was continued. After sixty hours, the vegetation density was doubled to 4.4 seeds/cm2 and after eighty hours the discharge was increased to 0.9 l/s. Measurements involved flow velocity, channel depth, channel width, bed level height, sediment transport and number of scour holes at two hour intervals. Additional morphologic information was available from a digital camera on a gantry and from a fixed time lapse camera. The time lapse camera took pictures of the middle section of the flume at an interval of five minutes.
Table 1. Parameter space of the vegetation experiments. ________________________________________________ Experiment Variable _______________________________________ Control Growlamp Cold Dark Acid Moist 0, 25, 50 100 100 100 100 (%) 75, 100 Lighting Tl Growlamp Tl None Tl Temp. 20.9 24.8 3 20.5 20.9 (°C) pH 7 7 7 7 2.4 ________________________________________________
2.2.2 Bank erosion experiments Standardized bank erosion experiments were done to relate the rate and amount of bank erosion to bank material properties (see also Kleinhans et al., this volume). The setup consisted of a closed circulating water system, with a head tank which guaranteed a constant discharge of 0.1 l/s. The water supply channel was 0.055 m wide, 1.185 m long and coated with a sand layer to represent sand roughness. The standard mold had a volume of 0.645 l and was inclined with a 45° angle to the water supply channel. Bank erosion was monitored from a fixed camera position.
3 RESULTS 3.1 Vegetation experiments
2.2.3 Bank failure experiments
All plant species germinated quickest and grew best on a fully saturated soil during the control vegetation experiment. Further vegetation experiments were therefore performed with saturated soils, and are compared to the saturated control experiment (Table 2).
Direct shear tests related the peak material shear strength at failure to the normal stresses (ASTM, 2004). For present experiment, the direct shear apparatus incorporated a motor to move a piston at a predefined constant rate (horizontal displacement). A load hanger system provided the adjustable (one, five or ten additional kilograms) normal stresses. A pressure sensor recorded the vertical displacement (dilatation). Also, the apparatus was connected to a data logger which recorded the shear and normal stresses over time. A linear trend line of maximum stress at failure versus normal stress was fitted to three replica measurements. The intersection of the trend line with the y-axis (σ’=0) resulted in the cohesion value (c’), and the slope of this trend line indicated the angle of internal friction (φ’).
3.1.1 Plant species A clear division between the four plant species was observed for all growth characteristics. The species garden cress pepperweed and garden rocket germinated quickly, had large number of plants, were tall and developed significant root systems. Both alfalfa and thale cress showed slower germination, smaller number of plants, remained small and developed only small roots. An important difference between the root systems of garden rocket and garden cress pepperweed was observed. The main root of garden cress
1333
Table 2. Qualitative assessment of plant species and environmental conditions. ____________________________________________________________________________________________________. Plant species Environmental conditions ___________ _______________________ GP A GR T Control Growlamp Dark Cold Acid ________________________________ _______________________________________________ Germination fast medium medium slow fast fast fast no fast # plants high low high low high medium high none high Stem height large small large small large medium large none large Root length large small large small medium large medium none medium _____________________________________________________________________________________________________ * GP is garden cress pepperweed, A is alfalfa, GR is garden rocket and T is thale cress. The environmental conditions are evaluated for plant species garden rocket only.
pepperweed penetrated deeply but did not develop sideward, whereas garden rocket had one main root which also developed side branches. The main root penetrated deep, and the smaller branches developed sideward which caused a better anchoring of the plant in the soil.
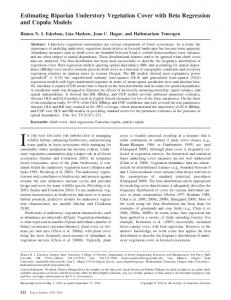
3.2 The effect of vegetation on bank erosion and bank failure 3.2.1 Effect of growth duration and vegetation density on bank erosion Figure 1 shows the resulting sediment volumes after twenty minutes of flow, for different degrees of river bank vegetation cover. The river bank without vegetation (Figure 1A), and the bank with a low vegetation density (0.5 seeds/cm2) and short growth duration (two days) (Figure 1B) showed a smoothly curved bank line. The influence of the vegetation on sediment entrainment by the flow was small. For a bank with moderate vegetation density (2.2 seeds/cm2) and long growth duration (six days) the eroded volume after twenty minutes of flow decreased markedly (Figure 1C). The bank with the highest vegetation density (4.4 seeds/cm2) and long growth duration (six days) was much stronger than at half this density. The locus of maximum bank erosion shifted upstream with increasing vegetation density.
3.1.2 Environmental conditions The grow lamp lighting resulted in a relatively small stem height when compared to the control experiment. It was observed that the plants were darker green in color and had thicker stems and leafs. In comparison to the control experiment, the dark condition showed the same number of plants, similar root lengths, and even an increased stem height. The absence of light did not limit the growth process during the first eight days. The color of the plants was different due to the absence of chloroplasts, which caused yellow to white plants. The acid condition resulted in a similar number of plants, stem height and root length as was observed in the control experiment. Seeds did not germinate for the cold condition. 3.1.3 Synthesis of vegetation experiment Most important for further experiments are the growth characteristics, reaction to stresses and characteristics of the root system of the four plant species. Garden cress pepperweed and garden rocket grew the largest stem heights and root systems, whereas thale cress and alfalfa remained smaller and showed a slower development. Also, garden rocket showed the most favorable root length to stem height ratio which, combined with the side root branches, added to better anchoring. Application of a grow lamp caused more robust plants by limiting the stem height while stimulating stem and leaf thickness and root growth at the same time. Further experiments were therefore continued with a saturated soil, garden rocket as plant species and the grow lamp as environmental condition.
A
B
C
D
Figure 1. Sediment block after twenty minutes of flow for a river bank with A) no vegetation, B) scarce vegetation cover, C) moderate vegetation cover, and D) dense vegetation cover. See main text for further explanation of terms. The white dashed lines indicate the initial sediment block position. Flow is from lower left along the block to the upper right. 1334
A more quantitative analysis of the effect of riparian vegetation on bank erosion is provided in Figure 2. It shows the rate at which the sediment volume decreased over time as a function of vegetation density and growth duration.
The effect of the aggregates was threefold: First, the flow was divided over multiple plants, which resulted in a more irregular erosion surface. Additional effect was the support of individual plants by the aggregate which enabled them to sustain longer compared to individual plants. The largest effect of the vegetation aggregates was their ability to catch upstream eroded plants in direct analogy with large woody debris in real rivers. This initiated the formation of a vegetation cover in front of the eroding surface. This vegetation cover dampened the erosive capacity of the flow considerably and resulted in a reduction of the local bank erosion. 3.2.3 Effect of growth duration and vegetation density on bank failure The results of the direct shear tests were interpreted in terms of the cohesion c’ (Table 2) and angle of internal friction φ’ (Table 3). The bank without vegetation had a cohesion value of 1.7 ± 0.8 kPa. In general, the cohesion values for banks with a vegetation cover were higher. However, no general trend in cohesion was observed for samples with different vegetation densities or growth durations.
Figure 2. Time series of river bank erosion for different vegetation covers. Signatures of vegetation densities are identical for two (grey) and six (black) days growth duration.
The solid line represents a river bank without vegetation. The erosion rates of the two days of growth duration samples (grey signature) resembled the erosion rate of the sample without vegetation during the first ten minutes very well. After this initial period, the sediment volume decreased less fast compared to the sample without vegetation. Vegetation density did not seem to affect bank erosion for this growth duration. The samples with growth duration of six days (black signature) deviated already earlier from the erosion rate of the sample without vegetation. The degree to which they had a lower erosion rate depended on their vegetation density. This indicates that the effect of increased growth duration on bank erosion was of primary importance, whereas the effect of a higher vegetation density was only of secondary importance.
Table 2. Cohesion values ± 1se (kPa) for different vegetation densities (seeds/cm2) and growth durations (days). ________________________________________________ Vegetation Growth duration (days) density (seeds/cm2) 0 3 5 ________________________________________________ 0 1.7 ± 0.8 0.5 5.0 ± 4.1 -0.1 ± 2.2 1.0 6.5 ± 2.7 5.1 ± 3.9 2.2 5.7 ± 2.1 9.0 ± 1.1 4.4 7.0 ± 2.9 8.8 ± 4.3 ________________________________________________
From the bank failure experiment the angle of internal friction φ’ was derived too (Table 3). The bank without vegetation had an angle of internal friction of 41.0 ± 1.7°. In general, the angles of internal friction for banks with a vegetation cover were lower.
3.2.2 Contrasting effects of vegetation on bank erosion The general effect of increased vegetation density was increased bank strength. However, for low vegetation density the erosion was locally enhanced (Figure 1B). Around individual stems and roots additional turbulence was generated which attacked the banks and led locally to increased erosion. When the vegetation was more aggregated bank erosion was suppressed and sometimes stopped. Vegetation aggregates were mostly observed for the higher vegetation densities and appeared to become dominantly effective for longer growth durations (Figure 1C and 1D).
Table 3. Angle of internal friction ± 1se (°) for different vegetation densities (seeds/cm2) and growth durations (days). ________________________________________________ Vegetation Growth duration (days) density (seeds/cm2) 0 3 5 ________________________________________________ 0 41.0 ± 1.7 0.5 43.2 ± 7.4 48.0 ± 4.2 1.0 36.8 ± 5.0 38.8 ± 7.4 2.2 35.4 ± 3.9 30.2 ± 2.2 4.4 37.1 ± 5.5 35.9 ± 8.0 ________________________________________________
1335
The banks without vegetation showed the smallest absolute standard errors in both the cohesion value and angle of internal friction. The presence of the vegetation clearly added uncertainty by increasing the standard error markedly. The effect tended to be larger for longer growth durations and higher vegetation densities and may be due to the roots, which may either break or drag through the sediment.
3.3.2 Hydrodynamics Observations of the number of scour holes, active (i.e. sediment transport taking place) channel width, channel depth, and width-depth ratio (Figure 4) indicate that the vegetation dampened the activity in large parts of the study reach quickly after its establishment. The number of scour holes (Figure 4A) showed a gradual decrease for a growing effect of the vegetation. The initial value of about 300 scour holes which was obtained during the formation of the braided pattern, reached a new equilibrium of about fifty active scour holes after about sixty hours of flow. The active channel width (Figure 4B) showed a strong decrease from 0.65 m to about 0.15 m after the establishment of the vegetation. The increase of the vegetation density after sixty hours of flow was able to decrease the channel width further to 0.12 m. An increase of the discharge from 0.5 l/s to 0.9 l/s after eighty hours of flow did not affect the active channel width. The channel depth (Figure 4C) remained remarkably stable around the initial channel depth of 0.015 m. However, the time-average active channel depth was 15% larger for the experiment with a vegetation cover in comparison to the experiment without vegetation. During the development of the braided pattern the width-depth ratio (Figure 4D) increased dramatically, mainly due to the large increase of the active channel width. After the establishment of the vegetation, width-depth ratios decreased to about ten. The result was an increased floodplain flow which could not be focused in the main channels by the vegetation and was unable to alter the morphology.
3.3 Effect of a dense vegetation on channel dynamics 3.3.1 Channel dynamics A braided pattern formed in the well-sorted fine grained unimodal sediment during the first thirty hours of flow (Figure 3A). A vegetation density of 2.2 seeds/cm2 was uniformly applied to this braided pattern during low flow, but mainly occupied the higher and drier patches, visible as the lighter areas in Figure 3A. After ninety hours of flow (Figure 3B) and ongoing plant growth a system had formed in which the flow was too weak to deepen the main channels. A number of main active channels can be identified in Figure 3B which tended to follow the same general course as the main active pathways of the remnant braided pattern. The vegetation was unable to focus the flow which led to a static pattern. In the upstream section a pattern emerged which was characterized by widespread scour hole and braided bar formation typical of a braided river pattern, whereas in the downstream section sharp bends and local erosion in the outer bends was observed.
A
B
Figure 3. Evolution from a braided river pattern (A) to a static anastomosing river pattern (B). Flow is from left to right. The flume has a width and length of 1.25 and 7.5 meters respectively.
1336
getation results in narrower and deeper channels, i.e. lower width-depth ratios. Introduction of vegetation altered a braided channel pattern to a static anastomosing pattern, showing that there is a fine balance between the requirement to increase bank strength and to maintain channel mobility. The auxiliary vegetation experiments have resulted in a preliminary data set regarding germination, growth characteristics and evaporation of four different plant species. During previous flume studies (e.g. Gran and Paola, 2001; Tal and Paola, 2007; Braudrick et al., 2009) alfalfa was seeded. However, based on the results of the vegetation experiment this species is not the most suitable to apply. Garden cress pepperweed and garden rocket both reached larger stem heights and root systems. Furthermore, garden rocket showed the most favorable root length to stem height ratio which, combined with the side root branches, added to better anchoring. In general, the choice of species and the growing conditions should be adjusted to the required effect of vegetation. The effect of the vegetation on bank erosion was clearly related to vegetation density. At low density however, bank erosion was locally enhanced around individual stems and roots. The direct shear test, quantifying material strength, yielded uncertain results. This may have been due to individual roots either snapping or dragging through the relatively small sample. The cohesion value was generally higher whereas the angle of internal friction was generally lower for banks with vegetation compared to bare banks. Longer time scales are needed to be able to simulate succession of the vegetation correctly and to learn about the effect of vegetation on bank strength over longer time periods. Specific vegetation pilot studies are therefore proposed to study the effects of different plant species, growing conditions, the application of floods, plant mortality and seeding strategy on the establishment of a steady-state vegetation cover. This is needed as the bank strength of this steady-state is relevant for scaling purposes.
Figure 4. Time series of A) number of scour holes, B) active channel width (m), C) channel depth (m), and D) widthdepth ratio from a straight channel to an anastomosing river pattern.
3.3.3 Morphology The final channel pattern resembled a static anastomosing pattern characterized by relatively large stable islands intersected by few active channels. Bends were relics of the initial braided pattern and were immobile apart from some sharpening due to localized erosion of the outer bank (Figure 5). In the inner bend pioneer vegetation settled on top of a forced bar from seeds in the recirculating flow.
Figure 5. Sharp bend with establishment of pioneer vegetation on top of a forced bar. Flow is from right to left.
The pioneer vegetation increased the hydraulic roughness across the point bar which caused a local decrease of the flow velocity in the inner bend region and therefore the bar developed to about bank-full height. Further growth was not possible as the discharge was held constant.
5 CONCLUSIONS The main findings of this study are: • The introduction of vegetation in experiments results in narrower and deeper channels. Higher vegetation density leads to static channels with occasional sharp bends. • Vegetation increases the threshold for erosion and failure of bank material as indicated by higher measured cohesion values and lower bank erosion rates and lower angles of internal friction.
4 DISCUSSION Average active channel depth increased with about 15% due to vegetation whilst active channel width decreased markedly from 0.65 to about 0.15 m, demonstrating that the introduction of ve1337
•
Four tested plant species respond differently to growing conditions, which can be employed to obtain required bank strength and hydraulic resistance.
Thorne, C.R. 1990. Effects of vegetation on riverbank erosion and stability. In: Thornes, J.B., Vegetation and Erosion, John Wiley and Sons Inc, Chichester, 125-143. van Dijk, W.M., van de Lageweg, W.I., Hoendervoogt, R., Kleinhans, M.G. 2010. Incipient meandering and selfformed floodplains in experiments. Proc. River Flow 2010, Braunschweig, September. Ziemer, R.R. 1981. Roots and the stability of forested slopes. IAHS Publ., 132, 343-361.
REFERENCES ASTM D 3080. 2004. Standard Test Method for Direct Shear Test of Soils Under Consolidated Drained Conditions. Annual Book of ASTM Standards, ASTM. West Conshohocken, PA. Braudrick, C.A., Dietrich, W.E., Leverich, G.T., and Sklar, L.S. 2009. Experimental evidence for the conditions necessary to sustain meandering in coarse-bedded rivers. PNAS, 106, 16936-16941. Camporeale, C., Perona, P., Porporato, A., and Ridolfi, L. 2007. Hierarchy of models for meandering rivers and related morphodynamic processes. Reviews of Geophysics, 45. Darby, S. E., Alabyn, A. M., and Van de Wiel, M. J. 2002. Numerical simulation of bank erosion and channel migration in meandering rivers. Water Resources Research, 38, 1163. Gran, K., and Paola, C. 2001. Riparian vegetation controls on braided stream dynamics. Water Resources Research, 37, 3275-3283. Kleinhans, M.G. 2010. Sorting out river channel patterns, Progress in Physical Geography, accepted. Kleinhans, M.G., van Dijk, W.M., van de Lageweg, W.I., Hoendervoogt, R. 2010. From nature to lab: scaling selfformed meandering and braided rivers. Proc. River Flow 2010, Braunschweig, September. Parker, G. 1998. River meanders in a tray. Nature, 395, 111112. Pollen, N., Simon, A. and Collision, A.J.C. 2004. Advances in assessing the mechanical and hydrologic effects of riparian vegetation on streambank stability. Riparian Vegetation and Fluvial Geomorphology: Water Science and Applications, 8, 125–139. Pollen, N. 2007. Temporal and spatial variability in root reinforcement of streambanks: Accounting for soil shear strength and moisture. Catena, 69, 197-205. Rowntree, K.M. and Dollar, E.S.J. 1999. Vegetation controls on channel stability in the Bell river, Eastern cape, South Africa. Earth Surface Processes and Landforms, 24, 127-134. Simon, A., Curini, A., Darby, S., and Langendoen, E. 2000 Bank and near-bank processes in incised channels. Geomorphology, 35, 193-217. Simon, A. and Collison, A.J.C. 2002. Quantifying the mechanical and hydrologic effects of riparian vegetation on streambank stability. Earth Surface Processes and Landforms, 27, 527-546. Struiksma, N., Flokstra, C., Olesen, K.W., and De Vriend, H.J. 1985. Bed deformation in curved alluvial channels. Journal of Hydraulic Research, 23 (1), 57-79. Tal, M., Gran, K., Murray, A.B., Paola, C., and Hicks, D.M. 2004. Riparian vegetation as a primary control on channel characteristics in multi-thread rivers. In: Bennett, S. J. and Simon, A. Riparian Vegetation and Fluvial Geomorphology, Water Sci. Appl. Ser. 8, 43-58, AGU, Washington, D. C.. Tal, M. and Paola, C. 2007. Dynamic single-thread channels maintained by the interaction of flow and vegetation. Geology, 35, 347-350. 1338