Vol. 15: 45–59, 2000
CLIMATE RESEARCH Clim Res
Published May 15
Effects of silvicultural treatments on summer forest microclimate in southeastern Missouri Ozarks Daolan Zheng1, Jiquan Chen1,*, Bo Song 2, Ming Xu3, Phil Sneed 4, Randy Jensen4 1
School of Forestry and Wood Products, Michigan Technological University, Houghton, Michigan 49931, USA 2 Department of Forestry, University of Wisconsin-Madison, Madison, Wisconsin 53706, USA 3 Department of Environmental, University of California-Berkeley, Berkeley, California 94720, USA 4 Missouri Department of Conservation, Route 2, Box 198, Ellington, Missouri 63638, USA
ABSTRACT: The effects of silvicultural treatments (e.g., even-aged management, EAM, and unevenaged, UAM) on 4 microclimatic variables (air temperature, incoming solar radiation, humidity, and soil temperature) were examined in oak forests of southeastern Missouri Ozarks, USA. Nine mobile climatic stations were used to collect field data during the summers of 1995 (pre-harvest), and 1997 and 1998 (post-harvest). Spatial variation of air temperature at 2 m height increased 96 and 35% (2-year average) after harvest in UAM and EAM sites, respectively, as quantified by 95% confidence intervals (CI). UAM increased the variability of air temperature at the lower end of the daily range in the CI more than at the upper end, while EAM had a stronger effect on raising spatial variation at the upper end of the CI than at the lower end. Spatial variation of soil temperature within an 80 × 80 m grid increased significantly during daytime after harvest, especially at the surface, but did not change much during nighttime. EAM resulted in a larger increase of soil temperature variation than did UAM. Greater amplitudes of diurnal soil temperatures (especially at the surface) were observed at depths of 0, 5, and 10 cm and were more evident at the EAM site after harvest. The duration of variation in post-harvest soil surface temperature during daytime was about 3 times longer than pre-harvest at the EAM site. Spatial variation in radiation increased 56 and 128% in UAM and EAM sites after harvest, respectively. Except for radiation, significance levels of differences in means of microclimatic variables were reduced after harvest among the 3 Ecological Land Types (ELTs); the spatial variation of microclimate was smaller among ELTs within the same treatment than between treatments. Our results suggested that, usually, EAM affected the microclimate more than UAM did, especially in raising soil temperatures on northeast slopes (ELT18). KEY WORDS: Silvicultural treatments · Forest microclimate · Spatial variation · Ecological Land Types (ELTs) · Missouri Ozark Forest Ecosystem Project (MOFEP)
1. INTRODUCTION Climate is one of the most important environmental factors affecting ecosystem structure and function. While the effects of macroclimate dominate at broader temporal and spatial scales, microclimate directly influences ecological and biochemical processes of ecosystems at smaller scales (Campbell & Norman 1998, Waring & Running 1998). It is well known that microclimate is highly interactive with other ecosystem components such as plants, soils, and topography, and thus microclimate information is critical for evaluating *Corresponding author. E-mail:
[email protected] © Inter-Research 2000
ecosystem behavior. The sensitivity of the microclimate to timber harvesting can provide researchers and managers with the necessary information for understanding changes and functioning of ecosystems. In addition, microclimatic variables can be accurately measured and often used as first-hand information for ecological modeling, largely because of their direct or indirect influences on ecological processes such as seed germination, plant photosynthesis and growth, litter decomposition and respiration, plant mortality, and species invasion/extinction (Tromp 1980, Harmon et al. 1986, Fowells & Means 1990, Chen et al. 1992, Liechty et al. 1992, Buckley et al. 1998). For example, temperature, humidity, light, wind speed, and precipi-
46
Clim Res 15: 45–59, 2000
tation are widely used as driving variables for simulating plant water status and photosynthesis (Jones 1983, Zheng et al. 1993, Waring & Running 1998). Human and natural disturbances substantially alter the microclimate (Liechty et al. 1992, Brosofske et al. 1997, Chen et al. 1999b), and each of the microclimatic variables has unique spatial and temporal responses to changes in structural elements. For example, solar radiation and air and soil temperatures are highly sensitive to changes due to harvesting in the structure of the canopy, which functions as a physical barrier. As more sunlight reaches the ground, the range of ground surface temperatures increases and moisture regimes are altered. These changes further affect regeneration of trees (Hungerford & Babbitt 1987, Gray & Spies 1992, North et al. 1996, Buckley et al. 1998), species composition, regeneration, structure, and dynamics of vertebrate populations such as amphibians (Kelsey & West 1998). Increased light and moisture can also result in abundant growth of forbs, grasses, and shrubs, providing favorable habitat for some small mammals (Brookshire & Shifley 1997). The Missouri Ozark Forest Ecosystem Project (MOFEP), initiated by the Missouri Department of Conservation (MDC) in 1990, was designed as a longterm study on the effects of different forest management practices on ecological processes for forests in southeastern Missouri, USA (Brookshire & Hauser 1993, Brookshire et al. 1997). Nine study sites, each approximately 400 ha in size, were established to experimentally address the effects of even-aged and uneven-aged management scenarios in the Ozarks. Prior to harvest, each MOFEP site was in an even-aged condition or structure. This is a result of large-scale logging in the early part of the century, followed by intensive grazing and uncontrolled fire, until the land came under state ownership.
During the logging season of 1996, 2 different management practices were applied: even-aged and uneven-aged. Even-age management (EAM, i.e., clearcut) was implemented according to MDC (1986) Forest Land Management Guidelines (Management Level II). This was prescribed with a cutting rotation of 80 to 100 yr site–1, resulting in a regulated harvest of 10 to 12% of the trees per entry on a 10 yr re-entry period. At this management level, 10% of each site is left as ‘old growth’ and the desirable tree size class distribution on the remaining area is 10% seedlings, 20% small trees 6 to 14 cm diameter at breast height (dbh), 30% poles 14 to 29 cm dbh, and 40% saw timber > 29 cm dbh. Uneven-age management (UAM) was implemented using MDC’s (1986) Forest Land Management Guidelines with stand treatment following Law & Lorimer (1989). Approximately 10% of each site was designated to be managed as ‘old growth’ and the remaining 90% was available for UAM silvicultural treatment. Harvests on UAM sites were planned to coincide with harvests on EAM sites over the next 80 to 100 yr. The target tree size class distribution of UAM was identical to the composite size class distribution across the EAM sites. For example, for a mean pole timber diameter of 22 cm and saw timber diameter of 39 cm (midpoints of ranges, assuming 51 cm maximum), with both size classes at Blevel stocking, a typical EAM site would have 4.3 m2 of pole timber basal area and 6.7 m2 of saw timber basal area per hectare. In brief, at the clearcut site under EAM, all vegetation cover ≥ 5.1 cm dbh was removed following harvesting, creating a greater contrast within the landscape mosaic; while under UAM, harvesting consisted of single tree removal and group openings. Pre- and post-harvest conditions in this study are summarized in Table 1. An Ecological Land Type (ELT) is defined as an ecologically uniform area capable of a particular level of
Table 1. 1995 pre-harvest tree densities, basal areas, mean diameter at breast height (dbh), and canopy coverage on ridge tops (ELT11), southwest slopes (ELT17), and northeast slopes (ELT18) in UAM sites. Post-harvest measurements were taken for these ELTs in 1997 and 1998 in 0.2 ha sample plots Ecological Land Type (ELT) 11 (n = 19) 17 (n = 55) 18 (n = 46) EAM (n = 8) UAM (n = 24)
Trees ha–1 (SD) >3.8 cm dbh >11.4 cm dbh
Basal area (SD) (m2 ha–1) >3.8 cm dbh >11.4 cm dbh
Mean dbh (SD) (cm) >11.4 cm dbh
Canopy coverage (SD) (%)
1208 (239)
441 (81)
26.1 (3.1)
23.0 (2.5)
23.6 (10.1)
86 (5)
1267 (338)
401 (73)
23.6 (3.0)
20.2 (2.6)
23.1 (10.1)
88 (3)
1241 (365)
384 (76)
23.3 (2.7)
20.0 (2.6)
23.4 (10.7)
89 (4)
91 (133)
15 (15)
1.8 (0.9)
1.4 (1.2)
33.3 (13.2)
2 (3)
865 (208)
304 (69)
17.7 (2.8)
15.6 (3.0)
23.4 (10.2)
65 (9)
Zheng et al.: Silvicultural treatments and forest microclimate
47
Table 2. Summarized topographic and vegetation information for Ecological production or use and characterized Land Types (ELT) used in this study by regional landform, soil type, topographic aspect, slope steepness, and ELT Land form Aspect Slope (%) Soil series Vegetation community natural vegetation (Miller 1981, Lowell 1990). The study area includes 11 Ridge Neutral 0–8 Clarksville Dry chert forest 13 ELTs, of which ELT17, ELT18, and Coulstone ELT11 make up 85% of the total area Poynor (Table 2). Brookshire and Shifley Doniphan (1997) provided a comprehensive de17 Side South 8–99 Clarksville Dry chert forest slope and Coulstone scription of pretreatment conditions West Poynor for the MOFEP. They concluded that Doniphan the production of sound, mature Ocie acorns, dbh of oak trees, and mean 18 Side North 8–99 Clarksville Dry-mesic chert forest canopy area of oak trees differed sigslope and Coulstone nificantly among ELT (Vangilder East Poynor Dry-mesic sand forest Doniphan 1997). The spatial variation of air temOcie perature (1 m) and soil surface temperature was inversely related to the species diversity of the ground flora (Xu et al. 1997a). The numbers, mass, and 2. STUDY AREA richness of arthropod leaf litter communities were significantly higher on northeast than on southwest facing MOFEP consists of 9 study sites, located in Carter, plots, while the Simpson’s index of diversity was sigReynolds, and Shannon counties in the southeastern nificantly lower on northeast facing plots (Weaver & Missouri Ozarks (91.16° to 91.22° W and 37° to 37.2° N) Heyman 1997). (Fig. 1). These counties are 84% forested with large Previous microclimatic studies within MOFEP contiguous blocks separated only by roads and streams focused on temporal and spatial variability as well as (Spencer et al. 1992). Dominant species include: black changes in mean values between open and closed oak Quercus velutina Lam., white oak Quercus alba L., canopy areas (Chen et al. 1997). Xu et al. (1997a) scarlet oak Quercus coccinea Muenchh., post oak examined the variability of air and soil temperatures Quercus stellata Wangenh., hickories Carya spp., and and their relationships with decomposition and shortleaf pine Pinus echinata Mill. Understory species ground flora diversity at multiple scales. These studinclude dogwood Cornus spp. and blackgum Nyssa ies provided quantitative summaries of microclimate sylvatica Marsh. Soils in this area were formed mostly in the forested landscape of the Ozarks and indicated in residuum. The common series are Viburnum, that variability in microclimate deserves more attenMidco, Gepp, Bardley, Viraton, Poynor, and Clarksville tion, especially at small scales; in particular, the vari(Brookshire & Hauser 1993). Mean annual temperature ability of microclimatic response to changes in landand precipitation are 13.3°C and 1120 mm, respecscape structure is not fully understood. Evaluating the tively (Barnton 1993). The majority (92%) of the landinfluence of management treatments on microclimatic scape is < 300 m in elevation. More than 99% of the variation and monitoring long-term microclimate are area has a slope < 40% and is evenly distributed essential for improving our understanding and effecamong aspect categories. Up to 31% of the landscape tiveness in managing forest resources. In this study, is within riparian zones (Chen et al. 1999a). Road and we examined the growing season diurnal variability stream densities in the area are 1.4 km km–2 and of microclimate associated with alternative silvicultural treatments in a Missouri Ozarks oak forest. We 1.7 km km–2, respectively (Xu et al. 1997b, Chen et al. sought to determine whether alternative manage1999a). ment practices (i.e., EAM vs UAM) would create significant differences in microclimatic variables among ELTs that are common to the region. Our objectives 3. METHODS were (1) to quantify differences in and the magnitude of spatial variation of microclimatic characteristics Long-term climatic data were collected by installing caused by management practices in Ozark forests, 2 permanent weather stations in June 1995: one in and (2) to examine the microclimatic differences an open glade and the other under closed canopy. caused by harvesting (i.e., pre- and post-harvesting) Eighteen climatic variables were observed at these in the 3 dominant ELTs (11, 17, 18). permanent stations (Chen et al. 1997). These stations
48
Clim Res 15: 45–59, 2000
11
EAM
19 17
18 11
17
11 18
18
19
18
19
17
5
18
17
17 5
18
11
17 18
17 18
17 17 20
19 5
18
18 11 17
UAM
18 5
18
17 18 17
17
18 18 17
11
17 18
18
17
11 17 18
18
19
17
11
19 18 5
19
17
17
18
5
19 5
19
0
1000
N
2000 meters
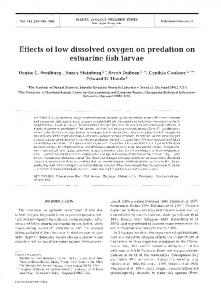
provide continuous local climatic data that can be used for calculation of missing data at mobile stations caused by human and natural disturbances. Nine mobile climatic stations were developed in 1995, recording air temperature (°C) at 2 m height, relative humidity (%) at 2 m height, solar radiation (KW m–2) at 2 m height, wind speed (m s–1) at 2 m, and soil temperatures (°C) at 0, 5, and 10 cm depths. CR10 data loggers were programmed to sample every 10 s and average data every 20 or 30 min for final storage. Air temperature and relative humidity were measured with the 207 PhysChem probes (Campbell Scientific, Inc., CSI, UT), which were housed inside a 12-plate radiation shield. Sensors were updated to HMP45C probes in 1998. Solar radiation was measured with LI200S silicon pyranometers (400 to 1100 µm, Li-Cor Company, NE), wind speed with the Model 12102 Gill 3-cup anemometers (R. M. Young Company, MI). Custom-built fine-wire thermocouples (using 3-stranded 32-gauge wires) were used to measure soil temperature at 0, 5, and 10 cm depths. For measurement of soil surface temperature, the thermocouples were inserted under the litter layer. Results on wind speed are not included in this paper because we feel the starting speed of the cup anemometers is too high (0.2 m s–1) to record the air flow in the forest and the dimensions of the postharvest stand are too small (i.e., small fetch). Commercial timber harvests began on MOFEP sites in early May 1996 and concluded in November 1996. We collected microclimatic data in the summer of 1995 before harvest and continued measurements following harvest during the summers of 1997 and 1998. Trees were cut with chainsaws and removed from the forest by rubber tire skidders that dragged the trees by utilizing a winch and cable system. At EAM sites, 41 ha were clearcut in 6 stands, with a mean size of 6.8 ha and a range of 4.9 to 10.1 ha. This study focuses on effects on air and soil temperatures and solar radiation induced from 2 different treatments (EAM vs UEM). Relative and absolute humidity analyses are presented only for 1998 due to poor data quality in 1995 and 1997. The absolute humidity was calculated using simultaneous temperature and relative humidity measurements and based on equations provided by Campbell (1977) and Lowe (1977). Two microclimatic studies were carried out at the UAM and EAM sites during the summers of 1995, Fig. 1. The study area is located in the southeast Missouri Ozarks. Nine mobile climatic stations were used in this study at an even-aged and an uneven-aged harvest site located within the MOFEP study during summers of 1995–98. Points are geographic locations of microclimatic stations within each harvest unit determined using a GPS unit. Numbers are Ecological Land Types (ELTs) used in this region (see Miller 1981, Lowell 1990)
Zheng et al.: Silvicultural treatments and forest microclimate
1997, and 1998. The first one examined fine-scale (80 × 80 m rectangle grid) spatial variability within ELT17 using 9 mobile stations, where the stands were dominated by black and scarlet oaks on medium slopes and with homogeneous canopy pre-harvest. The interval between stations was 40 m in each of the cardinal directions. The stations were left at each site for 2 to 3 wk. The goal of this experiment was to test whether temperature varied significantly within the same ELT and whether logging activity altered microclimatic means and variance. The second experiment was designed to compare microclimatic differences among the 3 most abundant ELTs (11, 17, 18) with 3 mobile stations in each ELT. This experiment was designed to monitor microclimatic variability induced from terrain aspects within the same silvicultural treatment. Consequently, the overall effects of alternative management practices on microclimate can be assessed by comparing post-harvest with pre-harvest data at the same locations. In this study, data collected in 1995 and 1997 were from the same location for each of the 9 stations. The exact locations could not be identified in 1998 due to alteration of overstory and growth of understory, but sampling locations were mapped on a high-resolution topographic map (i.e., enlarged 7.5’ USGS quadrant) in 1995 and were very close to the original points. To quantify the variation of microclimatic variables within an 80 × 80 m grid and compare among the data collected in multiple years and different time periods (Table 3), our 30 min data were standardized by subtracting from the means of 9 measurements, i.e., n
∆Xti = Xti − ∑ Xti /n i =1
Table 3. Field data summaries for microclimatic measurement in the summers of 1995, 1997, and 1998 at the 2 treatment sites in the Missouri Ozarks. V = variation study within an 80 × 80 m grid; C = comparison study among Ecological Land Types (ELTs); EAM = even-aged management; UAM = uneven-aged management Year
Expt
Site
Duration
No. of stations
1995 1995 1995 1995 1997 1997 1997 1997 1998 1998 1998 1998
V C V C V C V C C V C V
EAM EAM UAM UAM EAM EAM UAM UAM UAM UAM EAM EAM
30 Jun–14 Jul 14 Jul–28 Jul 28 Jul–11 Aug 11 Aug–25 Aug 15 Jun–3 Jul 3 Jul–20 Jul 21 Jul–16 Aug 16 Aug–29 Aug 2 Jun–23 Jun 23 Jun–14 Aug 14 Jul–4 Aug 4 Aug–25 Aug
9 9 9 9 9 9 8 9 8 9 8 9
49
where ∆Xti is the standardized microclimatic variable of Stn i at time t, Xti is the measurement at Stn i at time t, and n is the total number of stations (n = 9). This method was applied for all variables, which are denoted throughout this paper as: air temperature (∆Ta), soil temperature (∆Ts), solar radiation (∆R t), relative humidity (∆h), and absolute humidity (∆h). A 95% confidence interval (CI) envelope was calculated for every 30 min period and used to present the diurnal changes of each microclimatic variable. t-tests were applied to explore the significance levels among the 3 ELTs.
4. RESULTS 4.1. Effects of silvicultural treatment 4.1.1. Air temperature (Ta) The 95% CI of instantaneous air temperature variation (∆Ta) during the day in 1995 (pre-harvest) ranged from ± 0.21 to ± 0.85°C at the UAM site. The diurnal value of ∆Ta was lower in the early morning (08:00 h) and highest in the afternoon between 16:00 and 17:00 h (Fig. 2). Multiple peaks of variation were identified, with higher spatial variation recorded between 20:00 and 21:00 h. Following the harvest, the lowest ∆Ta in 1997 was observed in the early evening, at 18:00 h, while the highest variation occurred near 16:00 h. The lower limit of the daily range of the CI increased from ± 0.21 to ± 0.49°C (133%), and the upper limit of the CI increased from ± 0.85 to ±1.4°C (63%). The timing for occurrence of the highest and lowest ∆Ta in 1997 remained the same as that in 1995. The timing for the lowest ∆Ta in 1998 was between 17:00 and 18:00 h, while the highest variation was between 22:00 and 23:00 h. The range of the CI indicated that the highest ∆Ta in 1998 increased to ±1.2°C (41%) compared to that in 1995 (± 0.85°C), but less than the amount of increase in 1997 (1.4°C). The lowest ∆Ta in 1998 increased to ± 0.52°C (148%) compared to 1995. At the EAM site, pre-harvest ∆Ta was relatively stable over the day (Fig. 2). The lowest variation of air temperature occurred between 08:00 and 09:00 h (± 0.42°C). Higher ∆Ta values were recorded at 14:00 (± 0.76) and 21:00 h (± 0.77°C). In the first year postharvest, low ∆Ta occurred around mid-afternoon (± 0.42°C) and early morning (± 0.43°C). The highest ∆Ta was observed at 07:00 h after sunrise (±1.2°C, 58% increase). In 1998, the highest ∆Ta was still observed between 08:00 and 09:00 h in the morning (±1.3°C, 71% increase), but the lowest ∆Ta occurred at 16:00 h (± 0.46°C, 9% increase). Statistical analysis suggested that ∆Ta was significantly different between pre- and
50
Clim Res 15: 45–59, 2000
UAM site. ∆h increased after 18:30 h and reached its highest value between 22:00 and 23:00 h (± 7.2%, Fig. 3). To eliminate the inverse relationship between h and Ta , we calculated absolute humidity (Ah). Our results indicated the diurnal pattern of ∆Ah fluctuated less than that of ∆h (Fig. 3). At the EAM site, the lowest ∆h was observed at 12:00 h (± 2%). The highest ∆h occurred between 20:00 and 21:00 h with ± 6% in the late afternoon. The differences between the maximum and minimum ∆h were about 5% at the UAM site and 4% at the EAM site. On average, ∆h was smaller at the EAM site. The diurnal patterns of ∆h at the 2 sites were not the same. There was a singlepeak pattern at UAM site, but twin peaks at EAM site. The diurnal patterns of ∆Ah were similar for the 2 sites but the EAM site had a broader range of variation than that at the UAM site.
4.1.3. Solar radiation (R t )
Fig. 2. Diurnal changes in standardized variations of air temperature (°C) within an 80 × 80 m grid in the study area during the summers of 1995 (pre-harvest), 1997 and 1998 (post-harvest) at uneven- (UAM) and even-aged (EAM) sites with ranges of the 95% confidence interval (CI)
post-harvest (p < 0.05). Increases of 96 and 35% were detected at the UAM and EAM sites after harvest, respectively. However, the diurnal changes of ∆Ta and its variations in 1998 were similar to those in 1997 at both sites (Fig. 2).
4.1.2. Humidity (h and Ah) As predicted, a reversed diurnal pattern of relative humidity (h) and humidity variation (∆h) to that of air temperature was detected in 1998 since there were inverse relationships between the 2 variables (with r2 values of 0.82 and 0.86 for the UAM and EAM sites, respectively). The low ∆h occurred at 10:00 h (± 2.2%) and remained relatively unchanged until 18:30 h at the
The influence of harvesting on the spatial variation of solar radiation (∆R t) was limited to daytime. The highest pre-harvest ∆R t was ± 0.25 W m–2 around noon. The highest ∆R t increased to ± 0.39 and ± 0.57 W m–2 with an average increase of 92% at the UAM site after harvest. At the EAM site, the highest ∆R t was ± 0.34 W m–2 in 1995 and increased to ±1.2 W m–2 in 1997 and ± 0.5 W m–2 in 1998, with an average increase of 150%. Higher values of ∆R t occurred in the first year after harvest shortly after sunrise and before sunset when sun angles were low (Fig. 4).
4.1.4. Soil temperature (Ts) At the UAM site in 1995, the lowest range of daily CI for the spatial variation of soil temperature (∆Ts) was ± 3.1°C at 01:00 h (Fig. 5), more than 14-fold greater than that of ∆Ta. The highest ∆Ts0 occurred between 09:00 and 10:00 h with ± 5.6°C, about a 7-fold increase compared to that of ∆Ta. Pre-harvest ∆Ts0, ∆Ts5, and ∆Ts10 (i.e., at 0, 5, and 10 cm depth, respectively) were relatively stable for most times of the day. No significant difference was detected between 23:00 and 07:00 h among temperatures at the 3 depths (Fig. 5). The diurnal difference between the maximum and minimum Ts0 was 6.3°C, but the equivalent for Ts5 and Ts10 was less than 3°C (Fig. 5). The time lag to reach the
Zheng et al.: Silvicultural treatments and forest microclimate
51
Fig. 3. Diurnal changes (with 95% CI) of standardized variations of relative humidity (%) and absolute humidity (g m– 3) within an 80 × 80 m grid in the study area during summer 1998 at uneven- and even-aged sites
maximum soil temperature increased with an increase in soil depth. Ts0 reached its maximum around 15:00 h and its minimum around 06:00 h. Post-harvest ∆Ts0 between 18:00 and 06:00 h was minimal (± 0.6°C) but increased after sunrise and reached the maximum around noon with the broadest range of CI (± 6.6°C) at the UAM site in 1997. Diurnal fluctuations of ∆Ts post-harvest were much greater during the daytime, but smaller during the nighttime than pre-harvest. The difference between maximum and minimum Ts0 was about 13°C in 1997 (106% increase) (Fig. 6). The time lags to reach the maximum temperatures at 3 soil depths reduced after harvest. In 1995, the temperature ranges were 21.2–27.6, 21.3–23.4, and 21.4–22.4°C for Ts0, Ts5, and Ts10, respectively; the ranges increased to 19.5–32.2, 21.4–25.7, and 21.7–24.3°C in 1997. The diurnal patterns of soil temperature variation (∆Ts) in 1998 were similar to those in 1997 at all 3 depths. The minimum Ts0 occurred around 06:00 h (22°C) and reached the maximum near noon (34°C) (Fig. 6). Our results suggested that harvesting had little effect on ∆Ts at night, but significant effects during the day at all 3 depths. At the EAM site, pre-harvest ∆Ts remained almost constant between 20:00 and 07:00 h (± 2.6°C) and reached highest ∆Ts (±10.3°C) around noon (Fig. 5). The diurnal patterns of ∆Ts were similar at all 3 depths
but the range of extremes decreased with an increase in soil depth. Amplitude of daily Ts0 ranged from 18.7 to 24.8°C, while amplitudes of ∆Ts5 and ∆Ts10 decreased to 2.5°C and