Oct 15, 2010 - et du gradient thermique sur les valeurs du psychrome`tre et le dйveloppement d'un protocole de calibrage tenant compte de ces effets. A cette ...
Abuel-Naga, H. M. & Bouazza, A. Ge´otechnique [doi: 10.1680/geot.9.P.102]
Effects of temperature and thermal gradient on thermocouple psychrometer measurements H . M . A B U E L - NAG A � a n d A . B O UA Z Z A † La pre´sente communication pre´sente les re´sultats d’une e´tude dont le but e´tait d’e´valuer l’effet de la tempe´rature et du gradient thermique sur les valeurs du psychrome`tre et le de´veloppement d’un protocole de calibrage tenant compte de ces effets. A cette fin, on a mene´ un programme intensif de calibrage a` diffe´rentes tempe´ratures (20–358C) et des niveaux d’eau potentiels (de 0,0 a` 7,0 MPa). On a exprime´ le gradient thermique comme diffe´rence de tempe´rature entre des jonctions humides et se`ches dans le de´tecteur du psychrome`tre a` thermocouple. Les donne´es de calibrage releve´es ont e´te´ utilise´es pour construire un mode`le de psychrome`tre a` re´seau de neurones artificiel. Le mode`le cre´e´ e´tait en mesure de simuler correctement la sortie du psychrome`tre en pre´sence de diffe´rentes conditions, et a e´te´ utilise´ pour effectuer une e´tude parame´trique de´taille´e pour e´valuer l’influence de la tempe´rature et du gradient thermique sur les mesures du psychrome`tre a` thermocouple. La conclusion de cette e´tude de´montre l’importance de l’inte´gration de l’effet de la tempe´rature et du gradient thermique dans le processus de calibrage standard. En outre, elle introduit un nouveau protocole de calibrage pre´cis tenant compte du principe du re´seau de neurones artificiel.
This paper presents the results of a study aimed at assessing the effects of temperature and thermal gradient on psychrometer readings, and at developing a calibration protocol that takes into account these effects. An intensive calibration programme was conducted at different temperatures (20–358C) and water potential levels (0.0 to ,7.0 MPa), for this purpose. The thermal gradient was expressed as the difference in temperature between wet and dry junctions in the thermocouple psychrometer sensor. The collected calibration data were used to build an artificial neural network psychrometer model. The developed model was able to simulate successfully the psychrometer output at different conditions, and was used to conduct a detailed parametric study to evaluate the influence of temperature and thermal gradient on thermocouple psychrometer measurements. The outcome of this study shows the importance of including the effects of temperature and thermal gradient in the standard calibration process. Moreover, it introduces a new, precise calibration protocol that takes advantage of the artificial neural network approach. KEYWORDS: monitoring; neural networks; partial saturation; suction; temperature effects
INTRODUCTION Soil suction is a fundamental physical property of unsaturated soils (Fredlund & Rahardjo, 1993; Delage, 2002). It describes the potential of a soil at a given water content to adsorb and hold pore water. Soil suction comprises two components: matric and osmotic suctions. The former is associated with the interparticle capillary menisci and the particle surface hydration mechanism, whereas the latter is related to the chemical potential of pore water. The constitutive relation between soil suction and retained moisture content is described by the soil-water characteristic curve (Fredlund & Rahardjo, 1993). One of the challenges in unsaturated geomaterials research is the measurement of suction (Ridley & Wray, 1996; Delage, 2002; Agus & Schanz, 2005; Rahardjo & Leong, 2006; Bouazza et al., 2006a, 2006b; Nahlawi et al., 2007; Delage et al., 2008). Several methods are available to measure soil suction, or its components. A comprehensive review of these methods, and their range of applicability and limitations, can be found in Rahardjo & Leong (2006) and Delage et al. (2008). A range of devices are available that can be used to determine the total suction in soils, based on relative humid-
ity measurements (Brown, 1970; Hamilton et al., 1979; Fredlund & Rahardjo, 1993; Weiderhold, 1997). One of these devices is the thermocouple psychrometer (Peltier type: Spanner, 1951), which can measure soil suctions up to ,8.0 MPa, and has been widely used over the past two decades (e.g. Peterson, 1988; Ridley & Wray, 1996; Blatz et al., 1999; Gee & Ward, 2000; Blatz & Graham, 2000; Dixon et al., 2002; Agus & Schanz, 2005). The main concern with this device is its high sensitivity to temperature fluctuations (Krahn & Fredlund, 1972; Merrill & Rawlins, 1972; McBurney, 1988; Fredlund & Rahardjo, 1988; Ridley, 1993; Oosterhuis, 2002; Leong et al., 2003). Failure to understand or adequately quantify the temperature effects can seriously influence the accuracy of psychrometer measurements (Agus & Schanz, 2007). Abuel-Naga & Bouazza (2010) have developed a novel triaxial cell for testing the water retention curve of geosynthetics clay liners (GCLs). GCLs are typically composed of ,10 mm of bentonite, sealed between two synthetic geotextiles, with the components being held together by needlepunching or stitch bonding (Bouazza, 2002). This new cell involves controlling the water content of the sample and measuring its volume change and total suction. As there is no suction sensor that can measure the whole suction range of GCLs, two total suction measurement techniques have been utilised: a thermocouple psychrometer for the lower total suction range, and a relative humidity sensor for the higher range. As the thermocouple psychrometer is known for its high sensitivity to temperature, this study was conducted to investigate the effects of temperature and thermal gradient on the psychrometer measurements, and to develop a calibration protocol that considers both effects.
Manuscript received 17 August 2009; revised manuscript accepted 15 October 2010. Discussion on this paper is welcomed by the editor. � Department of Civil and Environmental Engineering, University of Auckland, New Zealand. † Department of Civil Engineering, Monash University, Melbourne, Australia.
1 Delivered by ICEVirtualLibrary.com to: IP: 130.216.12.217 On: Fri, 15 Apr 2011 03:24:53
ABUEL-NAGA AND BOUAZZA
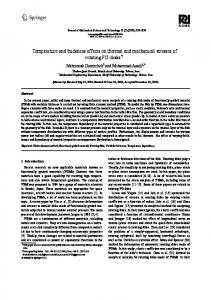
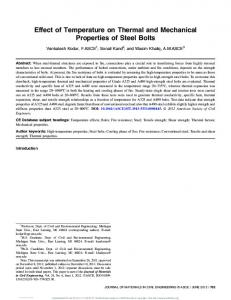
BACKGROUND Thermocouple psychrometer theory The thermocouple psychrometer method allows accurate determination of water potential, provided vapour and thermal equilibrium exists between the tested sample and the psychrometer. A typical thermocouple psychrometer consists of a sensing thermocouple (wet junction; constantan– chromel) and a reference thermocouple (dry junction; copper–constantan) that is protected by a stainless steel housing, as shown in Fig. 1(a). The working principle of a thermocouple psychrometer is based on the physical phenomenon called the Peltier effect (Spanner, 1951). This effect involves passing an electrical current through the wet junction to cool it below the dew-point temperature, resulting in condensation of water from air onto that junction. When the current generating the Peltier effect stops flowing, the water condensed on the junction evaporates and cools down this junction. The temperature depression between the wet junction and the dry junction caused by condensed water film evaporation is observed as the wet-bulb voltage drop, ˜T ¼ Tw � Td , where Tw and Td are the temperatures of the wet and dry junctions respectively. The temperature of the dry junction represents the ambient air temperature. It is common to present the psychrometer output in microvolts (�V) rather than convert it into a temperature. Figure 2 provides an idealised schematic diagram of ˜T recorded during psychrometer measurements. The term ˜To represents the difference between Tw and Td before the start of the cooling stage. Such a value can be used to give an indication of the presence of a thermal gradient in the measuring zone, and is usually referred to as ‘zero-offset’. A positive zero-offset indicates that the sensing junction is cooler than the reference junction, a negative zero-offset that it is warmer. As depicted in Fig. 2, at the end of the cooling stage the psychrometer microvolt output ˜T shows a plateau region where it does not change with time. This represents the stage where the evaporation of water from the wet junction has reached a steady state with the relative humidity of the air in the sensor chamber. It lasts until all the water condensed on the wet junction has evaporated, and the temperature of the wet junction has returned to ambient. The recorded psychrometer microvolt output ˜T at the plateau region temperature will be referred to as ˜Twb . In practice,
Measurement start ∆T: µV Evaporation stage
Cooling /condensation stage
2
ΔTwb
Plateau
Time
ΔTo
Fig. 2. Typical wet-bulb depression output during psychrometer measurement
˜Twb is an explicit function of the relative humidity and hence of the water potential �. Influence of temperature and thermal gradient As ˜Twb represents an evaporative cooling signal, it can be affected by the temperature of the testing environment. At higher temperatures a larger signal is expected, since a larger diffusion gradient for evaporation will be generated. To account for this behaviour, it is often standard practice to calibrate the thermocouple psychrometer at a given temperature (usually 258C), and to convert readings taken at different temperatures to the equivalent readings at 258C. Brown (1970) introduced a simple linear equation for this conversion process, which has been adopted in some psychrometer manufacturers’ recommendations. However, Savage et al. (1982), Kauraw & Gupta (1985) and Comstock (2000) have questioned the validity of this simple relationship, and have shown that it can be affected by the actual water potential level and the details of the psychrometer construction. The effect of the thermal gradient on the psychrometer results has also attracted the extensive attention of research-
Heat conduction direction along psychrometer wires Epoxy resin
Chromel
Constantan
Stainless steel screen cap
Reference junction cooler than sensing junction
Reference/dry junction
TL � T
Constantan
TL � T
Copper
Sensing junction cooler than reference junction
Teflon
Sensing/wet junction
(a)
(b)
Fig. 1. (a) Schematic diagram of thermo-couple psychrometer; (b) thermal gradient direction due to difference between laboratory and calibration chamber temperature
Delivered by ICEVirtualLibrary.com to: IP: 130.216.12.217 On: Fri, 15 Apr 2011 03:24:53
TEMPERATURE AND THERMAL GRADIENT EFFECTS ON PSYCHROMETER MEASUREMENTS ers in botany and soil science (Rawlins & Dalton, 1967; Merrill & Rawlins, 1972; Michel, 1979; Campbell, 1979; Brown & Bartos, 1982; Dixon & Tyree, 1984; Shackel, 1984; Vanderchmitt & Daudet, 1994). Moreover, some theoretical correction factors have been proposed for this purpose. Wiebe & Prosser (1977), Michel (1979) and Shackel (1984) have suggested that each 1.0 �V of zero-offset can produce an error in the water potential measurement that may vary between 0.175 and 1.03 MPa. Michel (1977) recommended that a zero-offset voltage of less than 1.0 �V permits accuracy without correction. However, a 0.3 �V zero-offset was tolerated only by Brown & Tanner (1981). The zero-offset tolerance approach has been adopted in most manufacturers’ recommendations, but with different zero-offset microvolt thresholds. For instance, Wescor (1979) suggested that the magnitude of the zero-offset should be , 3.0 �V for a meaningful water potential measurement. Therefore it appears that there is no consensus as to what value of zerooffset results in an unacceptable water potential measurement. Based on the above discussion, it is proposed that two corrections should be used for psychrometer measurements, to compensate not only for the effect of temperature but also for the effect of thermal gradients. In geotechnical research, most researchers who have used a psychrometer as a suction measurement method in their study have acknowledged the application of psychrometer temperature correction, and in most cases have referred to the Brown (1970) approach to the correction (e.g. Peterson, 1988; Wang et al., 1995; Blatz & Graham, 2000; Tang et al., 2002; Bulut et al., 2005; Bulut & Leong, 2008). Recently, Thom et al. (2007) adopted Comstock’s (2000) approach to conduct the psychrometer temperature correction in their study. To the best of the authors’ knowledge, thermal gradient correction has not been taken into account in any geotechnical studies. However, Agus & Schanz (2005) reported the existence of a zero-offset between 0.39 and 4.19 �V in their psychrometer measurements. Moreover, they stated that a limiting value of zero-offset of 1 �V was ensured for the internal isothermal equilibrium within the psychrometer. Wang et al. (1995) blamed a thermally induced water vapour gradient for unsatisfactory psychrometer readings. It is obvious that a rigorous investigation is urgently needed into the effect of temperature and thermal gradients on psychrometer measurements, and how to correct their influence. This paper is aimed at fulfilling this need through a precise psychrometer calibration programme, and analysis of the collected calibration data using an artificial neural network (ANN) approach. The developed ANN model can be exploited to understand the sensitivity of the psychrometer measurements to temperature and thermal gradient effects. Moreover, it can also be used to discuss the applicability of the available temperature and thermal gradient correction forms that are usually used in psychrometer measurement practice (Brown, 1970; Michel, 1979; Comstock, 2000). PROPOSED THERMOCOUPLE PSYCHROMETER CALIBRATION PROTOCOL Calibration tools The calibration tools of the proposed protocol comprise three items: a calibration chamber, a temperature-controlled water bath, and standard salt solutions of known water potentials. The calibration chambers should be equipped with sealed connection access for the psychrometer. The temperature-controlled water bath should have a temperature stability of �0.18C or better. Sodium chloride (NaCl) solutions at different molalities or saturated salt solutions can be
3
used as water potential standards (Delage et al., 1998). However, solutions of NaCl are recommended for this purpose, as its water potential standard (Lang, 1967) is widely accepted (Delage et al., 1998). At least five different molalities of sodium chloride solutions should be used to cover the water potential measuring range of the thermocouple psychrometer (0–8 MPa).
Calibration programme The psychrometer calibration programme involves monitoring the psychrometer output (˜To, ˜Twb ) at different predetermined temperatures (T) and water potential levels (�). The selected temperature range should cover the temperature environment where the psychrometer will be used. The psychrometer behaviour should be investigated at no less than four temperature levels in order to accumulate enough data for the calibration analysis purposes. As ˜To is difficult to control, and varies even under the provided thermal stability conditions, its effect on the psychrometer readings can observed by collecting several readings at constant temperature and water potential conditions for one to two days at reading intervals between 4 and 6 h. The source of the induced thermal gradient in the temperaturecontrolled water bath can be attributed to: (a) the level of temperature stability that can be obtained by the thermostat system used; and (b) the possible effects of heat conduction along the psychrometer wires into the calibration chamber, caused by the difference between the temperature of the water bath (T) and the temperature of the laboratory (TL ), as shown in Fig. 1(b) (Brown & Bartos, 1982). The calibration process should start with the lowest temperature. The heating path is chosen to avoid condensation problems during the cooling phase which can slow down the vapour-pressure equilibrium process. At the end of each measurement set for a given calibration salt solution, at different temperature levels, the calibration chamber should be opened and inspected for leakage, and the psychrometer sensor should be rinsed in distilled water and dried using a jet of dry air before using it in another calibration chamber.
Data analysis The data collected by the calibration programme should be used to build a statistical constitutive model that can describe the relation between the psychrometer output and the water potential under different temperature conditions. Several statistical approaches can be used for this purpose. However, the ANN approach is recommended in this study, as it has been successfully applied across an extraordinary range of problem domains, in areas as diverse as finance, medicine, engineering, geology and physics. Recently, ANNs have been successfully applied to many applications in geotechnical engineering to capture multivariate non-linear interactions between various soil system parameters (e.g. Abu Kiefa, 1998; Juang et al., 2001; Goh et al., 2005; Hanna et al., 2007). Several ANN architectures and learning paradigms have been developed over the past few years. A supervised ANN model called backpropagation (BP) is recommended in this study. It was originally formalised by Werbos (1974), and later by Parker (1985) and Rumelhart & McClelland (1986). It consists of an interconnected group of artificial neurons, and processes information using a connectionist approach to produce an output from given inputs. The neurons are connected by weights, which are applied to values passed from one neuron to the next. A group of neurons is called a layer. The network consists of the input layer, output layer,
Delivered by ICEVirtualLibrary.com to: IP: 130.216.12.217 On: Fri, 15 Apr 2011 03:24:53
ABUEL-NAGA AND BOUAZZA
4
and at least one hidden layer, with feed-forward connection as shown in Fig. 3. The BP learning process involves providing the network with a set of training patterns that include inputs and targeted outputs, so that the network can adjust its weights to matching its outputs to the target values. The BP weights adjustment approach localises the error by computing it at the output layer, and backpropagating the error such that the weights of connection are adjusted until the input layer is reached. Training is carried out repeatedly until the average sum squared error over all the training patterns is minimised, and is within the tolerance specified for the problem. PSYCHROMETER CALIBRATION TEST The commercially available PSYPRO unit (Wescor, Logan, UT) with a stainless steel shielded Peltier-cooled thermocouple psychrometer sensor (PST-55) was calibrated in this study using the proposed calibration protocol. The stainless steel shield of the PST-55 sensor has a large pore size, which can accelerate the equilibrium process. The psychrometer calibration programme involves monitoring the psychrometer output (˜To, ˜Twb ) at different predetermined temperatures, T (20, 25, 30, 358C) and water potential levels (�) induced by NaCl solutions at five different molalities (0, 0.2, 0.5, 1.0 and 1.5). The water potential of NaCl solutions at these molalities and the temperature effect on these values are listed in Table 1 (Lang, 1967). The psychrometer sensor was suspended in a sealed calibration chamber, loaded with a known concentration of NaCl solution. Then the entire assembly was submerged in a thermostat water bath with a temperature stability of �0.18C. Different calibration chambers were used for each reference NaCl solution. The laboratory temperature was 28 � 18C. Thermal equilibrium between the calibration chamber and the water bath was achieved within 10 to 20 min, but a longer period (up to 4 h) was required before vapourequilibrium pressure could occur. At each constant temperature (T) and water potential (�) condition, psychrometer readings (˜To, ˜Twb ) were collected for one to two days at reading intervals between 4 and 6 h in order to observe the zero-offset fluctuation.
Output layer
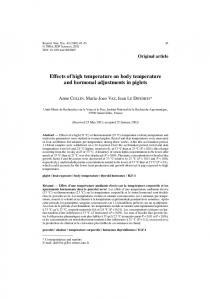
Calibration data The calibration process conducted at different temperature and water potential levels produced 280 sets of measurements (�, T, ˜To, ˜Twb ). Table 2 shows the range of the different parameters collected during the calibration process. A typical psychrometer reading set is shown in Fig. 4, for which an NaCl solution of 0.2 molality was used. This salt solution can generate water potentials between �0.9 and �0.946 MPa as the temperature increases from 208C to 358C, as listed in Table 1. The behaviour of the psychrometer readings (˜To, ˜Twb ) shown in Fig. 4 can be explained by breaking the psychrometer readings down into segments, based on the different temperature levels, and finding out how these readings can be interpreted and related to each other under the imposed constant temperature and water potential condition. The grey zones in Fig. 4 (segments a–b, c–d and e–f) represent the transition periods between the different temperature levels. In these zones it can be observed that both ˜To and ˜Twb decrease as the temperature level increases, as shown in Figs 4(b) and 4(c), respectively. However, the response of ˜To is instantaneous, as shown in Fig. 4(b), whereas some delay is observed with ˜Twb as it reaches a new state of water vapour equilibrium when the temperature level increases, as shown in Fig. 4(c). Moreover, when the water bath temperature (T) is less than the laboratory temperature (TL ¼ 28 � 18C), the average ˜To of each temperature level, which is plotted as a dashed line in Fig. 4(b), is positive; it decreases as T increases, and becomes negative when T ¼ 358C (i.e. T . TL ). As discussed earlier, positive zero-offsets indicate that the sensing junction is cooler than the reference junction, and negative zero-offsets that it is warmer. Such a link between (TL –T) and ˜To supports the suggested effects of heat conduction along the psychrometer wires into the calibration chamber due to the difference in temperature between the water bath and the laboratory room, as shown in Fig. 1(b). So it is believed that with such a manipulation, which involves adjusting the temperature level (T) relative to the laboratory temperature (TL ), the magnitude and direction of the temperature gradient could be roughly controlled. Finally, the psychrometer readings indicate a direct relation between ˜To and ˜Twb, as shown in Figs 4(b) and 4(c).
Hidden layer
Error adjustment
Learning
Table 2. Range of ANN database
Min Max. Mean Std dev.
T: 8C
Zero-offset: �V
�: MPa
˜Twb : �V
20.4 35.48 28.71 5.30
�6.75� 11.45� 3.41 3.38
�7.41 0 �3.36 2.42
0 35.74 14.41 9.86
� �0.112 to 0.1918C (chromel-constantan thermocouple ¼ 60 �V/8C).
Input layer Neuron
Fig. 3. Structure of backpropagation ANN
Table 1. Water potential (MPa) of NaCl solutions (Lang, 1967) Molality 0. 2 0. 5 1. 0 1. 5
208C
258C
308C
358C
�0.9 �2.241 �4.55 �6.986
�0.915 �2.281 4.64 �7.134
�0.93 �2.322 4.729 �7.276
�0.946 �2.362 4.815 �7.411
Delivered by ICEVirtualLibrary.com to: IP: 130.216.12.217 On: Fri, 15 Apr 2011 03:24:53
TEMPERATURE AND THERMAL GRADIENT EFFECTS ON PSYCHROMETER MEASUREMENTS 40
T: °C
ANN modelling As recommended in the proposed psychrometer calibration protocol, an ANN method was used to analyse the collected calibration data and build a unique constitutive model of the calibrated psychrometer. NeuroShell II 1 , produced by the Ward System Group, was used in this study for this purpose. In order to fully characterise the psychrometer behaviour, two ANN models were developed, as shown in Fig. 5. The first model represents calibration, where the input parameters in the training pattern are �, T and ˜To, and the output is ˜Twb. The second model represents measurement, where the input parameters in the training pattern are ˜Twb, T and ˜To, and the output is �. These two models were developed through a training and testing process conducted using the ANN BP architecture and learning approach. Both models were developed using the same calibration data, where 80% and 20% of these data, randomly chosen, were used for training and testing purposes respectively. The number of hidden layers in each model was one. The hidden layers of the measurement and calibration ANN models comprise 15 and 14 neurons respectively. A logistic activation function was used for both models. The performance of the two models was evaluated statistically, and they show high correlation coefficients, as shown in Table 3. This result indicated that both ANN models are able to determine a reliable constitutive relation for thermocouple psychrometer behaviour using the collected calibration data.
f
35 30
d
TL b
25
e
c
a
0
20 15 0
1
2 3 Time: day (a)
4
5
4
5
10 a
Zero-offset: µV
0
c
5 d b e
0
f �5 0
1
2 3 Time: day (b)
ΔTwb: µV
10
c
a
d
5
e
DISCUSSION OF CALIBRATION RESULTS Temperature effect The developed ANN psychrometer model was used to investigate the temperature effect on psychrometer measurements at the perfect isothermal condition (zero-offset ¼ 0.0 �V). The model outcome was plotted in the ˜Twb – T plane at different water potential levels, as shown in Fig. 6. The results indicate that the temperature effect on psychrometer measurement depends on the water potential level: it increases as the water potential level increases. Such behaviour was also observed by Comstock (2000). It is a common procedure to adjust the temperature effect by correcting the psychrometer reading measured at any temperature to that at 258C. An empirical equation was proposed by Brown (1970) for this purpose, where the effect of water potential level was ignored. It states that
b
0
f
0 0
1
2 3 Time: day (c)
4
5
4
5
Ψ: MPa
�0·8
a
�0·9
b
0
c d
e f
�1 0
1
2 3 Time: day (d)
ð˜Twb Þ T (1) a þ bT where (˜Twb )25 and (˜Twb ) T are the wet-bulb voltage drops at equilibrium temperatures of 258C and T respectively, and a and b are constants. Brown (1970) found that a ¼ 0.325 ð˜Twb Þ25 ¼
Fig. 4. Typical collected psychrometer calibration data
Input pattern
5
Ψ
T
Zero-offset
ΔTwb
T
Zero-offset
Calibration ANN
Measuring ANN
ΔTwb
Ψ
Output pattern
Fig. 5. Developed ANN
Delivered by ICEVirtualLibrary.com to: IP: 130.216.12.217 On: Fri, 15 Apr 2011 03:24:53
ABUEL-NAGA AND BOUAZZA
6
Table 3. Evaluation of thermocouple psychrometer ANN models Parameter
Calibration model
Measuring model
Total pattern
Training pattern
Testing pattern
Total pattern
Training pattern
Testing pattern
0.9721 2.697
0.9815 1.801
0.9626 3.593
0.9508 0.289
0.9669 0.195
0.9346 0.383
Correlation coefficient Mean squared error
30 Suction: MPa �1·0
25
�2·0 �4·0
ΔTwb: µV
20
�6·0
15
10
5 Zero-offset: � 0·0 µV 0 15
20
25
30
35
40
T: °C
Fig. 6. Effect of equilibrium temperature on ˜Twb at different water potential levels
and b ¼ 0.027 8C �1 . The results of the developed ANN psychrometer model shown in Fig. 5 were used to investigate the effect of water potential on the constants a and b. Fig. 7 shows a comparison between the evolution of a and b as water potential level increases, based on the results of the 0·05
b: °C�1
0·04 0·03 0·02
This study (zero-offset � 0·0) Comstock (2000) (zero-offset�?)
0·01
Brown (1970) (zero-offset�?)
0 0
�1·0
�2·0
�3·0 �4·0 Ψ: MPa
�5·0
�6·0
ANN psychrometer model developed in this study, and the equations suggested by Brown (1970) and Comstock (2000). In general, the parameters a and b depend on water potential level. The effect of water potential on a and b for the calibrated psychrometer in this study was found to be greater than that suggested by Comstock (2000). This behaviour can be attributed to, first, the expected differences in details of psychrometer construction (e.g. size of thermocouple junctions; Savage et al., 1982) and, second, the fact that the temperature gradient condition (zero-offset value) was not known for Comstock (2000), whereas it was set to be zero in this study. The zero-offset value can have a significant effect on the psychrometer measurement, as will be explained in the following sections. For the psychrometer sensor used in this study, the error in water potential measurement from using the values of a and b proposed by Brown (1970) is shown in Fig. 8. The errors are affected by temperature and water potential levels. This behaviour is in agreement with Comstock’s (2000) results. In conclusion, the difference between the results of this study and those of Brown (1970) or Comstock (2000) does not imply the falseness of any of them, but it can be used to support the proposal that each psychrometer possesses unique values of a and b, which should be determined by a careful calibration programme at different water potential levels. Since, in most cases, the psychrometer measurement can be done in a laboratory environment with temperature stability of �1.08C or even better (Agus & Schanz, 2005; Thom et al., 2007; Abuel-Naga & Bouazza, 2010), the absolute water potential errors due to a 1.08C error in equilibrium temperature were estimated using the developed ANN psychrometer model under perfect isothermal conditions (zero-offset ¼ 0.0), as shown in Fig. 9. Positive temperature errors overestimate water potential measurement, and negative errors underestimate it. The results in Fig. 9 show that the error in water potential measurement decreases as the temperature level increases, but it increases as the suction level increases up to 4 MPa. With a further increase 15·0
�7·0
Zero-offset � 0·0 µV 10·0
Error in Ψ: %
0·6 0·4 0·2 a
0
5·0 0 �5·0 Suction: MPa
�0·2 �10·0
�0·4
�1
�2
�4
�6
�15·0
�0·6 0
�1·0
�2·0
�3·0 �4·0 Ψ: MPa
�5·0
�6·0
�7·0
15
20
25
30
35
40
T: °C
Fig. 7. Comparison between various psychrometer temperature correction equations
Fig. 8. Error in psychrometer water potential measurement from using Brown (1970) temperature correction equation
Delivered by ICEVirtualLibrary.com to: IP: 130.216.12.217 On: Fri, 15 Apr 2011 03:24:53
TEMPERATURE AND THERMAL GRADIENT EFFECTS ON PSYCHROMETER MEASUREMENTS Suction: MPa 6·0
�1
�2
5·0
�4
�6
�4·0
4·0 3·0
T � 20°C
Suction: MPa �1·0 �2·0
20
ΔTwb: µV
Absolute error in: Ψ: %
7
25
7·0
�6·0
15
10 2·0 1·0
5 Zero-offset � 0·0 µV
0 15
20
25
30
35
40
T: °C
Fig. 9. Absolute error in psychrometer water potential measurement due to 61.08C error in equilibrium temperature measurement as proposed by developed model
in suction level the error decreases, since the parameters a and b show a change in their suction-level-dependent behaviour at ł � 4.0 MPa, as shown in Fig. 7. In general, it is believed that the errors shown in Fig. 9 under temperature stability of �1.08C are acceptable. However, it has been known in the geotechnical engineering literature since the work done by Krahn & Fredlund (1972) that the temperature environment of a psychrometer measurement should be controlled within �0.0018C in order to measure the total suction to an accuracy of �10 kPa. This statement does not contradict the results of the developed model reported in this study. This tight temperature restriction was introduced mainly to prevent any possible thermal gradient – in other words, to establish an isothermal condition where the zero-offset � 0.0. This explanation can be understood using the approximate thermocouple psychrometer model equation introduced by Campbell (1979), who found that a 1.08C error in the measurement of T resulted in a 2.5% error in �, whereas a 1.08C error in the measurement of ˜Twb resulted in an error of 10 MPa. Campbell (1979) therefore suggested that water potential measurement accurate to 10 kPa requires an error in ˜Twb measurement to be smaller than 0.0018C. The error in ˜Twb may result from the existence of a thermal gradient. Therefore it is believed that the only way to make use of a thermocouple psychrometer in a conventional laboratory environment, where the temperature stability is about �1.08C, is to understand the effect of thermal gradients on psychrometer measurements, and find a proper correction approach to account for their effect.
0 �8
�4
�6
�2 0 2 Zero-offset: µV
4
6
8
Fig. 10. Effect of zero-offset on ˜Twb at different water potential levels
whereas the slope of this relation, d, represents the effect of zero-offset on psychrometer output (˜Twb ) at different water potential levels. The effect of water potential level on d is depicted in Fig. 11. The results show that d increases as water potential increases. Figure 12 describes a typical T–zero-offset coupling effect on psychrometer output (˜Twb ). The slope of the linear relation (d ) decreases as the temperature increases, as shown in Fig. 12(a). The typical effect of zero-offset on parameters a and b (equation (1)) for � ¼ �4.0 MPa can be deduced from the results shown in Fig. 12(b). This effect can partially explain the difference observed in Fig. 7 between this study and the other studies. Michel (1979) found the effect of temperature on d, but found no effect of water potential as shown in Fig. 11. It is thought that the reason for not detecting the water potential effect on d can be explained in light of the narrow temperature and water potential ranges that were studied; 208C to 308C and �0.5 to �2.0 MPa respectively. It is highly possible that the water potential effect on d was masked by the variability of the results within this limited range. Therefore, for accurate assessment of a psychrometer response, it is strongly recommended that a broader range of temperatures and water potential conditions be used in the calibration process. Figure 13 shows a comparison between the zero-offset effects on the psychrometer output (˜Twb ) based on the ANN psychrometer model developed in this study, and as proposed by Michel (1979) at T ¼ 258C. For both cases the relation between ˜Twb and � was shifted up for positive 0·70 T � 20°C
Thermal gradient effect The effect of the thermal gradient (zero-offset) on the psychrometer output was investigated using the developed ANN psychrometer model at T ¼ 208C and different water potential levels, as shown in Fig. 10. The typical results shown in Fig. 10 indicate that, under positive zero-offset conditions, psychrometer output (˜Twb ) tends to be higher than under perfect isothermal conditions (zero-offset ¼ 0.0), but under negative zero-offset conditions, output tends to be lower than under the perfect isothermal conditions. Similar observations were reported earlier by Michel (1979) and Brown & Bartos (1982). The results shown in Fig. 10 suggest the existence of a strong linear relationship for all water potential levels. The intercept of this relation at zerooffset ¼ 0 represents the psychrometer output at different water potential levels under perfect isothermal condition,
0·65 0·60 0·55 d 0·50
This study
0·45 Michel (1979) 0·40 0·35 0·30 0
�1
�2
�4 �3 Ψ: MPa
�5
�6
�7
Fig. 11. Effect of water potential level on ˜Twb –zero-offset relationship
Delivered by ICEVirtualLibrary.com to: IP: 130.216.12.217 On: Fri, 15 Apr 2011 03:24:53
ABUEL-NAGA AND BOUAZZA
8 20
zero-offset and shifted down for negative zero-offset. At ˜Twb ¼ 5.0 �V the proposed ANN model gives water potential values ranging between 0.8 and 2.18 MPa as the zerooffset varies between 5.0 and �5.0 �V. This result suggests that every 1.0 �V can produce an error equal to 0.138 MPa. This error is close to what can be obtained from Michel’s (1979) study, which recommended 0.149 MPa for each 1.0 �V zero-offset, as shown in Fig. 13. Again, the difference between the results of this study and those of Michel (1979) does not imply the falseness of either of them, but supports the proposal that each psychrometer possesses a unique behaviour, and should be carefully calibrated to obtain an accurate and reliable water potential measurement.
18 16
ΔTwb: µV
14 12 10 T: °C 20
8 6
25 4 30 2 0 �8
20
Ψ � �4·0 MPa �4
�6
35
�2 0 2 Zero-offset: µV (a)
4
6
8
Ψ � �4·0 MPa
18 16 14
ΔTwb: µV
12 10
Zero-offset: µV
8
�5
6
�2
Characterisation of thermocouple psychrometer behaviour Under perfect isothermal conditions (zero-offset ¼ 0.0 �V), the results of the developed ANN psychrometer model at different temperature levels show that the psychrometer behaviour can be described as a constitutive surface in �, T and ˜Twb space, as depicted in Fig. 14. Within the temperature range of this study, the temperature evolution of the �–˜Twb relationship is depicted in Fig. 15. These results describe the geometry of cross-sections in the psychrometer constitutive surface at different temperature levels. The curves at 208C and 358C in Fig. 15 represent the curves 2–4 and 1–3 in Fig.
Ψ
0
4
2 2
5
0 15
20
25
30
35
4
40
T: °C (b)
ΔTwb
Fig. 12. Coupled effect of (a) zero-offset and (b) temperature on ˜Twb
3 2
14
1 T � 25°C T
12
Fig. 14. Schematic diagram psychrometer surface
ΔTwb: µV
10
constitutive
thermocouple
5 µV �8
5 µV
8
0 µV 6
0 µV
�7
�5 µV
�6 �5
Ψ: MPa
4 ΔΨ � �1·49 2
ΔΨ � �1·38
�1·0
T: °C 20 25 30 35
�2 �1·5
�2·0 Ψ: MPa
�2·5
�3·0
�1
Zero-offset � 0·0 µV
0
Zero-offset by: Michel (1979)
�4 �3
�5 µV 0 �0·5
of
0 This study
Fig. 13. Comparison between psychrometer thermal gradient correction by Michel (1979) and developed model in this study
5
10
15 ∆Twb: µV
20
25
30
Fig. 15. Evolution of �–˜Twb relationship at different equilibrium temperature levels
Delivered by ICEVirtualLibrary.com to: IP: 130.216.12.217 On: Fri, 15 Apr 2011 03:24:53
TEMPERATURE AND THERMAL GRADIENT EFFECTS ON PSYCHROMETER MEASUREMENTS
�8 �7 �6
Ψ: MPa
�5 �4 Zero-offset: µV �5·0 �2·0 0·0 2·0 5·0
�3 �2 �1 0 0
5
10
15 ∆Twb: µV (a)
20
25
�1·4
∆Twb � 0·0 µV
Zero-offset: µV �5·0
�1·2
�2·0 0·0
�1·0
Ψ: MPa
14 respectively. The results in Fig. 15 indicate that the �– ˜Twb relationship is non-linear, where the degree of curvature is temperature dependent. It decreases as the temperature increases. The results also show that the sensitivity of the psychrometer increases as the temperature increases. For a water potential range of 0.0–7.2 MPa, the corresponding ˜Twb range is 0.0–22 �V at T ¼ 208C, whereas it is 0.0– 28 �V at T ¼ 358C. A similar observation was reported by Brown & Bartos (1982). The effect of thermal gradient (zero-offset) on the configuration of the psychrometer constitutive surface in �, T and ˜Twb is shown in Fig. 16 at T ¼ 208C and 358C. The results indicate that under negative zero-offset the psychrometer constitutive surface shifted up in �, T and ˜Twb space, and under positive zero-offset it shifted down. The rate of shifting is temperature dependent: it decreases as temperature (T) increases. The psychrometer constitutive surface can also be used to determine the lower limit of the water potential values that can be measured by a psychrometer. Based on thermocouple psychrometer working theory, if the atmosphere adjacent to the measuring thermocouples is at saturated vapour pressure (� ¼ 0.0), the ambient temperature and the dew-point temperature will be identical, and thus the condensed water on the sensing thermocouple will not evaporate. This situation should correspond to ˜Twb ¼ 0.0. However, the results of the developed ANN psychrometer model deviate from this theoretical concept, even for the ideal isothermal condition
9
�1·6
2·0 5·0
�0·8 �0·6 �0·4 �0·2 0 20
25
30
35
T: °C
Fig. 17. Lower boundary for water potential measurement by psychrometer
where zero-offset ¼ 0.0 �V. Fig. 17 describes the locus of conditions where the combinations of water potential and thermal gradient produce ˜Twb ¼ 0.0 �V as proposed by the model developed in this study. This result suggests that the lower limit of the water potential value that can be measured by a thermocouple psychrometer is a function of temperature and zero-offset condition. Such a lower limit restriction for water potential measurement by thermocouple psychrometer has been already acknowledged in geotechnical research. Bulut & Leong (2008) recommended that the lower practical water potential measurement by thermocouple psychrometer is between 0.30 and 0.50 MPa. However, Ridley & Wray (1996) and Andraski & Scanlon (2002) have extended this limit up to 1.0 MPa. This behaviour can be explained in light of the high sensitivity of the thermocouple psychrometer to temperature fluctuation below this limit. In other words, as the vapour equilibrium near the vapour saturation condition is highly sensitive to temperature fluctuation, the thermal instability at this condition may significantly disturb heat, vapour and water diffusion processes into the psychrometer housing, and consequently preclude the applicability of the psychrometer technique in such a highly humid environment.
30
�8 �7 �6
Ψ: MPa
�5 �4 Zero-offset: µV �5·0
�3
�2·0
�2
0·0 2·0
�1
5·0 0 0
5
10
15 ∆Twb: µV (b)
20
25
30
Fig. 16. Evolution of �–˜Twb relationship at different equilibrium zero-offset levels: (a) T 208C; (b) T 358C
CONCLUSIONS The thermocouple psychrometer is a highly temperaturesensitive sensor that can be affected by operator skills. Therefore poor procedures or inadequate attention to both the practical and theoretical requirements of this sensor can jeopardise its successful performance. The results of this study show that use of the psychrometer correction equations proposed in the current literature is not recommended, unless their applicability is verified for the specific psychrometer sensor being used. Each psychrometer has its unique identity, which must be thoroughly understood through a careful calibration protocol in order to obtain accurate and reliable water potential measurements. A new precise psychrometer calibration protocol that takes advantage of the ANN approach was introduced in this study. The proposed calibration enables the establishment of a reliable psychrometer constitutive surface that can describe the psychrometer behaviour at any condition within a psychrometer parameter space.
Delivered by ICEVirtualLibrary.com to: IP: 130.216.12.217 On: Fri, 15 Apr 2011 03:24:53
10
ABUEL-NAGA AND BOUAZZA
REFERENCES Abu Kiefa, M. A. (1998). General regression neural networks for driven piles in cohesionless soils. J. Geotech. Geoenviron. Engng ASCE 124, No. 12, 1177–1185. Abuel-Naga, H. M. & Bouazza, A. (2010). A novel laboratory technique to determine water retention curve of geosynthetic clay liners. Geosynthetics Int. 17, No. 5, 313–322. Agus, S. S. & Schanz, T. (2005). Comparison of four methods for measuring total suction. Vadose Zone J. 4, No. 4, 1087–1095. Agus, S. S. & Schanz, T. (2007). Errors in total suction measurements. In Experimental unsaturated soil mechanics, Springer Proceedings in Physics, Vol. 112, pp. 59–70. Andraski, B. J. & Scanlon, B. R. (2002). Thermocouple psychrometry. In Methods of soil analysis (eds J. H. Dane and G. C. Topp), Part 4, SSSA Book Series 5, pp. 609–642. Madison, WI: Soil Science Society of America. Blatz, J. A. & Graham, J. (2000). A system for controlled suction in triaxial tests. Ge´otechnique 50, No. 4, 465–469, doi: 10.1680/geot.2000.50.4.465. Blatz, J. A., Tang, G. X., Graham, J. & Wan, A. (1999). Psychrometer techniques for measuring suction in the triaxial test. Proc. 52nd Can. Geotech. Conf., Regina, 237–245. Bouazza, A. (2002). Geosynthetic clay liners. Geotext. Geomemb. 20, No. 1, 3–17. Bouazza, A., Freund, M. & Nahlawi, H. (2006a). Water retention of nonwoven polyester geotextiles. Polym. Test. 25, No. 8, 1038– 1043. Bouazza, A., Zornberg, J., McCartney, J. & Nahlawi, H. (2006b). Significance of unsaturated behaviour of geotextiles in earthen structures. Aust. Geomech. 41, No. 3, 133–142. Brown, P. W. & Tanner, C. B. (1981). Alfalfa water potential measurement: a comparison of the pressure chamber and leaf dewpoint hygrometers. Crop Sci. 21, No. 2, 240–244. Brown, R. W. (1970). Measurement of water potential with thermocouple psychrometers: Construction and applications, Research Paper INT-80. Ogden, UT: USDA Forest Service. Brown, R. W. & Bartos, D. L. (1982). A calibration model for screen-caged Peltier thermocouple psychrometers, Research Paper INT-293. Ogden, UT: USDA Forest Service. Bulut, R. & Leong, E. C. (2008). Indirect measurement of suction. Geotech. Geol. Engng 26, No. 6, 633–644. Bulut, R., Aubeny, C. P. & Lytton, R. L. (2005). Unsaturated soil diffusivity measurements. Proceedings of the international symposium on advanced experimental unsaturated soil mechanics, Trento, pp. 281–286. Campbell, G. S. (1979). Improved thermocouple psychrometers for measurement of soil water potential in a temperature gradient. J. Phys. E Sci. Instrum. 12, No. 8, 739–743. Comstock, J. P. (2000). Correction of thermocouple psychrometer readings for the interaction of temperature and actual water potential. Crop Sci. 40, No. 3, 709–712. Delage, P. (2002). Experimental unsaturated soil mechanics. Proc. 3rd Int. Conf. on Unsaturated Soils, Recife 3, 973–996. Delage, P., Howat, M. D. & Cui, Y. J. (1998). The relation between suction and swelling properties in a heavily compacted unsaturated clay. Engng Geol. 50, No. 1, 31–48. Delage, P., Romero, E. & Tarantino, A. (2008). Recent developments in the techniques of controlling and measuring suction in unsaturated soils. Proc. 1st Eur. Conf. on Unsaturated Soils, Durham, 33–52. Dixon, D., Chandler, N., Graham, J. & Gray, M.N. (2002). Two large-scale sealing tests conducted at Atomic Energy of Canada’s underground research laboratory: the buffer-container experiment and the isothermal test. Can. Geotech. J. 39, No. 3, 503–518. Dixon, M. A. & Tyree, M. T. (1984). A new stem hygrometer, corrected for temperature gradients and calibrated against the pressure bomb. Plant Cell Environ. 7, No. 9, 693–697. Fredlund, D. G. & Rahardjo, H. (1988). State of development in the measurement of soil suction. Proceedings of the international conference on engineering problems on regional soils, Beijing, pp. 582–588. Fredlund, D. G. & Rahardjo, H. (1993). Soil mechanics for unsaturated soil. New York: Wiley. Gee, G. W. & Ward, A.L. (2000). Innovations in two-phase measurements of soil hydraulic properties. In Proceedings of an
international conference on methods for estimating the hydraulic properties of unsaturated soils (eds M. Th. van Genuchten et al.), pp. 241–269. Riverside, CA: UC Riverside Press. Goh, A. T., Kulhawy, F. H. & Chua, C. G. (2005). Bayesian neural network analysis of undrained side resistance of drilled shafts. J. Geotech. Geoenviron. Engng 131, No. 1, 84–93. Hamilton, J. M., Daniel, D. E. & Olson, R. E. (1979). Measurement of hydraulic conductivity of partially saturated soils. In Permeability and groundwater contaminant transport (eds T. F. Zimmie and C. O. Riggs), ASTM STP 746, pp. 182–196. American Society for Testing and Materials. Hanna, A. M., Ural, D. & Saygili, G. (2007). Neural network model for liquefaction potential in soil deposits using Turkey and Taiwan earthquake data. Soil Dynam. Earthquake Engng 27, No. 6, 521–540. Juang, C. H., Jiang, T. & Christopher, R. A. (2001). Three-dimensional site characterisation: neural network approach. Ge´otechnique 51, No. 9, 799–809, doi: 10.1680/geot.2001.51.9.799. Kauraw, D. L. & Gupta, R. K. (1985). Thermocouple psychrometer probe. II. Calibration of thermocouple psychrometer: a rapid technique. Z. Pflanzenernaehr. Bodenk. 148, No. 5, 574–583. Krahn, J. & Fredlund, D. G. (1972). On total, matric and osmotic suction. Soil Sci. 114, No. 5, 339–348. Lang, A. R. G. (1967). Osmotic coefficients and water potentials of sodium chloride solutions from 0 to 408C. Aust. J. Chem. 20, No. 9, 2017–2023. Leong, E.-C., Tripathy, S. & Rahardjo, H. (2003). Total suction measurement of unsaturated soils with a device using the chilledmirror dew-point technique. Ge´otechnique 53, No. 2, 173–182, doi: 10.1680/geot.2003.53.2.173. McBurney, T. (1988). A temperature-controlled plant psychrometer. Plant and Soil 109, No. 20, 271–275. Merrill, S. D. & Rawlins, S. L. (1972). Field measurement of soil water potential with thermocouple psychrometers. Soil Sci. 113, No. 2, 102–109. Michel, B. E. (1977). A miniature stem thermocouple hygrometer. Plant Physiol. 60, No. 4, 645–647. Michel, B. E. (1979). Correction of thermal gradient errors in stem thermocouple hygrometers. Plant Physiol. 63, No. 1, 221–224. Nahlawi, H., Bouazza, A. & Kodikara, J. (2007). Characterisation of geotextiles water retention using a modified capillary pressure cell. Geotext. Geomemb. 25, No. 3, 186–193. Oosterhuis, D. M. (2002). Psychrometry for measuring plant and soil water potential: theory, types and uses. In Encyclopedia of water science (eds B. A. Stewart and T. Howell), pp. 751–754. New York: Marcel Dekker. Parker, D. B. (1985). Learning logic, Technical Report TR-47. Cambridge, MA: Center for Computational Research in Economics and Management Science, MIT. Peterson, R. W. (1988). Interpretation of triaxial compression test results on partially saturated soils. In Advanced triaxial testing of soil and rock (eds R. T. Donaghue, R. C. Chaney and M. L. Silver), ASTM Special Technical Publication No. 977, pp. 512– 538. Philadelphia, PA: ASTM. Rahardjo, H. & Leong, E.C. (2006). Suction measurements. Proc. 4th Int. Conf. on Unsaturated Soils, Carefree, AZ 1, 81–104. Rawlins, S. L. & Dalton, F. N. (1967). Psychrometric measurement of soil water potential without precise temperature control. Soil Sci. Soc. Am. Proc. 31, No. 3, 297–301. Ridley, A. M. (1993). The measurement of soil moisture suction. PhD thesis, Imperial College of Science, Technology and Medicine, University of London. Ridley, A. M. & Wray, W. K. (1996). Suction measurement: a review of current theory and practices. Proc. 1st Int. Conf. on Unsaturated Soils (UNSAT 95), Paris, 1293–1322. Rumelhart, D. & McClelland, J. L. (1986). Parallel distributed processing, Vols 1 and 2. Cambridge, MA: MIT Press. Savage, M. J., Cass, A. & De Jager, J. M. (1982). An accurate temperature correction model for thermocouple hygrometers. Plant Physiol. 69, No. 2, 526–530. Shackel, K. A. (1984). Theoretical and experimental errors for in situ measurements of plant water potential. Plant Physiol. 75, No. 3, 766–772. Spanner, D. C. (1951). The Peltier effect and its use in the measurement of suction pressure. J. Exp. Bot. 2, No. 2, 145– 168.
Delivered by ICEVirtualLibrary.com to: IP: 130.216.12.217 On: Fri, 15 Apr 2011 03:24:53
TEMPERATURE AND THERMAL GRADIENT EFFECTS ON PSYCHROMETER MEASUREMENTS Tang, G. H., Graham, J., Blatz, J., Gray, M. & Rajapakse, R. K. N. D. (2002). Suctions, stresses and strengths in unsaturated sand–bentonite. Engng Geol. 64, No. 2, 147– 156. Thom, R., Sivakumar, V., Brown, J. & Hughes, D. (2007). A simple triaxial system for evaluating the performance of unsaturated soils under repeated loading. Geotech. Test. J. ASTM 31, No. 2, 107–114. Vanderchmitt, E. & Daudet, F.-A. (1994). The origin and theoretical correction of thermal gradients in thermocouple psychrometers. Plant, Cell Environ. 17, No. 1, 97–104. Wang, A. W. L, Gary, M. N. & Chandler, N. A. (1995). Tracking in
11
situ moisture transients in heated clay. Proc. 1st Int. Conf. on Unsaturated Soils, Paris, 925–932. Weiderhold, P. R. (1997). Water vapour measurement: Methods and instrumentation. New York: Marcel Dekker. Werbos, P. (1974). Beyond regression: new tools for prediction and analysis in the behavioral sciences. PhD thesis, Harvard University, Cambridge, MA. Wescor (1979). HR-33T instruction manual. Logan, UT: Wescor, Inc. Wiebe, H. H. & Prosser, R. J. (1977). Influence of temperature gradients on leaf water potential. Plant Physiol. 59, No. 2, 256– 258.
Delivered by ICEVirtualLibrary.com to: IP: 130.216.12.217 On: Fri, 15 Apr 2011 03:24:53