Perception & Psychophysics 1993. 54 (6). 716-732
Efficiency of visual selection in duplex and conjunction conditions in partial report HITOMI SHIBUYA University of Copenhagen, Copenhagen, Denmark Factors that determine the efficiency of visual selection were investigated in two precued partialreport experiments. There were four selection conditions: a color condition (e.g., selecting purple letters among blue letters), a class condition (e.g., selecting letters among digits), a duplex condition (e.g., selecting purple letters among blue digits; that is, the targets differed from the distractors both in color and in alphanumeric class), and a conjunction condition (e.g., selecting purple letters among blue letters and purple digits; that is, the targets differed from the distractors either in color or in alphanumeric class). The efficiency of visual selection was highest in the duplex condition and lowest in the conjunction condition. The difference in performance across the different selection conditions within subjects was accounted for by variation in the value of a single parameter ofthe fixed-capacity independent race model (FIRM) proposed by Shibuya and Bundesen (1988), which assumes independent parallel processing, limitations in both processing capacity and storage capacity, and time-invariant selectivity. By assuming that the factors that determine the efficiency of selection in the color and class conditions also underlie the efficiency of selection in the duplex and conjunction conditions, an extension of FIRM, FIRM+, accounted for the relationship with respect to efficiency of selection among the different conditions.
When confronted with several visual objects, human beings are severely limited in their ability to comprehend them all simultaneously. Yet, the limitations in the human visual information-processing system are compensated for by its selectivity: We have an ability to set higher priorities for the objects that are currently relevant. In this article, I address the following questions concerning our ability to prioritize: What kind of mechanism enables our knowledge of current relevance to make our informationprocessing system selective? What are the factors that determine the efficiency of selection? I report two precued partial-report experiments that were designed to investigate these questions. There were four selection conditions: a color condition, in which the
This research was supported by grants from the University of Copenhagen. the Danish Research Council for the Humanities (15-8120. 158455, and 15-8968), and the International Human Frontier Science Program Organization. An earlier version of this article was submitted as a part of the author's doctoral dissertation to the University of Copenhagen. Parts of the work reported in this article were orally presented at the 2nd International Conference on Visual Search, September 4. 1990, Durham, U.K .. and at the 5th Conference of the European Society for Cognitive Psychology, September 15,1992, Paris. I wish to thank Claus Bundesen and Axel Larsen for stimulating discussions on the experiments reported in this article. and for their suggestions and encouragement throughout all phases of its preparation. I also wish to thank James T. Townsend and Kyle R. Cave for their comments on an earlier version of the manuscript. and LejfRasmussen, Mikael Mortensen, Henrik Due, Peter Callesen, Soren Ellegaard, and Jergen Rathje for their engineering and technical support. Correspondence concerning this article should be addressed to the author at Psychological Laboratory, University of Copenhagen, Njalsgade 90, DK-2300 Copenhagen S, Denmark (e-mail:
[email protected]).
Copyright 1993 Psychonomic Society, Inc.
targets differed from the distractors in terms of color (e.g., selecting purple letters from a mixture of purple letters and blue letters); a class condition, in which the targets differed from the distractors in terms of alphanumeric class (e.g., selecting letters from a mixture of letters and digits); a duplex condition, in which the targets differed from the distractors in terms of both color and alphanumeric class (e. g., selecting purple letters from a mixture of purple letters and blue digits); and a conjunction condition, in which the targets differed from the distractors in terms of either color or alphanumeric class (e.g., selecting purple letters from a mixture of purple letters, blue letters, and purple digits). Despite the advantage that the partial-report paradigm provides in allowing one to study the two complementary aspects of the visual processing system, its limitations and selectivity, within one experiment, the partialreport paradigm has been somewhat neglected in the extensive visual selection literature of the past 25 years. Most empirical investigations have been based on the visual search paradigm. To my knowledge, no partialreport experiment with duplex and conjunction conditions has been reported. I first review the limitations on whole report, the early interpretations of partial-report performance, and the fixed-capacity independent race model (FIRM) proposed by Shibuya and Bundesen (1988).
Limitations on Whole Report The limitations in the human visual information-processing system are clearly demonstrated in whole-report experiments. On each trial, the subject is presented with
716
EFFICIENCY OF VISUAL SELECTION
717
a stimulus display comprising a number of elements (e.g., letters, digits). The exposure duration is brief (i.e., less than 200 msec), The task is to report as many elements as possible from the stimulus display. The number of correctly reported elements, the score, is recorded. When a poststimulus mask is not used and if the number of the elements in the stimulusdisplay is four or fewer, the subject can report almost all the elements. However, if the number of the elements exceeds four, the average score remains around 4 (see Sperling, 1960, 1963; Bundesen, Pedersen, & Larsen, 1984; Bundesen, Shibuya, & Larsen, 1985). This whole-report limitation has been attributed to the capacity limitation of the memory from which the subject makes the report (see Sperling, 1960; Bundesen et al., 1984, Bundesen et al., 1985; Shibuya & Bundesen, 1988). When an appropriate mask is presented at stimulus display offset, mean scores increase as the exposure duration of the stimulus display increases. The rate of increase in mean score is initially high, but it almost vanishes as the exposure duration becomes longer than about 100 msec (Sperling, 1963, 1967).
ferred to a capacity-limited second memory, from which the subject makes the report. Because of this theoretical framework, the partial-report paradigm has been regarded as an experimental method used to investigate the nature of attributes processed prior to the stage of the first memory. The early partial-report studies (e.g., Sperling, 1960, 1963; Von Wright, 1968, 1970) showed that when the selection criterion was defined in terms of a simple physical characteristic (e.g., location, color), the difference between the partial-report score and the whole-report score, the partial-report superiority, was high. But when a conceptual categorization (e.g., alphanumeric class) defined the selection criterion, the partial-report superiority was close to zero. These results were interpreted as evidence that simple physical characteristics are processed prior to the stage of the first memory but conceptualcategorizations are not. In this view, selective transfer to the second memory on the basis of a simple physical characteristic is possible and perfect, but selective transfer on the basis of a conceptual category is impossible; that is, the transfer is done at random (nonselectively).
Visual Selection and Partial Report Sperling (1960) introduced the partial-report paradigm, a variation of the whole-report paradigm. In a partialreport experiment, the instruction specifies a selection criterion that partitions the stimulus ensemble (i.e., the set of all the elements that might appear in the stimulus display) into a set of targets (i.e., the relevant elements) and a set of distractors (i.e., the irrelevant elements). The selection criterion may be given before, during, or after the stimulus presentation. A stimulus display contains a number of distractors and one or more targets. The task is to report as many targets as possible from the stimulus display and to ignore the distractors,
Selection as a Race Bundesen, Shibuya, and Larsen (1985) introduced an independent race framework for the selection process underlying partial-report performance (see also Bundesen, 1987). The selection among the elements in the stimulus display is regarded as a parallel independent race for entrance to a short-term memory (STM) store with a fixed capacity of K elements: (1) The processing begins simultaneously and proceeds in parallel for all the elements. (2) Processing times for the elements are independent stochastic variables. (3) If and when the processing of a given element is completed, the representation for the element enters the STM store, provided that the element is within the Kth element to be completed (i.e., the STM store is not yet filled with elements). And (4) the subject reports those targets represented in the STM store. (See Figure 1 for an illustration.) For whole-report experiments and partial-report experiments, the independent race framework provides mathematical descriptions of the functional relations between the performance and the experimental variables (see Shibuya & Bundesen, 1988). If the probability distributions of the processing times for individual elements can be specified, it is possible to compute the probability dis. tribution of the score in a given trial.
Early Interpretations In Sperling's (1960) partial-report experiments, the number of targets in most of the cases were within the whole-report limitation. To evaluate the partial-report performance, Sperling (1960) employed what came to be called a partial-report score: the total number of the elements in the stimulus display multiplied by probability correct (i.e., the number of correctly reported targets, the score, divided by the number of targets). Sperling (1960) regarded the partial-report score as the number of elements available to the subject in some form of memory. The underlying rationale was as follows: (1) The elements in the stimulus are transferred to a capacity-unlimited first memory. The probability that a given element is available in the first memory is the same as that for any other element, and independent of the fate of any other element. And (2) if the information necessary to distinguish the targets from the distractors has been processed prior to the stage of the first memory, and thus is represented in the first memory, those elements that are represented in the first memory and satisfy the selection criterion are trans-
Fixed-Capacity Independent Race Model (FIRM) Shibuya and Bundesen (1988) studied partial-report performance as a function of the exposure duration of the stimulus display. The subject reported the identities of digits from a mixture of digits and letters. Using a postexposure mask, the exposure duration of the stimulus display was systematically varied from 10 to 200 msec. For each exposure duration, the combination of the number of targets (digits) and the number of distractors (letters)
718
SHIBUYA Fi(t)
i;r i
tt I
I
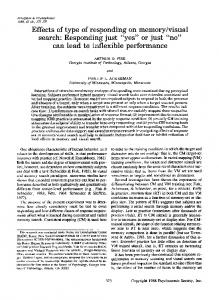
Figure 1. An illustration of the independent race as a general schema for the selection process. Each runner represents an element, and the state of each runner represents the state of the processing of the corresponding element. All the runners start at the same time and run in parallel independently. In this case, the capacity K of the STM store is 3: Each of the first three winners is given a special status. (Copyright 1986 by Kazumic World. Printed by permission.)
was systematically varied. For the target-only displays, the function relating the mean score to the exposure duration had an initial steep rise followed by a gradual leveling off, and the rate of initial increase depended little on the number of targets in the stimulus display. This result suggested that the sum of the processing rates of the elements was fixed across the stimuli. A fixed-capacity independent race model (FIRM) was formulated within the independent race framework with the following assumptions concerning the probability distributions of the processing times. (1) The processing times are exponentially distributed. (The exponential distribution is the simplest probability distribution for time course. See, e.g., Townsend & Ashby, 1983.) The probability Fi(t) that the processing of element i is completed before time t(>O) has passed, when the processing rate of element i is Vi (> 0), is given by
=
I -
e-I'i l,
where e is the base for the natural logarithm. (2) For any stimulus display, the total processing capacity (i.e., the sum of the processing rates, EiESVi, where S is the set of all the elements in the stimulus display) is fixed at C elements/sec. 1 And (3) the processing rate for each element is proportional to its weight. As a first approximation, let the weight of a target be the same as the weight of any other target, and let the weight of a distractor be the same as the weight of any other distractor. Further, let the ratio of the weight of a distractor to the weight of a target be a. When there are T targets and D distractors in the stimulus display, the processing rate of a target is given by C/(T+aD) and the processing rate of a distractor is given by aC/(T+aD), where C is the total processing capacity. The ratio of the weight of a distractor to that of a target, a, can be regarded as a measure for the efficiency of selection. If a = 1, the processing is nonselective; that is, the selection of elements from the stimulus display into the STM store is random. If a < 1, the processing is selective at every moment; that is, at every moment, provided the processing of a given target and the processing of a given distractor have not yet been completed, it is more likely that the processing of the target rather than that of the distractor is completed in the next moment (see Shibuya, 1991a). The smaller a is, the higher the efficiency of selection. Note that, unlike the early interpretations of the results in partial report, there is no dichotomy between perfect selection and impossible selection in the independent race framework: The efficiency of selection is on a continuum. Note further that, in the independent race framework, although the processing of all the elements begins simultaneously and proceeds in parallel, the completions of processing for different elements take place at different points in time. In FIRM, the expected interval between process completions becomes longer as the number of already processed elements increases.f However, consider a target and a distractor neither processing of which has been completed before time t has passed. Regardless of the value of time t, the ratio of the conditional probability density that the processing of the distractor is completed at time t to the conditional probability density that the processing of the target is completed at time t equals a. Thus, the selectivity is constant. Because FIRM specifies the probability distribution of the processing time for each element, it is possible to exactly compute the probability distribution of the score for any combination of number of targets, number of distractors, and exposure duration. For the experiment reported by Shibuya and Bundesen (1988), FIRM gave accurate quantitative accounts for the variations of the observed score distributions as functions of the exposure duration. (See Figure 5 of Shibuya & Bundesen, 1988.) Estimated from data by the maximum likelihood method, the total processing capacity C was 45 elements/sec, the efficiency of selection a (the ratio of the weight of a distractor to the weight of a target) was 0.48, the capacity K of the
EFFICIENCY OF VISUAL SELECTION STM store was 3.5 elements, and the longest ineffective exposure duration to was 18 msec. 3 (No processing occurs unless the exposure duration exceeds to. When the exposure duration exceeds to, the difference between the exposure duration and to gives the time available for processing. ) Relation to earlier parallel models. FIRM is closely related to two earlier parallel models: the multicomponent model of Rumelhart (1970) and the bounded performance model of Townsend (1981), which were discussed in detail by Shibuya and Bundesen (1988). Similar to these two earlier parallel models, FIRM assumes a fixed total processing capacity and the independence of processing times of elements. One of the main differences between the assumptions of FIRM and those of the two earlier parallel models concerns storage capacity. In the two earlier models, no limitation in storage capacity is assumed. Consequently, for whole-report and partial-report experiments, these two models predict that the independence of processing times is reflected directly as the independence of report probabilities of the elements. Townsend (1981) reported wholereport data with five elements favoring this prediction. (The display size of 5 apparently was not large enough for the effect of STM storage capacity limitation to be evident in the data.) FIRM assumes a fixed STM storage capacity. Shibuya and Bundesen (1988) showed that, without assuming a fixed STM storage capacity, neither parallel nor serial models could account for their data in the whole-report conditions. Bundesen (1990) demonstrated large deviations between observed mean scores in the whole-report conditions with six elements and the predictions of an independent parallel model with unlimited storage capacity (see Figure 3 of Bundesen, 1990). This issue will be discussed later in this article. Comparison with serial models and parallel models with a fixed storage capacity. Shibuya (l99la) discussed two serial models that are equivalent to FIRM in terms of predictions for the probability distributions of scores: a varying-rate serial process without replacement and a constant-rate serial process with replacement. The formulation of FIRM was found to be conceptually simpler. Shibuya (199Ia) also tested a number of alternative stochastic models to FIRM. First, in modeling the limitations of the total processing capacity, a standard constant-rate serial model (i.e., elements are processed one at a time, at a constant rate, without replacement) was tested against the data from target-only displays of the experiment reported by Shibuya and Bundesen (1988). FIRM was found to give better fits. Second, in modeling the selectivity, a simple nonselective version of FIRM (i.e., a equals 1), a nonselective gamma FIRM (a version of FIRM with gamma distributions assumed for processing times), the selective exponential FIRM, and three selective gamma FIRMs were tested against the partialreport data. The selective exponential FIRM was found to be the best fitting among the tested models. The results suggested that exponential distributions provide very
719
good approximations for distributions of processing times in the human visual information-processing system responsible for visual selection. Furthermore, the assumption in exponential FIRM that selectivity of processing is realized by a mechanismthat makes the processing rates for different elements different was supported. Relation to choice model. Bundesen et al. (1985) showed that, when exponential distributions are assumed within the independent race framework, the probability distributions of the processing completion orders in selection from multielement displays strictly satisfy both the choice axiom and the ranking postulate of Luce (1959). (See also Bundesen, 1987; Townsend & Landon, 1983.) For example, provided the capacity K of the STM store is equal to 3 and provided the processing of elements continues until the STM store is filled, given a stimulus display with Ttargets (T ~ 2) and D distractors (D ~ 1), the probability that the first, the second, and the third elements entering the STM store are a target, a distractor, and another target, respectively, is given by T T
+ al)
X
aD (T-l)
T-l
x------+ al) (T-l) + a(D-l)
A generalization of FIRM. The choice axiom (in particular, the biased-choice model of Luce, 1963) has been highly successful in accounting for single-stimulus recognition, that is, selection of a categorization among alternative categorizations (Townsend & Ashby, 1982). Generalizing FIRM and integrating the biased-choice model, Bundesen (1990) developed a unified theory of visual recognition and attentional selection (TVA). Bundesen showed that, by adopting the assumptions of FIRM, TVA gave detailed accounts for effects of number of targets in whole report, effects of position of targets in whole report, effects of position uncertainty in detection and recognition from single-target displays, effects of display size in visual search, and effects of cue delay in partial report. EXPERIMENT 1
The claim in FIRM that parameter a (the ratio of the weight of a distractor to the weight of a target) serves as a measure for the efficiency of selection needs further testing. The claim was tested in Experiment I. A partialreport experiment was conducted with four selection conditions in separate blocks. In each block, a precued selection criterion specified a target set and one or two distractor sets. The task was to report the targets from a briefly presented circular array of elements. For each selection condition, the frequency distributions of the score were collected as functions of number of targets (4, 8, or 12) and number of distractors (0, 2, 4, 6, or 8) in the stimulus display. Method Subjects Two subjects, l.R. and H.S., participated. Subject l.R. was a Danish male, with normal visual acuity and normal color vision. He was naive with respect to the purpose of the experiment, and
720
SHIBUYA
was paid by the hour for his participation. Subject H.S. was the author, a Japanese female. with corrected-to-normal visual acuity and normal color vision. Both subjects were in their 20s, and both were accustomed to using computer-terminal keyboards. Stimulus Elements and Selection Conditions The stimulus elements were presented in either purple or blue (approximate Munsell notations were lOP 6/8 for purple and 5PB 5/10 for blue). The two colors were highly similar. The identity of each stimulus element belonged to either a set of capital letters comprising 18 consonants (B, C, D, F, H, J, K, L, M, N, P, Q, R, T, V, W, X, and Z) or a set of nine digits (I, 2, 3, 4, 5, 6, 7, 8, and 9). There were four selection conditions: a color condition, a class condition, a duplex condition, and a conjunction condition. In all of the four conditions, the purple letters constituted the target set. In the color condition, the blue letters constituted the distractor set: the targets and the distractors differed in color. In the class condition, the purple digits constituted the distractor set: the targets and the distractors differed in alphanumeric class. In the duplex condition, the blue digits constituted the distractor set: the targets and the distractors differed both in color and in alphanumeric class. In the conjunction condition, the blue letters constituted one distractor set (color distractors), and the purple digits constituted the other distractor set (class distractors): the targets and the distractors differed either in color or in alphanumeric class.
monitor was controlled by a Digital Equipment Corporation PDP11/40 computer with a DEC VT-125 graphics processor. The refresh rate (raster and image frequency) was 50 Hz. All the displayed elements were selected from the standard character set supplied with the VT-125 processor. The elements were presented with a luminance of 80 cd/m ' (purple) and 50 cd/m ' (blue) on a background with a luminance of about 5 cd/rn '. A cross formed by red light-emitting diodes placed on a small plate attached to the center of the screen was used as a fixation mark. Its onset and offset were controlled by the computer.
Design All variables were manipulated within subjects, and all randomizations were independently carried out for the 2 subjects. Each subject served in 16 experimental blocks: 4 blocks for each of the 4 selection conditions. The order of the 16 blocks was determined such that a 4 x 4 matrix showing the order from left to right, and from top to bottom, formed a Latin square. Each block comprised 5 practice subblocks and 25 experimental subblocks of 10 trials each. In each experimental subblock, the first trial was for warming up. In the following 9 experimental trials, each of the 9 combinations of T and D appeared once in a random order. In summary, each subject served in 3,600 experimental trials: 4 conditions x 4 blocks x 25 experimental subblocks x 9 experimental trials, corresponding to 100 replications of each of the 9 combinations of T and D for each of the 4 selection conditions.
Procedure The experiment was conducted in a semidarkened room. The subject was comfortably seated at a distance of 2 m from the screen, with a light-weight computer-terminal keyboard on his or her lap. Viewing was binocular. The experiment was conducted over several days. A trial. The fixation mark was turned on when the computer was ready for a trial. When adequately fixated, the subject pressed a key to produce an immediate exposure of the stimulus display. The exposure duration was 60 msec. Two seconds after the offset of the stimulus display, the target positions were indicated with purple crosses, equal in size to the stimulus elements. The task was to report as many targets as possible from the stimulus display, ignoring the distractors. The subject typed his or her report on the keyboard, by first pressing the keys corresponding to the letters to be reported-in free order-and then pressing a return key. When the return key was pressed, the reported letters were listed, in purple, at the bottom of the screen. The subject either confirmed the report by pressing one key or, if typing errors were found, pressed another key and typed the corrected report. Instructions. Prior to each block of a selection condition, a display containing the whole stimulus ensemble was presented, with the target set in the upper half of the screen and the distractor set in the lower half of the screen. The subjects were explicitly informed ofthe target set, the distractor set, the selection condition (i.e., the selection criterion and the difference between the targets and the distractors) , and that the identity of elements was chosen at random with replacement. The subjects were instructed that a trial should be initiated only when he or she had carefully fixated. The instruction specified that the identity of a target element should be reported if, and only if, the subject was "pretty sure" that it was correctly identified. The subject was instructed not to report the identity of those elements that were taken as targets by the subject but turned out to be distractors in light of the target position indications. The subject, who was instructed to conduct the 10 trials of each subblock consecutively, was free to take as long a break as desired between subblocks. (The display containing the whole stimulus ensemble was presented before each subblock.) A l S-min break was required after each block of 225 experimental trials. All of these instructions were repeated before each block. Practice. Before starting the experimental sessions, the subject had practice with all of the four selection conditions. In the experiment' each block began with five subblocks of practice with the selection condition. In the first practice subblock, the exposure duration was 120 msec. It was reduced by 20 msec in each of the following three subblocks. Thus, in the penultimate and the final practice subblocks, the exposure duration was 60 msec, as in the experimental subblocks. During the practice, the subject was informed ofthe score (i.e., the number of correctly reported targets) on each trial.
Apparatus The stimulus displays were presented on a SONY CVM-2550E RGB monitor equipped with P-22 fast-decay phosphor. (The time taken for the intensity level to be reduced to II 10 after one flash is I msec for red, 40 usee for green, and 30 usee for blue.) The
Results and Discussion The numbers of erroneously reported elements were relatively small. (Mean number of erroneously reported elements per trial was 0.44 for Subject H,S. and 0.38 for
Stimulus Displays Each stimulus display showed 4 to 12 stimulus elements positioned around the perimeter of an imaginary circle centered on fixation. For each element, the position was drawn at random, without replacement, from 12 possible positions (corresponding to I o'clock, 2 o'clock, ... , and 12 o'clock). Under the experimental viewing conditions, a single element subtended a visual angle of about 0.40 0 vertically and horizontally. The angular distance from the center of an element to the fixation cross was 2.23 0 , and the center-to-center distance between two adjacent possible element positions was 1.16 0 • There were nine possible combinations of the number of targets, denoted by T, and the number of distractors, denoted by D, in the stimulus display. Twas 4, 8, or 12. For T equal to 4, D was 0, 2, 4, 6, or 8. For T equal to 8, D was 0, 2, or 4. For T equal to 12, D was O. The identities of the targets and the distractors were drawn from the respective sets at random with replacement. For the conjunction condition, each distractor in the stimulus display was drawn from either of the two distractor sets with equal probability.
EFFICIENCY OF VISUAL SELECTION Subject l.R.) The following analyses are based only on numbers of correctly reported targets (i.e., scores).
equal to 3 or 4 were too high to be accounted for by binomial distributions. In fact, for Tequal to 8, the observed frequencies for scores equal to 3 or 4, .83 for Subject H.S. and.75 for Subject J.R., far exceeded the maximum probability for 3 or 4 successes (.52) in any binomial distribution with 8 Bernoulli trials, which is obtained when the probability for success is about .44. Likewise, for T equal to 12, the observed frequencies for scores equal to 3 or 4, .83 for Subject H.S. and .79 for Subject J.R., far exceeded the maximum probability for 3 or 4 successes (.47) in any binomial distribution with 12 Bernoulli trials, which is obtained when the probability for success is about .29. These results indicate that (1) when the number of elements was sufficiently small, the report probabilities of elements were independent, but (2) when the number of elements was large, the report probabilities of elements were not independent. Taken together, the results support the assumptions of FIRM that the processing times for the elements are independent, and that there is a STM storage capacity limitation.
Score Distributions Frequencies of scores higher than 4 were very low. Out of 1,600 experimental trials with 8 or 12 targets, Subject H. S. had 62 trials with a score of 5 and 1 trial with a score of 6; Subject J. R. had 19 trials with a score of 5. Figure 2 shows observed score distributions in the whole-report conditions (i.e., the number of distractors equaled zero) collected across all the selection conditions for each subject. The data are fitted both by FIRM+(1), explained later in the text, and by those binomial distributions for which the predicted mean scores are exactly the same as the observed mean scores. The binomial distributions are predicted by independent parallel models without storage capacity limitation. With T (i.e., the number of targets) equal to 4, the fits by the binomial distributions to the observed data were good. However, with Tequal to 8 and 12, there were systematic deviations between the observed score distributions and the binomial distributions for both subjects. First, the observed frequencies for scores greater than 4 were lower than would be predicted by the binomial distributions. Second, the observed frequencies for scores T
>-
Mean Scores The pattern of variations in mean scores was similar for the 2 subjects. Figure 3 shows observed mean scores as functions of D (i.e., the number of distractors) with T
4
8
1 .0
1 .0
1 .0
.5
.5
.5
T
12
4
8
HS
U C CD
:J 0CD
L
1.L
0
CD
e
4
0
0
4
>
-+-' l1j
1 .0
1 .0
.5
.5
8
0
0
12
1 .0
JR
CD
rr:
721
0
.5
Score Figure 2. Observed score distributions [01 in the whole-report conditions (i.e., the number of distractors equaled 0) collected across all the selection conditions for each subject in Experiment 1. The number of targets, T, was 4, 8, or 12. The data are fitted both by FIRM'(l) [unmarked points connected by straight lines] and by the binomial distributions [unmarked points connected by dashed lines] for which the predicted mean scores are exactly the same as the observed mean scores.
722
SHIBUYA
T (i.e., the number of targets) as a parameter in each condition for each subject. (The data are fitted by FIRM+(1), explained later in the text.) Generally, mean scores decreased as D increased. The decrease in mean scores with the increase in D varied with conditions. For both subjects, the effect of D on mean scores was smallest in the duplex condition and greatest in the conjunction condition. The finding that the efficiency of selection was greater in the duplex condition than in the color and class conditions is consistent with Quinlan and Humphrey's (1987) finding in triple conjunction searches that search efficiency became greater as the number of dimensions in which the target and the distractors differed increased.
Fits by FIRM In FIRM, parameter a is proposed as a measure for efficiency of selection. Does the variation in Ci value account for the difference in performance across the selection conditions? Maximum likelihood estimations of the parameter values of FIRM were made for each subject on the basis of observed frequency distributions of scores. (For formulas for computing predictions of FIRM, see Shibuya & Bundesen, 1988.) The fits were computed by a modified version of the program AMOEBA (Press, Flannery, Teukolsky, & Vetterling, 1986), which searches Color
Class
4 HS
2
OJ L 0
0
u
(J)
c
OJ L
Duplex
4
~
D
e
4
8
4
~
iteratively in a multidimensional parameter space using the "downhill simplex method." Because frequencies of scores higher than 4 were very low, as pointed out above, the observed frequencies of scores of 4-6 were combined. As in the study by Shibuya and Bundesen (1988), parameter K (i.e., the capacity of the STM store) was treated as continuous. Predicted values were calculated as weighted averages such that, for example, a value with Kat 3.64 was treated as a mixture of a value with Kat 3 and a value with Kat 4, with a probability of .64 for having Kat 4. In computing the predictions in the conjunction condition, it was assumed, as a first approximation, that all the distractors had the same weight. First, three parameters were estimated for each condition: the capacity K of the STM store; the product of the total processing capacity and the time available for processing, C7; and the efficiency of selection (i.e., the ratio of the weight of a distractor to the weight of a target), Ci. (With a data set from a partial-report experiment in which the exposure duration of the stimulus display is kept constant, the total processing capacity C and the time available for processing 7 cannot be separately estimated.) The estimated parameter values and the goodness-of-fit measures are shown in Table 1. Fits by FIRM were gener-
2
eJ
2
~ 0
4
8
4
2
0
4
~ 0
4
8
4
~ ~ 2
4
4
JR
Conjunction
2
0
0
4
8
4
c
2
~
~
2
~
8
Number of Distractors Figure 3. Observed mean scores (numbers of correctly reported targets) and the fits by FIRM+(I) for each subject in Experiment 1 as a function of the number of distractors with the number of targets as a parameter, for each selection condition. For the observed mean scores, the number of targets was 4 [0), 8 [0), or 12 [0). Unmarked points connected by straight lines (for 4 and 8) and the small. (for 12) represent the fits to the data by FIRM+(l).
EFFICIENCY OF VISUAL SELECTION ally good. Within subjects, estimates for K and Ct varied little with selection condition. For both subjects, the estimates for K agreed with those found in earlier studies (Bundesen et al., 1985; Shibuya & Bundesen, 1988). Estimates for a varied widely with selection condition. Second, because the estimates for K and Cr varied little across the conditions within subjects, another set of parameter values were estimated for each subject by having parameters K and Cr fixed across all the conditions. The estimated parameter values and goodness-of-fit measures are shown in Table I. Considering that the number of free parameters was reduced from 12 to 6 in the second set of fits, the fits were still very good. The estimated parameter values were very close to those produced by the first set of fits. For each subject, the estimate for a was smallest in the duplex condition and largest in the conjunction condition. These results suggest that the difference in partial-report performance across the selection conditions was accounted for by the variation in the value of a single parameter a of FIRM. This means that the claim by Shibuya and Bundesen (1988) that parameter a of FIRM serves as a measure for the efficiency of selection was substantiated.
Model
AN EXTENSION OF FIRM: FIRM> How do the subject's knowledge of selection criterion and his or her intention to give higher priorities to the targets than to the distractors in the independent race to the STM store influence the information processing system? In FIRM, if the subject's intention is reflected, the weight of a target should be greater than the weight of a distractor (i.e., a should be less than I). What is the weight of an element? What kind of a mechanism enables the subject to influence differential assignment of weights to the elements in the visual field? The reasoning advanced by Shibuya and Bundesen (1988) can be restated as follows: The subject's knowledge of the selection condition and his or her intention to pursue the task are reflected in a mechanism that collects evidence for each element from the stimulus display that the element is a target, and for each element, the strength of evidence that the element is a target serves as its weight. In the present article, I postulate that the weight of an element (i.e., the strength of the evidence that the element is a target) is additive. Further, I assume that the internaL representation system has several representation
Table 1 Maximum Likelihood Estimation of Parameter Values of FIRM and FIRM+ in Experiment 1 Parameter Goodness of Fit 01 l;mll %Var Color Duplex Conjunction CT Class M K Subject H.S.
FIRM for a single condition Color 3.64 Class 3.69 Duplex 3.62 Conjunction 3.62 Overall FIRM 3.64 FIRW(I) 3.64 FIRW(2) 3.64
7.(1) 6.07 6.97 6.08
0.21
6.54 6.54 6.54
0.19 0.18 0.18
0.45 0.15 0.54 0.47 0.47 0.47
0.14 0.15 0.15
0.59 0.58 0.58
3 3 3 3 12 6 4 5
-9.64 -10.63 -9.50 -10.62 -40.38 -40.46 -40.46 -40.46
95.33 94.01 88.13 98.05 95.63 95.17 95.13 95.13
3 3 3 3 12 6 4 5
-11.13 -11.22 -11.02 -11.03 -44.40 -44.42 -44.43 -44.42
94.18 98.63 93.41 97.60 96.15 95.97 95.83 95.95
Subject l.R. FIRM for a single condition Color 3.58 Class 3.61 Duplex 3.57 Conjunction 3.62 Overall FIRM 3.59 FIRW(l) 3.60 FIRM+(2) 3.59
4.67 4.42 4.65 4.77
0.68
4.62 4.63 4.62
0.68 0.65 0.67
0.62 0.43 0.74 0.66 0.62 0.65
723
0.44 0.47 0.45
0.70 0.73 0.68 Note- K = capacity of the STM store (elements), CT = product of total processing capacity and time available for processing. 01 = ratio of weight of a distractor to weight of a target. (Parameter ex serves as a measure for the efficiency of selection: The smaIler c< is, the higher the efficiency of selection. The ex values for FIRM+(l) and FIRM+(2) were computed on the basis of the estimated additional weights shown in Table 2.) M = number of free parameters in the estimation. l;mll = mean log likelihood per trial summed across the 9 probability distributions of scores for FIRM with a single condition and across 36 probability distributions of scores for the whole data set. (The fit was obtained by maximizing l;ml1.) %V = percentage of variance in observed mean scores accounted for by the fit.
724
SHIBUYA
dimensions. Except that there is a representation dimension directly corresponding to a well-defined stimulus dimension such as color or alphanumeric class, no further assumptions are made concerning the nature of the dimensions in the internal representation system. FIRM is extended as follows: (1) Every element in the stimulus display gains a basic weight of w, (w, > 0), which is the strength of the evidence that the element is a stimulus element. (2) Given an instruction on the stimulus ensemble and the experimenter-defined selection criterion, the subject sets up a number of critical dimensions in the internal representation system. The selection criterion held by the subject is a set of representations of the target values (features), one in each critical dimension. (3) For each element, a set of representations, one in each critical dimension, is formed. And (4) each element gains an additional weight in each critical dimension. The additional weight in a critical dimension is the degree to which the representation of the element matches the target representation in that dimension. The weight of an element is the sum of its basic weight and its additional weights, one in each critical dimension. For the conditions in Experiment 1, the assumption of weight additivity in the extension of FIRM, FIRM+, is applied as follows: When the dimension of color is used in the definition of the selection criterion (i.e., in the color, duplex, and conjunction conditions), an element in the target color gains an additional weight of a,w* (at ~ 0). When the dimension of alphanumeric class is used in the definition of the selection criterion (i.e., in the class, duplex, and conjunction conditions), an element of the target class gains an additional weight of a2W* (a2 ~ 0). When both the dimension of color and the dimension of alphanumeric class are used in the definition of the selection criterion (i.e., in the duplex and conjunction conditions), there mayor may not be a dimension in the internal representation system other than those directly corresponding to the experimenter-defined stimulus dimensions, that is, a dimension corresponding to the combination of color and alphanumeric class. An element in the target color and of the target class gains an additional weight of cw* (c ~ 0). The weight of a distractor, wo, and the weight of a target, Wj, in each condition of Experiment 1 under these assumptions are given in the Appendix. In applications of FIRM +, it is the ratios between the weights of elements, rather than the absolute values of weights, that matter. No generality is lost by setting the value of the basic weight, w*, to 1. In this article, parameters aj, a2, and c are referred to simply as additional weights, rather than relative additional weights. In the color, class, and duplex conditions, each distractor receives no additional weight, that is, the weight of a distractor is equal to the basic weight. In the color and class conditions, each target gains an additional weight in only one dimension. In the duplex condition, on the other hand, three additional weights, aj, a2, and c, contribute to the weight of each target. Thus, a (the ratio
of the weight of a distractor, Wo, to the weight of a target, w.) should be smaller in the duplex condition than in the color condition and the class condition. The estimates for a in Table 1 satisfied this constraint. In the conjunction condition, each target gains the same additional weights as do the targets in the duplex condition, but each distractor gains an additional weight in the dimension in which it has the target value. Thus, a values should be greater in the conjunction condition than in the duplex condition. The estimates for a in Table 1 also satified this constraint. On the basis of these constraints on the relationship in a values across the conditions, FIRM+ predicts that the efficiency of selection is higher in the duplex condition than it is in the color, class, and conjunction condition. Note that the predictions of FIRM +are also consistent with Quinlan and Humphreys's (1987) finding in triple conjunction searches that search efficiency became higher as the number of dimensions in which the target and the distractors differed increased. Additivity of weights was also assumed in TVA, a generalization of FIRM, by Bundesen (1990). The scope of TVA is broad, and FIRM+ might be regarded as a special case of TV A. However, many implications of TVA have not yet been tested (cf. Shibuya, 1991b). For this reason, I prefer to present FIRM+as an extension of FIRM equipped with the weight additivity. The assumption of weight additivity was applied by Bundesen (1990) to effects of consistent practice on the efficiency of selection, but it has not been applied to the efficiency of selection in either the duplex condition or the conjunction condition.
Fits by FIRM+ to Data From Experiment 1 Maximum likelihood fits of FIRM +were computed for each subject on the basis of the probability distributions of scores in all four conditions. To simplify predictions for the conjunction condition, every distractor in this condition was treated as if it had a weight equal to the average for the two distractor types. Two sets of parameter estimations were made. In the first estimation, FIRM+(I), parameter c (the additional weight in the representation dimension corresponding to the combination of color and alphanumeric class) was fixed at O. In the second estimation, FIRM+(2), parameter c was set free. Table 2 shows the estimated parameter values ofFIRM+. The goodnessof-fit measures and the efficiency of selection a (i.e., the ratio of the weight of a distractor to the weight of a target) computed for each condition on the basis of the estimated values of additional weights are shown in Table I. The fits by both FIRM+(I) and FIRM+(2) were generally very good. The estimates for K and CT and the a values computed on the basis of the estimates for the additional weight parameters aj, a2, and c were very close to those estimates in the fits by FIRM. Note that the number of free parameters was reduced from 6 in the fits by FIRM to 4 in the fits by FIRM+(1) and 5 in the fits by FIRM+(2). The gain in the goodness of fit obtained by
EFFICIENCY OF VISUAL SELECTION Table 2 Maximum Likelihood Estimation of Parameter Values of FIRM' in Experiment I Parameter Additional Weight Model FIRM-(I) FIRM'(2)
CT
K
3.64 3.64
a,
Subject H.S. 4.45 6.54 4.45 6.54
a,
('
1.14 1.14
[0.00] 0.00
Subject J .R. 360 4.63 0.55 0.60 (0.00] FIRM-(1) FlRM'(2) 3.59 4.62 0.49 0.54 0.20 Note-K = capacity of the STM store (elements). CT = product oftotal processing capacity and time available for processing. a" a,. and c = additional weights in the representation dimensions of color, alphanumericclass, and the combination of color and alphanumeric class, respectively. (The c value was fixedat 0 in the fits by FIRM'O). These additional weights underlie the ex values of FlRM'(l) and FIRM'(Z) shown in Table I. See the Appendix.)
setting parameter c free was negligible. For each subject, the predictions by the fits of FIRM+(l) for score distributions in the whole-report conditions are shown in Figure 2; the predicted mean scores are shown in Figure 3. The good fits gave strong support to the assumption of FIRM+ that the parameters that determine the efficiency of selection in the color and class conditions also underlie the efficiency of selection in the duplex and conjunction conditions. The high efficiency of selection in the duplex condition and the low efficiency of selection in the conjunction condition were both quantitatively accounted for by assuming that each element gains an additional weight appropriate for its value in each critical dimension. A further test of FIRM+ seemed to be warranted.
EXPERIMENT 2 The fits by FIRM and FIRM+ in Experiment 1 were encouraging. Experiment 2 was conducted to test the generality of the results of Experiment 1. Further, Experiment 2 was designed to allow a detailed test of the predictions by FIRM and FIRM+ for performance in the conjunction condition: The combination of the numbers of distractors from the two distractor sets was systematically varied. There were 25 combinations of the number of targets and the numbers of distractors from the two distractor sets. Because of this large number of display conditions in the conjunction condition, about half of the total number of trials belonged to the conjunction condition. There were other, minor differences in procedure from that of Experiment 1: First, the stimulus displays were terminated by a masking display. Second, the target positions were not indicated. Finally, feedback on the report was given on experimental trials.
725
Method Subjects Four subjects (H.A .. M.M .. H.R .. and R.B.) participated. They were all Danish males, between the ages of 18 and 33 years, with normal or corrected-to-normal visual acuity and normal color vision. They were naive with respect to the purpose of the experiment. Subject R.B. was paid by the hour for participating; the others were volunteers. Stimulus Elements and Selection Conditions The color of each element was either yellow or green (approximate Munsell notations were lOY 9/10 for yellow and lOGY 8.5/6 for green). Subjectively, the discriminability between these two colors was higher than that between the two colors used In Experiment I. The identity of each stimulus element belonged to either a set of capital letters comprising 20 consonants (B. C, D, F. G. H, J, K, L, M, N, P, Q, R, S, T, Y, W. X, and Z) or a set of nine digits (I, 2, 3, 4, 5, 6, 7, 8, and 9). As in Experiment I, there were four selection conditions: a color condition, a class condition, a duplex condition, and a conjunction condition. In all of the four conditions, the yellow letters constituted the target set. In the color condition, the green letters constituted the distractor set. In the class condition, the yellow digits constituted the distractor set. In the duplex condition, the green digits constituted the distractor set. Finally, in the conjunction condition, the green letters constituted the set of color distractors and the yellow digits constituted the set of class distractors, Stimulus Displays and Masking Display Each stimulus display showed I to 10 stimulus elements positioned around the perimeter of an imaginary circle centered on a white fixation cross. For each element, the position was drawn at random, without replacement, from 12 possible positions (corresponding to I o'clock, 2 o'clock, ... , and 12 o'clock). The identities of the targets and the distractors were drawn from the respective sets at random with replacement. The fixation cross was constructed in a 30 x 30 pixel matrix, and presented in white. Each stimulus character was constructed in a 30 x 24 pixel matrix, after a Helvetica character set. The masking display showed 12 identical patterns in white, one in each of the 12 possible positions for the stimulus elements. The pattern was generated by superimposing 0, +, x, and 0 equal in size to the stimulus elements. Under the experimental viewing conditions, a single element subtended a visual angle of about 0.53 0 vertically and about 0.42 0 horizontally. The angular distance from the center of an element to the fixation point was 2.12 0 , and the center-to-center distance between two adjacent possible element positions was 1.09 0 • In the single-distractor-set conditions (i.e., the color, class, and duplex conditions), there were eight possible combinations of the number of targets, denoted by T, and the number of distractors, denoted by D, in the stimulus display. Twas I, 4, or 7. For T equal to I or 4, D was 0,3, or 6. For Tequal to 7, D was 0 or 3. In the conjunction condition, there were 25 possible combinations of the number of targets, T, the number of color distractors, denoted by D" and the number of class distractors, denoted by D,. They are summarized in Table 3. Design All variables were manipulated within subjects, and all randomizations were independently carried out for each subject. Each subject served in 18 experimental blocks: 3 blocks for each of the three single-distractor-set conditions and 9 blocks for the conjunction condition. The order of the 18 blocks was determined as follows: The conjunction condition was conducted every other block, and the
726
SHIBUYA
Table 3 The Combinations of Number of Targets (T), Number Color Distractors (D.), and Number of Class Distractors in the Conjunction Condition of Experiment 2 T D,+D, (D" D,) (0,0) 1 0 (3,0) (2,1) (1,2) (0,3) 3 (4,2) (3,3) (2,4) (6,0) 6 (0,0) 4 0 (3,0) (2,1) (1,2) (0,3) 3 (6,0) (4,2) (3,3) (2,4) 6 (0,0) 7 0 (3,0) (2,1) (1,2) (0,3) 3
of (D ,)
(0,6) (0,6)
3 x 3 matrix showing the order of the three single-distractor-set conditions, from left to right and from top to bottom, formed a Latin square. Each block comprised two experimental subblocks. The first trial in each subblock was for warming up. In the single-distractor-set conditions, a subblock had 72 experimental trials: 9 replications of each of the 8 combinations of T and D in a random order. In the conjunction condition, a subblock had 75 experimental trials: 3 replications of each of the 25 combinations of T, D" and D,. In summary, each subject served in 2,646 experimental trials: 3 single-distractor-set conditions x 3 blocks X 2 subblocks
X
72 experimental trials
+ I conjunction condition X
9 blocks x 2 subblocks x 75 experimental trials,
corresponding to 54 replications of each of the display conditions for each of the 4 selection conditions. Apparatus The stimulus displays were presented on a Tektronix 4107 computer display terminal equipped with P-22 phosphor, using a Digital Equipment Corporation PDP-ll/73 computer as a host. The refresh rate (raster and image frequency) was 60 Hz. The luminance was 5 cd/m' for the background, 80 cd/m ' for the stimulus elements, and 85 cd/m ' for the mask patterns. Procedure The experiment was conducted in a semidarkened room. The subject was comfortably seated at a distance of 1.2 m from the screen, with a light-weight computer-terminal keyboard on his lap. Viewing was binocular. The subject had practice with all of the four selection conditions on 2 separate days before starting the experimental sessions. The experiment was conducted in 6 sessions of 3 blocks each, on separate days. Each experimental block was preceded by about 30 trials of practice with the selection condition. The instructions were essentially the same as in Experiment 1. The subject pressed a key when he was ready for a trial. When adequately fixated, the subject pressed the key again to produce an immediate exposure of the stimulus display. The exposure duration was 133 msec (8 raster refreshings). The stimulus display was replaced with the masking display, which was presented for 500 msec. The task was to report as many targets as possible from the stimulus display while ignoring the distractors. The subject typed his response on the keyboard. The report procedure was the same as in Experiment 1. When the subject confirmed the report, feedback was given: Yellow squares were presented under the correctly reported elements.
Results and Discussion The number of erroneously reported elements was small. (Mean number of erroneously reported elements per trial was 0.15 for Subject H.A., 0.30 for Subjects M.M. and H.R., and 0.13 for Subject R.B.) As in Experiment 1, the following analyses are based only on the probability distributions of the numbers of correctly reported targets (i.e., scores). Score Distributions Frequencies of scores higher than 4 were very low. Out of 594 experimental trials with 7 targets, Subjects H.A. and M.M. had 3 trials with a score of 5, Subject H.R. had 14 trials with a score of 5 and 1 trial with a score of 6; Subject R.B. had I trial with a score of 5. With T (i.e., the number of targets) equal to 7 and D (i.e., the number of distractors) equal to 0, there were the same systematic deviations as in Experiment 1 between the observed score distributions and those binomial distributions for which the predicted mean scores were exactly the same as the observed mean scores, for all the subjects: (I) The observed frequencies for scores greater than 4 were lower than would be predicted by the binomial distributions. (2) The observed frequencies for scores equal to 3 or 4 were too high to be accounted for by binomial distributions. The observed frequencies for scores equal to 3 or4 (.69 for H.A., .64 for M.M., .78 for H.A., and .67 for R.B.) exceeded the maximum probability for 3 or 4 successes (.55) in any binomial distribution with 7 Bernoulli trials, which is obtained when the probability for success is .5. Again, these results support the assumption of FIRM that the score is limited by STM storage capacity. Mean Scores The pattern of variations in mean scores was similar across the subjects. Observed mean scores are shown in Figure 4 for each subject. For the color, class, and duplex conditions, observed mean scores are plotted as functions of D (i.e., the number of distractors) with T (i.e., the num-
Figure 4. (Opposite page) Observed mean scores (numbers of correctly reported targets) and the fits by FIRM+(2) for each subject in Experiment 2, for each condition. For the color, class, and duplex conditions, the observed and predicted mean scores are plotted as functions of the number of distractors, D. For the observed mean scores, the number of targets, T, was 1 (0), 4 (0), or 7 (0). Unmarked points connected by straight lines represent the fits to the data by FIRM+(2). For the conjunction condition, the mean scores are plotted as a function of the number of class distractors, D with the combinations of T and the total number of distractors," D, as a parameter. For the observed mean scores, the (T ,D) combinations are (1,0) [t», (1,3) (0), (1,6) (0), (4,0) (6), (4,3) (0), (4,6) (0), (7,0) [v), or (7,3) (0). The fits to the data by FIRM+(2) are represented by unmarked points connected with straight lines, a small ~ for (1,0), a small .II. for (4,0), and a small \1 for (7,0).
EFFICIENCY OF VISUAL SELECTION Color
HA 2
Class
~ I2J
3
Conjunction
Duplex
2
6
I2J
3
6
I2J
8
o
3
6
I2J
3
6
I2J
3
6
I2J
3
6
4---~
MM
2~
2
o
0
L:I
B
0
I2J
3
6
~
Q)
L
o U
(f)
I2J
3
6
Ql
3
6
o
o
HR
2~ Ql
3
6
I2J
4
3
2
6
~ I2J
3
6 4
.-r--r---,...,
RB
~-~-,...,
o
~ 2
2 []
8
€I
I2J
3
6
D
IZI
3 D
6
o
EI
0
I2J
3
6
D
I2J
3
02
6
727
728
SHIBUYA
ber of targets) as a parameter. (The data are fitted by FIRM+(2).) Mean scores decreased as D increased. Among these single-distractor-set conditions, mean scores when D > 0 were greatest in the duplex condition and smallest in the class condition. For the conjunction condition, observed mean scores are plotted as a function of D 2 (i.e., the number of class distractors) with T (i.e., the number of targets) and D, + D2 (i.e., the total number of distractors) as parameters. (The data are fitted by FIRM+(2).) Generally, with D, + D 2 fixed, mean scores decreased as D, (i.e., the number of color distractors) decreased and D 2 (i.e., the number of class distractors) increased. These results suggest that the effect of a class distractor was greater than that of a color distractor. Fits Maximum likelihood estimations of the parameter values of FIRM and FIRM+ were conducted for each subject on the basis of observed frequency distributions of scores. As in Experiment 1, observed frequencies of scores 4-6 were combined. Fits by FIRM. The parameter values of FIRM were estimated for each subject. The treatment used to compute the predictions in the conjunction condition was different from that used in Experiment 1 in that the effects of D, (i.e., the number of color distractors) and the effects of D 2 (i.e., the number of class distractors) were treated separately. For the conjunction condition, it was assumed that the targets have a common weight, w" the color distractors have a common weight, wo', and the class distractors have a common weight, wo". The ratio wo'tw. is denoted by a', and the ratio wo"tw, is denoted by a". When there are T targets, D, color distractors, and D 2 class distractors in the stimulus display, the processing rate of a target is given by C/(T + a'D, + a" D 2 ) , the processing rate of a color distractor is given by a' C/(T + a'D I + a" D 2 ) , and the processing rate of a class distractor is given by a" C/(T + a'D, + a" D 2 ) , where C is the total processing capacity. First, maximum likelihood estimates for the parameters were computed separately for each condition. Table 4 shows the estimated parameter values and the goodnessof-fit measures. Within subjects, the estimates for K (i.e., the capacity of the STM store) and CT (i.e., the product of the total processing capacity and the time available for processing) varied little with selection conditions. The estimates for K were similar to those obtained in Experiment 1. Second, for each subject, maximum likelihoodestimates for the parameters were computed with K and CT fixed across all the conditions. Table 4 shows the estimated parameter values and goodness-of-fit measures. Considering that the number of free parameters was reduced from 13 to 7 in the second set of fits, the fits were still very good. The estimated parameter values were very close to those produced by the first fits. These results suggest that one of the results in Experiment 1 was replicated: The difference in partial-report performance across the
selection conditions was accounted for by the variation in the value of parameter a of FIRM. Fits by FIRM+. In the fits by FIRM with K and CT fixed across the selection conditions, the estimates for a satisfied the constraints by FIRM+: For any subject, the estimate for a was smaller for the duplex condition than for the color, class, and conjunction conditions. Table 5 shows the maximum likelihood estimates for the parameters of FIRM+(l) (with parameter c fixed at 0) and FIRM+(2) (with parameter c set free). The a values computed on the basis of the estimated additional weights and the goodness-of-fit measures are shown in Table 4. The goodness-of-fit measures in Table 4 indicate that, for all the subjects, the fits by FIRM+(l) were clearly poorer than the fits by FIRM. Within subjects, the estimates for CTand the computed a values in FIRM+(I) were quite different from those in the fits by FIRM. Because parameter c, the additional weight in the representation dimension corresponding to the combination of color and alphanumeric class, is fixed at 0 in FIRM+(l), the weights of the elements in the conjunction condition must satisfy the following constraint: where wo' is the weight of a color distractor, wo" is the weight of a class distractor, WI is the weight of a target, and w, is the basic weight (cf. the Appendix). This means that w" + a" = -wo + _0_ f
a'
w,
w,
~ 1.
For every subject, the estimates for a' and a" in the fits by FIRM violated this constraint. To remove this constraint, it is necessary to set parameter c free, rather than fixing it at 0, that is, to assume a representation dimension corresponding to the combination of color and alphanumeric class. The goodness-of-fit measures in Table 4 indicate that considerable gain in goodness of fit was obtained by setting parameter c free for all the subjects. Considering that the number of free parameters was reduced to 5 in the fits by FIRM+(2) from 7 in the fits by FIRM, the fits by FIRM+(2) were still very good. Within subjects, the estimates for CT and the a values computed on the basis of the estimated additional weights in FIRM+(2) were very close to the estimates for CTand a by FIRM. Mean scores predicted by the fits of FIRM+(2) for each subject are shown in Figure 4. Experiment 2 replicated the other main result of Experiment 1: The extension of FIRM, FIRM+, gave accurate quantitative accounts for the relationship in performance among the four selection conditions. Furthermore, FIRM+(2) gave detailed accounts for the variations in performance in the conjunction condition with the variation in the combination of number of color distractors and number of class distractors. There was one difference in the results from Experiment 1. In Experiment 1, the data were accounted for with parameter c fixed at O. In Experiment 2, it was neces-
EFFICIENCY OF VISUAL SELECTION Table 4 Maximum Likelihood Estimation of Parameter Values of FIRM and FIRM+ in Experiment 2 Parameter ex M
Goodness of Fit %Var EmU
3 3 3 4 13 7 4 5
-6.45 -7.05 -5.92 -21.93 -41.34 -41.44 -42.02 -41.45
98.45 98.88 99.11 98.51 98.72 98.39 96.76 98.40
3 3 3 4 13 7 4 5
-6.38 -7.24 -6.22 -21.36 -41.20 -41.39 -41.82 -41.45
99.27 95.08 99.76 96.93 97.75 97.18 96.13 97.10
3 3 3 4 13 7 4 5
-6.40 -6.46 -5.99 -22.65 -41.51 -41.61 -41.81 -41.63
99.01 99.17 99.40 98.88 99.11 98.88 98.55 98.91
3 3 3 4 13 7 4 5
-5.54 -6.37 -5.57 -20.07 -37.55 -37.78 -38.78 -37.79
98.06 98.45 97.19 97.65 97.87 97.17 94.23 97.10
Conjunction Model
K
Cr
Color
Class
Duplex
Color
Class
Subject H.A. FIRM for a single condition 5.33 Color 3.41 4.40 Class 3.44 5.30 Duplex 3.33 4.66 Conjunction 3.35 Overall 4.87 FIRM 3.38 FIRM+(l) 5.20 3.43 FlRM+(2) 4.87 3.38
0.20 0.39 0.13
0.16 0./4 0.17
0.43 0.46 0.45
0.11 0.12 0.09
0.17
0.47
0.19 0.27 0.20
0.50 0.86 0.51
Subject M.M. FIRM for a single condition 4.40 Color 3.24 4.18 Class 3.36 4.82 Duplex 3.40 4.25 Conjunction 3.12 Overall 4.40 FIRM 3.27 FIRM+(I) 4.65 3.30 FIRM +(2) 4.39 3.27
0.16 0.36 0.08
0.16 0.10 0.11
0.37 0.43 0.40
0.05 0.08 0.06
0.10
0.57
0.13 0.20 0.16
0.62 0.89 0.57
Subject H.R. FIRM for a single condition 5.25 Color 3.44 5.88 Class 3.43 6.18 Duplex 3.55 5.04 Conjunction 3.54 Overall 5.49 FIRM 3.51 FlRM+(I) 5.71 3.54 FIRM+(2) 5.50 3.51
0.25 0.43 0.26
0.29 0.28 0.31
0.42 0.43 0.44
0.21 0.21 0.18
0.36
0.50
0.39 0.48 0.40
0.54 0.72 0.56
Subject R.B. FIRM for a single condition 5.34 Color 3.25 4.87 Class 3.24 5.51 Duplex 3.36 4.50 Conjunction 3.16 Overall 4.97 FIRM 3.25 FlRM+(I) 5.41 3.30 FIRM+(2) 4.98 3.25
0.12 0.38 0.06
0.10 0.08 0.10
0.40 0.42 0.39
0.03 0.07 0.05
0.09
0.38
0.13 0.17 0.12
0.44 0.90 0.45
Note-K = capacity of the STM store (elements). Cr = product of total processing capacity and time available for processing. ex = ratio of weight of a distractor to weight of a target. (Parameter ex serves as a measure for the efficiency of selection: The smaller ex is, the higher the efficiency of selection. The ex values for FlRM+(1) and FIRM+(2) were computed on the basis of the estimated additional weights shown in Table 5.) M = number of free parameters in the estimation. EmU = mean log likelihood per trial summed across the 8 probability distributions of scores for FIRM with the color condition, the class condition, and the duplex condition, across 25 probability distributions with the conjunction condition, and across 49 probability distributions of scores for the whole data set. (The fit was obtained by maximizing EmIl.) %V = percentage of variance in observed mean scores accounted for by the fit.
729
730
SHIBUYA
target value in a dimension in which the targets and the distractors differ. Accurate quantitative accounts for the relationship with respect to efficiency of selection among Parameter the different conditions, including duplex and conjuncAdditional Weight tion conditions, for both experiments were provided by a, K CT Model c a2 FIRM+. In the following, I discuss the nature of the internal representation system. Subject H.A. FIRM+ assumes that for a well-defined stimulus dimenFIRM+(I) 3.43 5.20 5.96 1.15 [0.00] 1.24 FIRW(2) 3.38 4.87 4.77 4.34 sion such as color or alphanumeric class, there is a corresponding dimension in the internal representation sysSubject M. M. tem, an assumption that is similar to those of the feature FIRW(I) 3.30 4.65 9.47 1.35 [0.00] 1.48 FIRW(2) 3.27 4.39 7.93 integration theory of attention (FIT) of Treisman et al. 5.27 (Treisman, 1988, 1990; Treisman & Gelade, 1980; TreisSubject H.R. man & Gorrnican, 1988; Treisman & Sato, 1990; TreisFIRM+(I) 2.52 1.35 3.54 5.71 [0.00] FIRM+(2) 3.51 2.19 1.28 5.50 1.23 man, Sykes, & Gelade, 1977)and the guided search model (OS) of Cave and Wolfe (1990). This assumption was inSubject R.B. spired by findings in neurophysiology suggesting that FIRW(I) 3.30 11.48 1.38 [0.00] 5.41 FIRW(2) 3.25 4.98 8.70 1.58 10.47 stimulus dimensions of visual objects, such as orientation, color, spatial frequency, and movement, are analyzed in Note-K = capacity of the STM store (elements). CT = product of total processing capacity and time available for processing. a" a., and separate areas in the cortex (for a review, see Desimone c = additional weights in the representation dimensions of color, al& Ungerleider, 1989). phanumeric class, and the combination of color and alphanumeric class, Both FIT and OS assume that no combination of stimrespectively. (The c value was fixed at 0 in the fits by FIRM+(I). These additional weights underlie the Oi values of FIRM+(I) and FIRM+(2) ulus dimensions has a corresponding dimension in the inshown in Table 4. See the Appendix.) ternal representation system. This assumption was based on the early interpretation of the findings in neurophysiology that, for each feature (e.g., red) in each stimulus dimension (e.g., color), there is a detector specialsary to set parameter c free for all the subjects, which ized for that feature alone. This interpretation led to the means that it was necessary to assume a representation reasoning: "If every possible conjunction [of features] had dimension corresponding to the combination of color and to be directly sensed by its own specializeddetectors, there alphanumeric class. would quickly be a combinatorial explosion" (Treisman & Sato, 1990, p. 459). FIRM+ does not make any commitment concerning GENERAL DISCUSSION whether or not there are dimensions in the internal repThe fixed-capacity independent race model (FIRM) of resentation system that correspond to combinations of Shibuya and Bundesen (1988) was further tested in two stimulus dimensions. This question was left to empirical precued partial-report experiments with four selection investigations. In Experiment I, good fits were obtained conditions. The observed score distributions in both ex- with parameter c, the additional weight in the dimension periments supported the assumptions of FIRM that the corresponding to the combination of color and alphanuprocessing times of the elements are independent, but that meric class, set at O. In Experiment 2, the efficiency of the score is limited by STM storage capacity. The within- selection in the conjunction condition was too high to be subject difference in performance across the different accounted for without assuming a representation dimenselection conditions was accounted for by the variation sion corresponding to the combination of color and alin the value of a single parameter of FIRM, lX, which is phanumeric class. When parameter c was set free the ratio of the weight of a distractor to that of a target. (FIRM+(2», the estimates for c were quite large. The two experiments differed in terms of the proporHowever, like the two earlier parallel models by Rumelhart (1970) and Townsend (1981), FIRM does not pro- tion of conjunction trials among all trials: In Experivide a detailed explanation for the mechanism that makes ment I, the proportion was one-fourth; in Experiment 2, the ratio of the weight of a distractor to that of a target it was one-half. This difference may possibly underlie the differ among different selection conditions. finding that performance on conjunction trials was more As an attempt to provide an account for how individu- efficient in Experiment 2 than in Experiment I. Another als' knowledge of the current relevance makes the weight difference between the two experiments lies in the subratio between a distractor and a target differ among dif- jective similarity between the two colors: The colors used in Experiment I were subjectively more similar than were ferent selection conditions, FIRM was further extended. An extension of FIRM, FIRM+, assumes that the inter- those in Experiment 2. Thus, the difference in the results nal representation system has a number of dimensions and between the two experiments is consistent with Wolfe, that each element gains an additional weight if it has the Cave, and Franzel's (1989) finding that, when two colors Table 5 Maximum Likelihood Estimation of Parameter Values of FIRM+ in Experiment 2
EFFICIENCY OF VISUAL SELECTION used in conjunction search are highly dissimilar, some subjects are highly efficient in conjunction search. The present results suggest that, at least in some cases, there are dimensions in the internal representation system that correspond to combinations of stimulus dimensions. Does this mean that our information processing system is threatened by a combinatorial explosion? It would be instructive to note one recent finding in neurophysiology. Tanaka, Saito, Fukada, and Morita (1991) reported that some cells in the inferotemporal cortex of anesthetized macaque monkeys responded selectively to combinations of shape and color or texture (e.g., a green star). It would also be instructive to note that the interpretation of response selectivity of cells in neurophysiology has developed. It has been recognized that cells at all levels of the visual system do not respond in an all-or-none fashion to one specific feature, but rather that cells give graded, or tuned, responses to various features (see Desimone & Ungerleider, 1989). The current interpretation is that any feature is coded not by a specialized detector, but by a combination of cells, each having its own graded response property (population coding). Given that any simple stimulus feature is coded by a combination of cells with different response properties, it does not seem odd to assume that combinations of stimulus features can be coded by combinations of cells with different response properties. It seems plausible to assume that the internal representation system is dynamic and flexible: When the subject receives consistent practice with a selection condition, as in Experiment 2, he or she might be able to develop, at least temporarily, a representation of the combination of stimulus features. In conclusion, the difference in precued partial-report performance across the different selection conditions within subjects was accounted for by the variation in the value of a single parameter, a, of the fixed-capacity independent race model (FIRM) of Shibuya and Bundesen (1988). An extension of FIRM, FIRM+, provided accurate quantitative accounts for the relationship with respect to efficiency of selection among the different conditions, including duplex and conjunction conditions. These results suggest the generality of FIRM+ as a theory of visual selection. REFERENCES BUNDESEN, C. (1987). Visual attention: Race models for selection from multielement displays. Psychological Research, 49, 113-121. BUNDESEN, C. (1990). A theory of visual attention. Psychological Review, 97, 523-547. BUNDESEN, C., PEDERSEN, L. F., & LARSEN, A. (1984). Measuring efficiency of selection from briefly exposed visual displays: A model for partial report. Journal of Experimental Psychology: Human Perception & Performance, 10, 329-339. BUNDESEN, C., SHIBUYA, H., & LARSEN, A. (1985). Visual selection from multielement displays: A model for partial report. In M. I. Posner & O. S. M. Marin (Eds.), Attention and performance IX (pp. 631649). Hillsdale. NJ: Erlbaum. CAVE, K. R., & WOLFE, J. M. (1990). Modeling the role of parallel processing in visual search. Cognitive Psychology, 22, 225-271.
731
DESIMONE. R., & UNGERLEIDER, L. (1989). Neural mechanisms of visual processing in monkeys. In F. Boller & J. Grafman (Eds.), Handbook of neuropsychology (Vol.2, pp. 631-649). Hillsdale, NJ: Erlbaum. LUCE, R. D. (1959). Individual choice behavior. New York: Wiley. Lucr , R. D. (1963). Detection and recognition. In R. D. Luce, R. R. Bush, & E. Galanter (Eds.), Handbook of mathematical psychology (Vol. I, pp. 103-189). New York: Wiley. PRESS, W. H., FLANNERY, B. P., TEUKOLSKY, S. A., & VETTERLING, W. T. (1986). Numerical recipes: The art ofscientific computing. Cambridge: Cambridge University Press. QUINLAN, P. T., & HUMPHREYS, G. W. (1987). Visual search for targets defined by combinations of color, shape, and size: An examination of the task constraints on feature and conjunction searches. Perception & Psychophysics, 41, 455-472. RUMELHART, D. E. (1970). A multicomponent theory for the perception of briefly exposed visual displays. Journal ofMathematical Psychology, 7, 191-218. SHIBUYA, H. (l99la). Comparison between stochastic models for visual selection. In I.-P. Doignon & J.-c. Falmagne (Eds.), Mathematical psychology: Current developments (pp. 337-356). New York: Springer-Verlag. SHIBUYA, H. (l99Ib). Studies on visual selection: Empirical investigations and stochastic modeling. Unpublished doctoral dissertation, University of Copenhagen. SHIBUYA, H., & BUNDESEN, C. (1988). Visual selection from multielement displays: Measuring and modeling effects of exposure duration. Journal of Experimental Psychology: Human Perception & Performance, 14, 591-600. SPERLING, G. (1960). The information available in brief visual presentations. Psychological Monographs, 74, 1-29. SPERLING, G. (1963). A model for visual memory tasks. Human Factors,S, 19-31. SPERLING, G. (1967). Successive approximations to a model for shortterm memory. Acta Psychologica, 27, 285-292. TANAKA, K., SAITO, H., FUKADA, Y., & MORITA, M. (1991). Coding visual images of objects in the inferotemporal cortex of the macaque monkey. Journal of Neurophysiology, 66, 170-180. TOWNSEND, J. T. (1981). Some characteristics of visual whole report behavior. Acta Psychologica, 47, 149-173. TOWNSEND, J. T., & ASHBY, F. G. (1982). Experimental test of contemporary mathematical models of visual letter recognition. Journal of Experimental Psychology: Human Perception & Performance, 8, 834-864. TOWNSEND, J. T., & ASHBY, F. G. (1983). Stochastic modeling of elementary psychological processes. Cambridge: Cambridge University Press. TOWNSEND, J. T., & LANDON, D. E. (1983). Mathematical models of recognition and confusion in psychology. Mathematical Social Sciences, 4, 25-7 J. TREISMAN, A. M. (1988). Features and objects: The 14th Bartlett Memorial Lecture. Quarterly Journal ofExperimental Psychology, 4OA, 201-237. TREISMAN, A. M. (1990). Variations on the theme of feature integration: Reply to Navon (1990). Psychological Review, 97, 460-463. TREISMAN, A. M., & GELADE, G. (1980). A feature integration theory of attention. Cognitive Psychology, 12, 97-136. TREISMAN, A. M., & GORMICAN, S. (1988). Feature analysis in early vision: Evidence from search asymmetries. Psychological Review, 95, 15-48. TREISMAN, A. M., & SATO, S. (1990). Conjunction search revisited. Journal of Experimental Psychology: Human Perception & Performance, 16, 459-478. TREISMAN, A. M., SYKES, M., & GELADE, G. (1977). Selective attention and stimulus integration. In S. Domic (Ed.), Attention and performance VI (pp. 333-361). Hillsdale, NJ: Erlbaum. VON WRIGHT, J. M. (1968). Selection in visual immediate memory. Quarterly Journal of Experimental Psychology, 20, 62-68. VON WRIGHT, J. M. (1970). On selection in visual immediate memory. Acta Psychologica, 33, 280-292. WOLFE, J. M., CAVE, K. R., & FRANZEL, S. L. (1989). Guided search:
732
SHIBUYA
An alternative to the feature integration model for visual search. Journal ofExperimental Psychology: Human Perception & Performance, 15, 419-433. NOTES I. The total processing capacity C is assumed to be dependent not only on individuals but also on the stimulus variables, such as the intensity and the contrast. 2. Suppose there are T targets (T > 0) and D distractors (D > 0) in the stimulus display. Suppose further that processing of an element has just been completed, and that the number of already processed targets is T' (0 :5 T' :5 T) and the number of already processed distractors is D' (0 :5 D' :5 D). Then, the expected interval before the next processing completion of an element, E(Y), is given by (T +aD) E(Y) = C [(T- T')
+
Under the assumptions of FIRM., the weight of each element in the selection conditions of Experiments 1 and 2 is specified as follows. The color condition: { a distractor: a target:
Wo
w.
WI
w.(l +a l)
The class condition: { a distractor: a target:
w*
Wo
=
WI
=w.(l +a2)
The duplex condition:
a(D-D')] '
where C is the total processing capacity, and a is the ratio of the weight of a distractor to the weight of a target. Thus, E(Y) increases as T' and D' increase. 3. It was assumed that the processing of all the elements from a stimulus display begins t, msec after the onset of the stimulus, and continues until either (I) the STM store is filled with elements or (2) t 2 msec have elapsed after the offset of the stimulus display. The difference between t, and t i, t, t«, is denoted by to. r
APPENDIX
{ a distractor: a target:
Wo
w.
w,
w.(l +a , +a2+c)
The conjunction condition: a color distractor: w o ' (
w.(l +a2)
a class distractor: wo" = w.(l +a l) a target:
(Manuscript received July 16, 1992; revision accepted for publication April 28, 1993.)
WI
w.(l+al+a2+ c)