likely to lead to all nodes receiving the flooded data in the least time. ... high bit-rates against the larger number of nodes likely to receive low bit-rates. ..... not a concern in these networks and all the nodes are assumed to be always ...... Each node operates at a fixed power level, on a single channel, with an omni-directional.
Efficient Flooding for Wireless Mesh Networks by
Jayashree Subramanian B.E., Computer Science and Engineering, Madurai Kamaraj University (2001) M.S., Computer Science and Engineering, Indian Institute of Technology Madras (2005)
Submitted to the Department of Electrical Engineering and Computer Science in partial fulfillment of the requirements for the degree of MASSACHUSETTS INST[TUTE
OF TEC-NOLOGY
Doctor of Philosophy at the MASSACHUSETTS INSTITUTE OF TECHNOLOGY
LUBRARIES ARCHIVES
February 2012
©Massachusetts
Author .. .
r
Institute of Technology 2012. All rights reserved.
.....
.......
Department
of
Electrical
.
...................... and
Engineering
Computer
.
.
.
Science
December 28, 2011 Certified by . Robert T. Morris Professor Thesis Supervisor A
c
Accepted by ................ Pro~ess6 Le~lie A. Kolodziejski Chairman, Department Committee on Graduate Theses
2
Efficient Flooding for Wireless Mesh Networks by Jayashree Subramanian Submitted to the Department of Electrical Engineering and Computer Science on December 28, 2011, in partial fulfillment of the requirements for the degree of Doctor of Philosophy
Abstract Flooding in wireless mesh networks involves distributing some data from one node to rest of the nodes in the network. This dissertation proposes UFlood, a flooding protocol for wireless mesh networks that targets large file transfers, such as software updates, where achieving high throughput (minimizing the time to complete the flood to all nodes) and low airtime (lower the time each node spends in transmitting packets, and thus lower the impact on other wireless traffic) are both important. The central challenge in good flooding performance is the choice of senders for each transmission opportunity. At each time during a flood, some parts of the network will have received more data than others. The set of best sending nodes lies along the boundaries between these regions, and evolves with time in ways that are difficult to predict. UFlood's key new idea is a distributed heuristic to dynamically choose the senders likely to lead to all nodes receiving the flooded data in the least time. The mechanism takes into account which data nearby receivers already have as well as inter-node channel quality. The mechanism includes a novel bit-rate selection algorithm that trades off the speed of high bit-rates against the larger number of nodes likely to receive low bit-rates. Unusually, UFlood uses both random network coding to increase the usefulness of each transmission and detailed feedback about what data each receiver already has; the feedback is critical in deciding which node's coded transmission will have the most benefit to receivers. The required feedback is potentially voluminous, but UFlood includes novel techniques to reduce its cost. The dissertation concludes that careful choice of senders allows UFlood to achieve 150% higher throughput than MORE, a known high-throughput flooding protocol, using 65% less time transmitting. UFlood uses 54% lower airtime than MNP, an existing flooding protocol to minimize airtime, and achieves 300% higher throughput. Thesis Supervisor: Robert T. Morris Title: Professor
4
Prior Publication Much of this thesis was previously published in a conference paper 1531, and represents the joint work of the coauthors of that paper.
6
Efficient Flooding for Wireless Mesh Networks by Jayashree Subramanian Submitted to the Department of Electrical Engineering and Computer Science on December 28, 2011, in partial fulfillment of the requirements for the degree of Doctor of Philosophy
Abstract Flooding in wireless mesh networks involves distributing some data from one node to rest of the nodes in the network. This dissertation proposes UFlood, a flooding protocol for wireless mesh networks that targets large file transfers, such as software updates, where achieving high throughput (minimizing the time to complete the flood to all nodes) and low airtime (lower the time each node spends in transmitting packets, and thus lower the impact on other wireless traffic) are both important. The central challenge in good flooding performance is the choice of senders for each transmission opportunity. At each time during a flood, some parts of the network will have received more data than others. The set of best sending nodes lies along the boundaries between these regions, and evolves with time in ways that are difficult to predict. UFlood's key new idea is a distributed heuristic to dynamically choose the senders likely to lead to all nodes receiving the flooded data in the least time. The mechanism takes into account which data nearby receivers already have as well as inter-node channel quality. The mechanism includes a novel bit-rate selection algorithm that trades off the speed of high bit-rates against the larger number of nodes likely to receive low bit-rates. Unusually, UFlood uses both random network coding to increase the usefulness of each transmission and detailed feedback about what data each receiver already has; the feedback is critical in deciding which node's coded transmission will have the most benefit to receivers. The required feedback is potentially voluminous, but UFlood includes novel techniques to reduce its cost. The dissertation concludes that careful choice of senders allows UFlood to achieve 150% higher throughput than MORE, a known high-throughput flooding protocol, using 65% less time transmitting. UFlood uses 54% lower airtime than MNP, an existing flooding protocol to minimize airtime, and achieves 300% higher throughput. Thesis Supervisor: Robert T. Morris Title: Professor
8
Acknowledgments First and foremost, I would like to thank my advisor Prof. Robert Morris, without whom this dissertation would not have been possible. The discussions with Prof. Morris over the past six years and his constructive criticisms both in my research and dissertation writing have transformed me as a better thinker. I cannot fittingly acknowledge my indebtedness to Prof. Morris, but I hope this thesis will show to some extent that his hard work has not been entirely in vein. I am greatly indebted to Prof. Hari Balakrishnan for generously contributing his ideas, suggestions, criticisms, and support throughout every phase of my research. His guidance in both research and in matters beyond were always very helpful. I am very grateful to Prof. John Guttag for providing insightful comments on my dissertation. I thank Prof. Frans Kaashoek and Prof. Nickolai Zeldovich for providing a good research environment at PDOS and valuable comments during the group meetings. I owe sincere thanks to all the staffs of The Infrastructure Group (TIG), who provided timely help and support when I built the wireless test-bed for my experiments. The testbed deployment would have been very difficult with out the immense help of Shuo Deng. I am very thankful to Szymon Jakubczak, Mythili Vutukuru, Shuo Deng, Ramakrishna Gummadi, Katrina LaCurts, Lenin R. Sivalingam, Arvind Thiagarajan, Micah Brodsky, John Bicket, Sanjit Biswas, Daniel Aguayo and many others for patiently answering all my questions and the discussions there after. A special thanks to Athicha, Alex Yip, Chris Laas, Ramesh, Keith, and Haogang for sharing the office space and some great laughs together. I also thank all the PDOS and NMS students for their friendship and comments during my practice talks. I cannot find words to express my gratitude to my friends, who made my stay in grad school, a beautiful experience. I will always cherish the time I spent with Mythili during our long walks around Charles river, with Anusha and Ravikanth during the evening coffees, with Lavanya, Mani, Srini during the lunch and dinner parties, and with all of my Tang Hall roommates and friends. Prathima, Sudha and their family were very helpful to keep me feel at home (Chennai) in Boston.
My family has been always supportive throughout my life. Many interesting ideas in my research emerged out of several "long" discussions I had with my husband, Arunkumar. He has always been there to support, both technically and non-technically, during the difficult times in my grad school and I dedicate this thesis to him.
Contents 19
1 Introduction
2
3
1.1
Flooding in Wireless Networks . . . . . . . . . . . . . . . . . . . . . . . . 20
1.2
U Flood
1.3
Contributions . . . . . . . . . . . . . . . . . . . . . . . . . . . . . . . . . 23
1.4
Organization . . . . . . . . . . . . . . . . . . . . . . . . . . . . . . . . . . 24
. . . . . . . . . . . . . . . . . . . . . . . . . . . . . . . . . . . . 21
Sender Selection: Contributing Factors and Challenges
25
2.1
Factor 1: Delivery probabilities . . . . . . . . . . . . . . . . . . . . . . . . 25
2.2
Factor 2: Numbers of receivers . . . . . . . . . . . . . . . . . . . . . . . . 26
2.3
Factor 3: Dynamic Sender Selection . . . . . . . . . . . . . . . . . . . . . 27
2.4
Factor 4: Correlated Reception . . . . . . . . . . . . . . . . . . . . . . . . 28
2.5
Factor 5: Bit-rate Selection . . . . . . . . . . . . . . . . . . . . . . . . . . 29
2.6
Chapter Summary . . . . . . . . . . . . . . . . . . . . . . . . . . . . . . . 31 33
Related work 3.1
Flooding in Ad Hoc Routing . . . . . . . . . . . . . . . . . . . . . . . . . 33
3.2
Tree-based Flooding
3.3
Gossip-based Flooding . . . . . . . . . . . . . . . . . . . . . . . . . . . . 36
3.4
Flooding using Network Coding . . . . . . . . . . . . . . . . . . . . . . . 39
3.5
Flooding using Cooperative Coding and Diversity . . . . . . . . . . . . . . 42
3.6
Bit-rate Selection in Wireless Networks
3.7
Chapter Summary . . . . . . . . . . . . . . . . . . . . . . . . . . . . . . . 43
. . . . . . . . . . . . . . . . . . . . . . . . . . . . . 34
. . . . . . . . . . . . . . . . . . . 43
4
45
Design of UFlood 4.1
Goals and Assumptions . . . . . . . . . . . . . . . . . . . . . . . . . . . . 45
4.2
Design Overview . . . . . . . . . . . . . . . . . . . . . . . . . . . . . . . 46
4.3
Design Challenges
4.4
Bit-rate Selection . . . . . . . . . . . . . . . . . . . . . . . . . . . . . . . 48
4.5
Coding . . . . . . . . . . . . . . . . . . . . . . . . . . . . . . . . . . . . . 49
4.6
Utility . . . . . . . . . . . . . . . . . . . . . . . . . . . . . . . . . . . . . 50
4.7
Feedback
4.8
Mechanisms to efficiently reduce Idle-time . . . . . . . . . . . . . . . . . . 57
4.9
Hidden Terminals . . . . . . . . . . . . . . . . . . . . . . . . . . . . . . . 59
. . . . . . . . . . . . . . . . . . . . . . . . . . . . . . 47
. . . . . . . . . . . . . . . . . . . . . . . . . . . . . . . . . . . 52
4.10 Limitations of UFlood
. . . . . . . . . . . . . . . . . . . . . . . . . . . . 60
4.11 Chapter Summary . . . . . . . . . . . . . . . . . . . . . . . . . . . . . . . 63 5
6
Implementation
65
5.1
Data Structures . . . . . . . . . . . . . . . . . . . . . . . . . . . . . . . . 65
5.2
Packet Formats . . . . . . . . . . . . . . . . . . . . . . . . . . . . . . . . 66
5.3
Bit-rate Selection . . . . . . . . . . . . . . . . . . . . . . . . . . . . . . . 68
5.4
Coding and Decoding . . . . . . . . . . . . . . . . . . . . . . . . . . . . . 70
5.5
Main Loop
5.6
Batch Termination
5.7
Feedback Interpolation . . . . . . . . . . . . . . . . . . . . . . . . . . . . 74
5.8
Chapter Summary . . . . . . . . . . . . . . . . . . . . . . . . . . . . . . . 75
. . . . . . . . . . . . . . . . . . . . . . . . . . . . . . . . . . 70
Results and Discussion
. . . . . . . . . . . . . . . . . . . . . . . . . . . . . . 73
77
6.1
Experimental Setup . . . . . . . . . . . . . . . . . . . . . . . . . . . . . . 77
6.2
Main Results
6.3
W hy Does UFlood Win? . . . . . . . . . . . . . . . . . . . . . . . . . . . 83
6.4
Feedback
6.5
Factors Influencing the Performance of UFlood . . . . . . . . . . . . . . . 90
6.6
Summary of Findings . . . . . . . . . . . . . . . . . . . . . . . . . . . . . 96
. . . . . . . . . . . . . . . . . . . . . . . . . . . . . . . . . 81
. . . . . . . . . . . . . . . . . . . . . . . . . . . . . . . . . . . 87
7
8
97
Application: WiFi Multicasting using Client Cooperation 7.1
Related Work . . . . . . . . . . . . . . . . . . . . . . . . . . . . . . . . . 98
7.2
Goals and Assumptions . . . . . . . . . . . . . . . . . . . . . . . . . . . . 100
7.3
Key Ideas of UCast . . . . . . . . . . . . . . . . . . . . . . . . . . . . . . 100
7.4
Design and Implementation . . . . . . . . . . . . . . . . . . . . . . . . . . 101
7.5
Evaluation . . . . . . . . . . . . . . . . . . . . . . . . . . . . . . . . . . . 102 109
Conclusion 8.1
Summary ... . .....
8.2
Future Work.
..
. . . . . . ..
. ...
. . ...
109
..
. . ..
. . . . . ..
. . . ..
. . ..
. . . . . . . . . . . . . . . .111
. ..
14
List of Figures 2-1
Illustration of the importance of packet delivery probabilities. . . . . . . . . 25
2-2
Illustration of the need to consider the number of potential receivers. . . . . 26
2-3
Illustration of the best sender changing as nodes receive packets. . . . . . . 27
2-4
Example topology to illustrate the effect of correlation in packet reception. The numbers indicate link-level packet reception probabilities. . . . . . . . 28
2-5
Example topology to Illustrate bit-rate selection. . . . . . . . . . . . . . . . 30
3-1
Example topology to illustrate MNP (See Figure 1 of 1351).
3-2
Example topology to illustrate the benefits of RNC. . . . . . . . . . . . . . 39
4-1
Illustration of utility calculation in UFlood. Red and blue colored texts
. . . . . . . . 38
indicate packets that are transmitted and received, respectively, by the node. 4-2
51
Illustration of feedback in UFlood. F and Si are first and non-first-generation packets, respectively. . . . . . . . . . . . . . . . . . . . . . . . . . . . . . 53
4-3
Illustration of the importance of look-ahead. . . . . . . . . . . . . . . . . . 62
5-1
Flowchart of UFlood's main loop for packet transmission . . . . . . . . . . 71
5-2
Flowchart of UFlood's main loop for packet reception.
5-3
(a) A typical feedback packet in UFlood and (b) Illustration of feedback
. . . . . . . . . . . 72
interpolation in UFlood . . . . . . . . . . . . . . . . . . . . . . . . . . . . 74 6-1
Physical layout of the 25-node testbed. . . . . . . . . . . . . . . . . . . . . 78
6-2
CDF of pair-wise 1024-byte packet delivery probabilities at 5.5 Mbps for the testbed showing a wide range of link qualities. . . . . . . . . . . . . . . 79
6-3
CDF over choices of source of the total throughput achieved while flooding a 2MB file. On average, UFlood's throughput is 63% higher than that of UFlood-R, 150% higher than MORE's and 300% higher than MNP's.
6-4
. . . 81
CDF over choices of source of the total airtime used in flooding a 2MB file. On average, UFlood uses 30% lower airtime than UFlood-R, 65% lower than MORE and 54% lower than MNP. . . . . . . . . . . . . . . . . 82
6-5
CDF over the data transmissions in a single batch of the number of nodes that received each transmission. UFlood-R's transmissions reaches 50% and 20% more nodes than MORE and MNP. . . . . . . . . . . . . . . . . . 84
6-6
CDF over the data transmissions in a single batch of the number of nodes that benefited from each transmission. Typical UFlood-R transmissions benefit twice as many nodes as MORE and 20% more than MNP.
6-7
. . . . . 84
Use of low-probability links improves throughput by 88% for the median case..............................................
6-8
86
Packet receptions are highly correlated in our testbed. The x-axis shows Ps(r) for every link with non-zero delivery in the network. For each such point, there are multiple points on the y-axis, one for every other link from s. If all links were independent (from s), we would expect the points in this scatter-plot to all lie along the 45-degree y = x line......
6-9
. . . . ...
87
CDF over different choices of source of the total bytes of data packets transmitted, compared to total bytes of both data and feedback packets. The totals include all headers up to and including the 802.11 header. On an average, the feedback overhead is 3%. . . . . . . . . . . . . . . . . . . . . 89
6-10 Detailed Vs. UFlood's compact feedback representation. Compact feedback looses only I1%throughput due to conciseness. . . . . . . . . . . . . 90 6-11 CDF over different choices of source of total airtime, comparing UFlood-R with a simpler version that includes only rank in feedback packets. . . . . . 91 6-12 Mean throughput improvement on a 5-node dense network is 16% . . . . . 92 6-13 Mean throughput improvement on a 5-node sparse network is 38% . . . . . 92 6-14 Throughput of UFlood-R, MORE and MNP for various batch sizes . . . . . 93
6-15 Airtime of UFlood-R, MORE and MNP, for flooding a 2MB file, as batch size varies . . . . . . . . . . . . . . . . . . . . . . . . . . . . . . . . . . . 94 6-16 CDF of asymmetricity of the links in the testbed. 7-1
Illustration of the benefits of clients forwarding data and overhearing packets from m ultiple APs.
7-2
. . . . . . . . . . . . . . 95
. . . . . . . . . . . . . . . . . . . . . . . . . . . . 101
Throughput achieved as a function of the minimum allowed delivery probability on client/AP links. . . . . . . . . . . . . . . . . . . . . . . . . . . . 103
7-3
Airtime as a function of the minimum allowed delivery probability on client/A P links. . . . . . . . . . . . . . . . . . . . . . . . . . . . . . . . . 104
7-4
Effect on throughput of varying the fraction of clients that cooperate in flooding. . . . . . . . . . . . . . . . . . . . . . . . . . . . . . . . . . . . . 106
7-5
Throughput of UCast/UFLOOD-R is 400%, 50%, and 180% higher than DirCast, UCast/MORE and UCast/MNP, respectively. . . . . . . . . . . . . 107
7-6
UCast/UFLOOD-R consumes 66%, 44% and 37.5% lower airtime than DirCast, UCast/MORE, and UCast/MNP, respectively.
. . . . . . . . . . . 107
18
Chapter 1 Introduction Flooding in wireless mesh networks involves distributing data from a source node to rest of the nodes in the network. It benefits applications such as software updates and information dissemination 122, 391. Recent explosive growth in wireless mesh network deployments has motivated companies such as Motorola, Nortel, and Firetide to release products that flood video data in mesh networks, with applications to both entertainment and surveillance 17, 171. Despite being an active research topic for over a decade, existing flooding schemes 18, 35, 39, 541 leave room for improvement because they neither fully exploit wireless properties nor fully consider the limitations posed by wireless networks. For example, no existing flooding schemes for wireless mesh networks exploit the ability of the wireless nodes to transmit at different bit-rates. This dissertation describes the important factors that should be considered in the design of a flooding scheme for wireless networks and proposes a new flooding protocol, UFlood, which overcomes the drawbacks of the existing schemes. UFlood is useful for flooding large files in wireless mesh networks. Its goal is to achieve high throughput and using low airtime. This dissertation defines throughput as the file size divided by the total time it takes for all the nodes to receive the whole file. It defines airtime as the sum over all nodes of the time each node spends in transmitting. UFlood aims to lower the airtime 1 in order to limit the effect on other traffic. These definitions Lowering airtime might also help in lowering the total energy spent in the network. However, energy is not a concern in these networks and all the nodes are assumed to be always connected to an electrical power source. Thus, the energy spent in transmission, reception and computation is not a concern.
assumes that all nodes need the file and there is no advantage to some nodes getting the file before the last node gets it. Chapter 8 discusses how UFlood can be modified for flooding applications that use other metrics, for example, maximizing throughput to a subset of the nodes. The rest of this chapter introduces flooding in wireless networks and outlines the working of UFlood. This chapter also describes the major contributions of this dissertation and its organization.
1.1
Flooding in Wireless Networks
The fundamental problem to be solved in flooding for wireless mesh networks is as follows. The source has some data to flood to the rest of the nodes in the network. The nodes are equipped with broadcast radios and assumed to be spread out enough that forwarding through intermediate nodes often provides better performance than direct transmission from the source. Flooding begins with the source transmitting data that is heard by a subset of the nodes. At any given time during the flood, each node possesses a subset of the data to be transferred. Only some nodes can transmit at any given time because of interference and carrier sense. That is, if a node transmits, neighboring nodes usually cannot transmit simultaneously in the same channel. A protocol must choose senders for every transmission in a way that maximize its throughput and minimize airtime
2.
For example,
if node X can be heard by a superset of the nodes that can hear node Y, then (all else being equal) X should send in preference to Y. Similarly, X should send in preference to Y if X has data that other nodes need, but Y does not. However, the efficient choice of sender changes from transmission to transmission as nodes accumulate data, in ways that cannot be predicted practically because receptions are not deterministic. In other words, a flooding protocol may need to determine dynamically how useful a sender's transmission would be, which means that the nodes should some how learn the states of the other nodes in the network. The global knowledge of the status of the nodes is intractable and a local heuristic 2
This dissertation uses "efficient" and "best" sender to denote the sender for a transmission opportunity, which maximizes throughput and minimizes airtime of the flooding protocol.
for sender selection requires neighbor nodes to agree on the sender for each transmission and achieving this with a low overhead is a key challenge in the design of such flooding schemes. In addition, a good sender selection mechanism should ensure both high throughput and low airtime. One way to reduce airtime is to avoid sending until the sender is certain that receivers will benefit, which might require delaying until all potential receivers have indicated whether they need the transmission. This approach causes transmissions to be spaced out in time, reducing throughput. Conversely, throughput can be increased at the expense of airtime by arranging for nodes to send whenever they notice the channel is idle, on the theory that it is better to make a potentially redundant transmission than to waste a transmission opportunity. Nevertheless, it is also true that excessive redundant packet transmissions affect both throughput and airtime. Finally, every transmission must be sent at some bit-rate and the choice of bit-rate affects the performance of the flooding protocol. Simply using high bit-rates for transmissions might not aid in completing the flooding faster, because increasing the bit-rate for a transmission, despite increasing the speed of the individual packet transfer, decreases the inter-node delivery probabilities from the sender to the potential receivers. A flooding protocol should thus repeatedly make three decisions: which nodes should transmit, what data they should transmit, and what physical-layer bit-rates they should use. The best answers depend on the radio channel quality between nodes, the number of receivers near each potential sender, and what data potential receivers already hold.
1.2
UFlood
UFlood aims to achieve high throughput using low airtime by carefully selecting senders for each transmission and by using an efficient feedback mechanism that helps it to adapt rapidly to actual reception patterns with minimal communication overhead. UFlood combines the opportunistic reception of gossip protocols with a precise calculation of which nodes should transmit at any given time and at what bit-rate, using probabilities and knowledge of what data neighboring nodes already have.
The key to UFlood's design is its notion of utility. Utility is a local heuristic intended to capture the value of a given node transmitting, in terms of the expected rate at which receivers would receive new information from such a transmission. A UFlood node computes its utility in the following way. First, it uses a novel bit-rate selection mechanism to calculate the efficient bit-rate for its transmissions. Second, the node uses previouslymeasured delivery probabilities to compute the likely number of receptions at that bit-rate among its neighbors, counting only neighbors for whom the transmission would be useful. Finally, the node's utility is the likely number of useful reception times the bit-rate. A transmission is useful at a receiver if it conveys information that the receiver does not already know. UFlood implements this notion combining it with randomized network coding (RNC). RNC is well-known to increase the usefulness of individual data transmissions. In RNC-based flooding [8, 34, 411, a sender transmits coded packets, which are linear combinations of its existing coded packets. A sender decides whether a transmission would be useful for a receiver based on whether the transmission would be linearly independent of the packets the receiver already has. This requires the senders to know the coded packets already received by the potential receivers of its transmissions, either using feedback from the receivers or through some form of predictions. The recent research 1521 shows that flooding protocols that rely completely on predictions about the packets the receivers hold perform poorly. The performance gets much worse, if the predictions do not account for correlated receptions (Refer to Chapter 3.4 for details). Some form of feedback from receivers indicating what packets are with each of them helps to handle correlated receptions. UFlood uses a novel feedback mechanism that encodes compactly the identities of coded information a node has received, as well as techniques to reduce the feedback traffic. UFlood's bit-rate selection mechanism works as follows: A UFlood sender may have many neighbors, each with a different optimum bit-rate from that sender. In choosing a bit-rate, a sender essentially chooses the receivers of its transmission, since the receivers with optimum rates much below the chosen rate will receive mostly corrupted frames. The choice of bit-rate depends on whether each low-bit-rate receiver depends on the sender: if the sender is the receiver's quickest source of data, the sender should reduce its bit-rate. For this reason, the core of UFlood's bit-rate selection algorithm is a decision about whether a
sender is included in the minimum cost path from the source to the receiver. Thus, UFlood's design reflects the observation that bit-rate selection in a flooding protocol requires global information. UFlood's utility heuristic strives to ensure that, among each set of neighbors, only the node with the highest utility sends; this avoids interference, reduces the chances of needless duplicated data, and ensures that transmissions with few potential receivers do not steal channel capacity from transmissions of higher value. This is done by each node calculating the utility of neighbors as well as its own, and only transmitting if it has the highest local utility.
1.3
Contributions
The key contributions of this dissertation are as follows. " First, it describes the main underlying properties of wireless networks influencing sender selection in a flooding protocol and the challenges in considering these properties. * Second, it proposes UFlood, a flooding protocol for wireless networks that uses utility heuristic to select sender(s) for each transmission opportunity in order to achieve high throughput using low airtime. " Third, it demonstrates that detailed feedback about the data each receiver possesses is useful even with RNC. " Fourth, it describes a novel feedback mechanism to compactly represent the coded information the nodes possess and mechanisms to send feedback only when required. " Finally, it proposes the first bit-rate selection algorithm for flooding in wireless networks. The main result from experiments on an 802.11 test-bed is that UFlood, on average, achieves 150% higher throughput than MORE, a high-throughput flooding protocol, us-
ing 65% lower airtime. UFlood uses 54% lower airtime than MNP, an existing flooding protocol to minimize airtime and achieves 300% higher throughput. This dissertation finally proposes UCast, a system that uses cooperative client flooding to improve the delivery of multicast streams in WiFi networks. The flooding scheme used in UCast is UFlood. Evaluation on a WiFi network demonstrates that use of client cooperation improves multicasting throughput by 300-600% compared to DirCast, an existing WiFi multicasting protocol that does not use client cooperation.
1.4
Organization
The remainder of this dissertation is organized as follows: Chapter 2 describes the factors to be considered in deciding the senders and their bit-rates for every transmission of UFlood and the challenges involved in making these decisions. Chapter 4 uses these observations to design UFlood. Chapter 5 describes the implementation of UFlood and Chapter 6 discusses its performance using real-time experiments. Chapter 7 describes UCast and finally, Chapter 8 concludes and provides some thoughts about future work.
Chapter 2 Sender Selection: Contributing Factors and Challenges Performance of a flooding protocol depends on selecting senders for each transmission opportunity that help to disseminate data quickly across the network. This chapter explains the main factors that sender selection should account for and the challenges in considering them. The identification of these factors is one of the contributions of this dissertation. Previous flooding protocols have not considered all of the factors discussed in this dissertation (refer to Chapter 3 for details).
2.1
Factor 1: Delivery probabilities
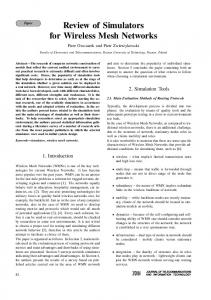
A 0.9 C
B 0.2 D
Figure 2-1: Illustration of the importance of packet delivery probabilities.
In wireless networks, receptions are probabilistic, which means transmission from a sender may or may not be received by a node. This makes calculation of the usefulness of a sender's transmission difficult. Sender selection in such networks should consider the probabilities of packet deliveries to the receivers. Figure 2-1 shows an example in which one sender is more effective than another due to delivery probabilities. Nodes A and B have each received a particular data packet from S. Only one can send at a given time, because of interference or carrier sense. The numbers in the figure indicate the link-layer broadcast packet delivery probabilities from A and B to each of C and D. The flooding protocol must decide whether it is better for A or for B to transmit the packet. If A transmits, the expected number of useful receptions (at C and D) is 1.7. If B transmits, the expected number of useful receptions is 0.5. If A transmits first, in all likelihood, B will not have to transmit at all, but the converse is unlikely to be true. Thus A is the better sender. This example illustrates why flooding protocols must pay attention to delivery probabilities when selecting the sender.
2.2
Factor 2: Numbers of receivers S
B
A 0.5
0. 0.4 0. 0.4 C
D
E
F
G
Figure 2-2: Illustration of the need to consider the number of potential receivers. Most often, wireless nodes are equipped with omni-directional antenna. Therefore, wireless receptions are broadcast, which means each sender's transmission may be received by more than one receiver. However, some sender's transmissions can be heard by more receivers than other receivers do and with different delivery probabilities. A flooding pro-
tocol should exploit this wireless property effectively to select senders whose transmissions are likely to reach many receivers that help spread data quickly in the network. Figure 2-2 shows an example of a difficult trade-off between a sender with low probabilities to many nodes and a sender with fewer high-probability receivers. If A transmits, the expected number of useful receptions is 0.5 (just node C). If B transmits, the expected number is 2.0. B will likely have to repeat the transmission a few times; C is likely to hear one of those transmissions, in which case A will not have to send at all. Thus, B is the better sender. This example illustrates why flooding protocols must incorporate the number of likely receivers in its choice of sender.
2.3
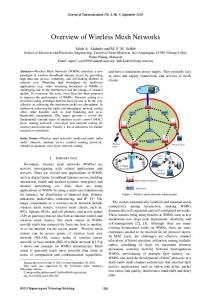
Factor 3: Dynamic Sender Selection S
0.1
0.2 0.8
0.91
C
D
Figure 2-3: Illustration of the best sender changing as nodes receive packets. In addition to selecting senders with good connectivity to receivers, it is also important to select senders whose transmissions are useful to the receivers. Probabilistic receptions in wireless networks demand dynamic sender selection based on the changing states of the nodes in the network. This is because the usefulness of a sender's transmission varies as the potential receivers of the transmission receive new data. Figure 2-3 shows a situation in which sender selection benefits from information about what data each receiver has received. A and B have a particular packet, but C and D do not. At that point, A is the best sender. A transmits the packet, and C receives it but D does not. Now B is the best sender: the expected number of useful receptions for A and B are now
A(source)
B
C
D
Figure 2-4: Example topology to illustrate the effect of correlation in packet reception. The numbers indicate link-level packet reception probabilities. 0.2 and 0.8, respectively. This example illustrates why flooding protocols must re-evaluate the choice of best sender as a flood progresses. However, delaying sender selection until all the receivers send feedback, indicating what packets are with each of them, delays each transmission. This decreases the overall throughput of the flooding protocol. Designing a feedback mechanism addressing this issue is a challenge.
2.4
Factor 4: Correlated Reception
Many existing flooding protocols 18, 191 assume that the probabilistic reception would ensure a degree of randomness in what information each node receives. However, wireless receptions often are correlated. Figure 2-4 shows an example where the usefulness of a sender's transmission depends on whether the sender has information that is distinct from that received by neighboring potential senders. Suppose, nodes A and B in Figure 2-4 have both received half of the source's transmissions, and that C can hear A and B perfectly but cannot hear the source. At one extreme, A and B may have received disjoint halves, in which case each of A and B should forward all the packets they hold. At the other extreme, A and B may have received exactly the same set of packets. In that case, they have the same underlying information to offer, even with coding, so that only one should send. Models to accurately predict correlation among neighbors do not exist. Thus, this example shows another reason why flooding protocols in wireless networks should have some form of
feedback exchange among neighboring senders. Designing feedback mechanism for coded packets is challenging and Chapter 4 explains this in detail.
2.5
Factor 5: Bit-rate Selection
Throughput of a flooding protocol depends on the delivery probabilities of the sender's transmission to its potential receivers, which in turn depend on the sender's bit-rate. Therefore, a flooding protocol should select a bit-rate for each transmission to maximize its throughput. Increasing a sender's bit-rate increases the speed of packet delivery and at the same time decreases the delivery probabilities to the receivers. Thus, each sender-receiver link in the network has a best bit-rate that maximizes throughput on that link. The bit-rate selection becomes complicated when a sender has to choose a bit-rate that maximizes throughput to many links (i.e., to more than one receiver). Thus, the choice of bit-rate can have a large effect on flooding performance, given the large difference between the slowest and fastest bit-rates in, for example, 802.1 lb/g radios. Using low bit-rates, allows transmissions to be received by a large number of receivers, which reduces the number of transmissions required to complete flooding. Alternatively, high bit-rates, due to high error rates [441may cause packets to be delivered to only few receivers and thus require more transmissions than low bit-rates. A good bit-rate selection algorithm for flooding protocols should thus trade off the speed of high bit-rates against the larger number of nodes likely to receive at low bit-rates. Figure 2-5 illustrates the effect of this trade-off. Each of the links is marked with the bit-rate at which the receiver of the link receives the highest throughput from the sender's transmission. In this example, S is the source, and sender X must choose the bit-rate for its next transmission. Bit-rate 54 would maximize the throughput among X's neighbors: C would receive at rate 54, and B and A would receive very little, but the average would be high. Then again, the overall goal is to minimize the time taken to complete flooding, which maximizes the overall flooding throughput. One might expect a sender to choose the best bit-rate that
Y 54
5.5 11
11
B
5.5
A Figure 2-5: Example topology to Illustrate bit-rate selection.
has good delivery probabilities to all its potential receivers. That is, a sender chooses the lowest of the best bit-rates to all its potential receivers to ensure that even its most poorly connected receiver receives its transmissions. So X should perhaps use a bit-rate that will reach its slowest receiver, which is 5.5. However, node B has a better path from S via Y, bottlenecked at rate 11. It is best for node X to ignore B, letting Y deliver to it, and choose the rate that is best for the slowest neighbor whose best path from S is via X. That neighbor is A, and X's best bit-rate is 11. Thus, a sender should not unnecessarily reduce its bitrate to reach a receiver, which has an alternative faster path from the source that does not involve the sender. This example shows that global information is required in selecting the best bit-rate for the senders.
In addition, suppose, in figure 2-5, node A already has the data that node X would transmit. Then, X should ignore A in choosing its bit-rate. In that case, X's best bit-rate would be 54Mbps.
Thus, a sender should consider the following three factors in choosing its bit-rate: (i) the best bit-rate for each link, (ii) the best path from the source to every node, and (iii) the coded information held by receivers that rely on sender's transmission for data.
2.6
Chapter Summary
This chapter explained that a flooding protocol should select the best sender for each transmission by favoring senders (i) with high delivery probability to receivers at the sender's best bit-rate, (ii) connected to large numbers of receivers, (iii) with information useful to many receivers, and (iv) accounting for correlated receptions. This chapter also discussed the challenges involved in considering each of these factors. Chapter 4 illustrates how UFlood accounts for these factors in its sender selection mechanism.
32
Chapter 3 Related work Flooding in wireless mesh networks is a well-researched topic that has received extensive attention. As mentioned in Chapter 1, the main goal of flooding protocols is to select senders whose transmissions will spread data quickly across the network. Traditional flooding approaches use one of the following two mechanisms for sender selection: (i) construction of structured topologies like routing trees, or (ii) use of gossiping through probabilistic or randomized broadcast of small messages. This chapter discusses existing flooding protocols in two main contexts: (i) as protocols to discover routes in ad hoc routing and (ii) as broadcast services for applications such as multimedia and reliable multicast. This chapter also describes the existing approaches for bit-rate selection in wireless networks.
3.1
Flooding in Ad Hoc Routing
Many routing protocols for ad hoc wireless networks use flooding to find routes or disseminate routing information. For example, AODV 1451 is an on-demand routing protocol that uses a simple expanding search for route discovery. That is, when a source node does not have a route to a destination, it broadcasts a route request packet. Any node that is not the destination rebroadcasts the request packet, if not already done. The destination, on receiving the request packet, sends a route reply packet back to the source node either through a known path or using the reverse of the path through which it received the route
request. DSR 1251 uses a flooding mechanism similar to AODV for route discovery, except that it combines flooding with filtering using packet sequence numbers to restrict the bandwidth consumed by route discovery control packets. FLR (Feasible Label Routing) 1471 uses scoped flooding and SHORT (Self-Healing and Optimizing Routing Techniques) 1181 uses scoped flooding as a route discovery technique of last resort. In scoped flooding, the route discovery happens within a subset of the nodes. For example, FLR uses a hop-limit to restrict the number of hops traveled by the route request packets. Such mechanisms reduce the broadcast traffic generated by route discovery packets. Williams et al. 1561 provide a good comparison of flooding techniques used in both stationary and mobile ad hoc routing protocols. Flooding mechanisms used for ad hoc routing do not consider all of the wireless properties discussed in Chapter 2. For example, none of them considers the delivery probabilities between node-pairs in selecting the best senders for transmissions. While there are poweraware routing protocols such as Minimum Drain Rate 1321 that exclude nodes with low battery in selecting routes, ad hoc routing protocols focus on decreasing route discovery latency and do not strive to minimize airtime. UFlood focuses on disseminating bulk data rather than small low-latency messages. Thus, UFlood is not suitable for flooding in ad hoc routing.
3.2
Tree-based Flooding
Tree-based flooding protocols use routing trees to pre-select senders statically for transmissions. This reduces redundant transmissions and helps ensure that only certain nodes transmit. Typically, these protocols factor in packet reception probabilities during topology construction. They account for delivery probabilities by augmenting theoretical results on constructing optimal sub-graphs, such as the Minimum Connected Dominating Set (MCDS) 1421, which determines a minimum connected vertex cover of the network, or a Minimum Spanning Tree (MST) that maximizes network lifetime 1281, or the Largest Expanding Sweep Search (LESS) heuristic 1271 that minimizes energy.
MCDS 1421, for example, tries to select the minimum number of senders so that all the nodes are likely to receive the flooded data from at least one of these senders. The authors prove that MCDS is an NP-hard problem and provide simple heuristics with provable guarantees to reach approxiamate solutions. Alternatively, in LESS 1271, the aim is to modify the transmission power level of the senders to adjust their transmission coverage to reduce the number of transmissions required to complete flooding. LESS picks senders such that the time between the beginning of flooding and the first node failure (i.e., the first node runs out of battery) is extended. Though these tree-based protocols are valuable for theoretical reasons, their practicality is limited. Most of them require central coordination or make several unrealistic assumptions about the behavior of wireless networks. For example, all of these pyotocols assume link invariance and independent packet receptions. However, these assumptions fail in reality. Srinivasan et al. 1521 discusses the extent to which realworld wireless networks violate these assumptions. UFlood does use predictions, but also use feedback from neighbors, which helps to correct the errors made in the predictions. Wieselthier et al. 1551 and Banerjee et al. 131 study several broadcast tree construction algorithms that take transmission costs into account, while Karenos et al. 1291 and Banerjee et al. 141 study power control algorithms for optimizing transmission energy. ODMRP 112, 381 uses a mesh-based topology and forwarding groups for scoped flooding, while STWIM [111 uses a cluster-based shared-tree topology to improve multicast performance for mobile ad hoc networks. Similarly, MCEDAR 1501 is a multicast extension of CEDAR 1511 routing protocol, in which, a subset of nodes that approximate the minimum connected dominating set is chosen as the core. These solutions are based on the experimental studies and thus do not make many unrealistic assumptions about wireless networks. However, the tree-based protocols do not use the information about the total number of receivers that can hear a sender's transmission. In fact, they only consider the dominant links from a sender, thereby missing a significant source of opportunism. Similarly, trees do not use the full receiver state across all receivers in determining a useful sender because in treebased flooding, a receiver only tries to recover packets from its parent, even if it is likely to overhear transmissions from other senders that are not its parent. UFlood, on the other hand, is a distributed scheme that picks best senders judiciously for every transmission,
considering the underlying wireless behavior. It avoids static tree constructions so that it can exploit opportunistic receptions and select senders by considering the changing states of the neighboring nodes (both potential senders and receivers).
3.3
Gossip-based Flooding
Gossip-based flooding protocols use unstructured communication. Nodes in gossip-based flooding usually exchange small messages, which are used in selecting the senders for transmissions. For example, flooding schemes where nodes poll neighboring nodes randomly for data and broadcast their own data probabilistically to other nodes, all fall into this category. While gossip was originally proposed in the context of wired networks for database replication, recent wireless protocols for sensor networks, such as Trickle 1391 and Deluge 1221 have adopted it as a mechanism for providing services such as software updates. Trickle 1391 is an energy-efficient but high-latency protocol for disseminating data in sensor networks. The goal of the Trickle protocol is to propagate and maintain code (i.e., software) updates across nodes in the network. Trickle uses a polite gossip policy to suppress redundant transmissions. The key idea used in Trickle is learning what and when to transmit using periodic transmissions of small messages (also called meta-data) from neighbors about what version of code they possess. The main properties of Trickle are as follows. " Low maintenance: meta-data is sent infrequently; just enough to ensure that all the nodes in the network possess the latest version of the code. " Rapid propagation: data propagation happen rapidly to all the sensor nodes " Scalability: the protocol maintains its properties in wide ranges of network densities and sizes, such as from a few tens to a few hundred neighbors per node. Nodes in Trickle set a timer randomly to fire within each epoch. Every so often, a node transmits meta-data only if it does not hear the same transmission from some other
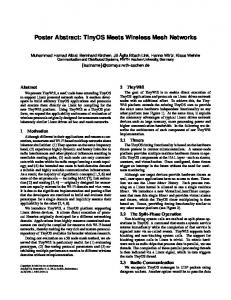
node. This causes suppression of the same requests being transmitted and allows Trickle to scale to dense wireless networks with thousands of nodes. Code propagation happen continuously, not in batches as in UFlood and at any point in time, each node may have different versions of the code. Whenever meta-data is transmitted, two things happen: some nodes learn that sender of the meta-data has a new version of the code and a few others learn that the sender has a old version. This causes some of the nodes to transmit their code. This is called an update in Trickle. Again, whenever a node hears a data transmission that is the same as its own, the node suppresses its transmission. Thus there are very few redundant updates. Deluge 1221 builds on Trickle to implement a reliable high throughput protocol for software updates in sensor networks. It is used for reprogramming sensor motes over the air. In both Trickle and Deluge, when many nodes learn that a neighbor has a older version of the code, one of the nodes (decided by underlying MAC protocol) transmits the new code. Sender selection considers neither the delivery probabilities of the node-pairs nor the number of receivers benefited by the transmission. Gossip-style protocols that pick a random node independent of link quality would achieve lower throughput than UFlood. Deluge, as in Trickle, suppresses duplicates by deferring transmissions whenever it hears the same transmission from some other node. However, some transmissions may not be heard because of loss of packets, which causes lack of suppression, thereby allowing duplicate transmissions to occur. UFlood selects senders based on the inter-node delivery probabilities: these transmissions are useful to many receivers. This ensures better sender selection and fewer duplicate transmissions. MNP 1351 is a gossip-based flooding protocol for sensor networks, in which potential receivers invite nodes with data to send, and only the nodes with the most invitations actually transmit. Figure 3-1 illustrates the working of MNP. The figure shows a set of nodes in a typical sensor network. Suppose node A sends some data, which is received by nodes B, C, D, E, and G. If all of them transmit next, it leads to collision and/or contention. In addition, G is a better sender than D, if the receivers of D's transmission already have the data that they received from A. In each epoch, MNP nodes alternate between sending advertisements (i.e., requests to neighbors for data) and sending the actual data in response
A
B
C
D
E
F
G
H
I
Figure 3-1: Example topology to illustrate MNP (See Figure 1 of 1351).
to the requests. First, the source, here A, sends the data, which is received by nodes B, C, D, E, and G. Potential senders for the next transmission A, B, C, D, E, and G send advertisements, announcing that they possess the data. Each of the rest of the nodes (i.e., F, H, and I) sends a request packet to the sender from which it first received the advertisement packet. The potential sender with the maximum number of requests in the epoch transmits next. This continues until all nodes receive the data. MNP's sender selection reduces collisions and redundant transmissions. It incorporates one of the considerations used by UFlood's sender selection (number of receivers), but does not consider delivery probabilities. For example, in Figure 3-1, if node I receives advertisement from both nodes D and E, it sends a request packet to one of them from which I first received the advertisement. However, this does not take into account the delivery probability from D and E to node I. In contrast, UFlood selects senders considering the delivery probabilities, which helps to quickly complete flooding. Wireless networks often suffer from asymmetric links; this means a sender may not receive the requests from the receiver to which it has higher probability to deliver data. This might make MNP select senders connected to few poorly connected receivers. For example, in Figure 3-1, suppose node E has good connectivity to nodes F, H, and I, and node G has poor connectivity only to nodes F and H. Due to link asymmetricity, if G hears requests from F, H, and I, and E receives request only from F, MNP will select sender G to transmit the next packet instead of the good sender E, which increases the
P, '...
0
0
P
10
0
Figure 3-2: Example topology to illustrate the benefits of RNC. number of transmissions required to complete flooding. UFlood performs well even in the presence of asymmetric links because each UFlood node transmits feedback not only about itself but also about its neighbors. Thus, UFlood nodes learn about their one and two-hop neighbors through both direct and multi-hop links from other nodes. This allows UFlood to out-perform MNP that do not leverage sender selection fully. Chapter 6 compares MNP to UFlood.
3.4
Flooding using Network Coding
Network coding is a technique where nodes, instead of simply forwarding the packets they receive, mix several packets already received using algebraic operations and transmit. Alswhede et al. I1 pioneered the use of network coding in wired networks. Multiple papers have shown that various forms of network coding achieve capacity for wired multicast 120, 23, 401. RNC 18, 201 is a distributed method for combining data at the nodes. It is well suited to multi-hop wireless multicasting and flooding. The basic idea used in RNC is that each node in the network generates random coefficient and uses them to linearly combine the packets they have to form new packets. RNC helps flooding in two ways: a single coded transmission can provide different missing information at different receivers thereby reducing the time taken to complete flooding, and allows intermediate nodes to create new coded packets, despite not having complete copies of the original data.
Figure 3-2 illustrates the benefits of RNC using a simple topology. Source S has 10 packets P 1 ,...,Pio to flood to 10 nodes N,...,Nio. Assume, at some point, each node is missing a different packet. In the absence of coded transmissions, the source has to send all 10 packets at least once to complete flooding successfully. On the other hand, if the flooding mechanism uses RNC, node S constructs new coded packets, which are linear combinations of PI,..., P10 using randomly generated coefficients for every transmission. Thus, if each node Ni,... ,No is missing a different coded packet, the source might fill the gap in all of them by broadcasting a single coded packet. This example shows that use of RNC increases drastically the usefulness of the individual transmissions and thereby reduces the number of transmissions required to complete flooding, compared to non-coded flooding schemes. On larger networks, benefits of RNC over non-coded schemes are amplified. The most relevant protocols in the area of network coding to UFlood are Rateless Deluge 1191 and MORE 181. Rateless Deluge 1191, an extension of Deluge 1221, uses RNC to reduce the number of transmissions required to complete flooding and scales better than Deluge. In addition to the rateless coded transmissions, the strategic idea used in Rateless Deluge is that the nodes exchange the count of missing packets, instead of the set of missing packets, as in Deluge. This reduces significantly the feedback traffic. The authors of 1191 used experiments on a single-hop network to demonstrate the performance of Rateless Deluge. However, Chapter 2.4 illustrates that in the presence of correlated receptions, the number of missing packets alone is not enough information for selecting the best senders and use of detailed information about what coded information are with each node is necessary to improve the performance of RNC-based flooding protocols. The current best RNC-based protocol for wireless routing and multicasting is MORE 181. Multicast MORE works as follows. The source divides the data it wants to flood into batches of K-native packets, and sends one batch at a time. Each transmission of the source is a broadcast, and consists of a coded packet. The source generates each coded packet p as p cIpi + c2p2 + ... + cKpg, where pi are the K native packets in the batch, and ci are 'A coding scheme is rateless if limitless number of coded message packets can be generated from, say, k source packets, such that all of the source packets can be recovered from any of the k coded packets. RNC is
an example of a rateless code.
K coefficients chosen randomly for each coded packet. The source continues broadcasting coded packets from a batch until all nodes tell it that they can decode the batch; then the source moves on to the next batch. Each coded packet includes the coefficients ci with which it was generated. Each node stores the coded packets it receives for the current batch. A node can decode a batch once it has received K linearly independent coded packets. Each forwarding broadcast by non-source nodes is generated as ciqi +c2q2 +
...
, where qi are the coded packets
the node has stored. The forwarding node calculates a set of coefficients relative to the original native packets at the source and sends them with the forwarded packet; it can do this even though it may not be able to decode the batch 181. Nodes, including the source, need a way to decide how many coded packets to send, in order to propagate data to nodes that cannot hear the source. Multiple nodes receive the transmissions of the source. Therefore, it is usually enough for just a subset of them to transmit coded packets. In addition, some potential senders are better placed than others to move packets quickly across the network. MORE accounts for these effects by computing a credit counter, TXcredit, for each node. The credit counter sets the ratio between packets a node receives and packets it sends. MORE calculates the credit counter of a node by inspecting the loss rates along the best route from the source to each node. For the routes a node is on, its credit counter is set so that it generates enough packets to counteract the predicted losses along those paths. The only feedback traffic in MORE is an indication from each final destination back to the source that the destination has decoded the batch; nodes do not exchange any more detailed feedback information. MORE is a success in the sense that it attains significantly higher throughput than previous protocols that do not use coding but do exchange feedback detailing which packets each node has received. Decisions of MORE about which nodes should send and how many packets each node should send are pre-computed statically based on prior measurements of inter-node delivery probabilities. If the predictions are not correct or if losses in the links are bursty on time scales comparable to a batch size, MORE nodes will forward inappropriate numbers of packets. In addition, MORE, similar to Rateless Deluge 1191, does not account for cor-
related receptions in its TX-credit calculations, which affects its performance. Chapter 6 compares UFlood with MORE. Srinivasan et al. 1521 proved the existence of correlation in wireless networks by using a new metric Kty, which denotes the correlation of reception at nodes x and y for packets from node t. They showed that the same link pair x and y can have different K's depending on the channel, power levels, data-rate. Their main conclusion is that a no-network-coding protocol, such as Deluge performs better than network coding and opportunistic protocols such as Rateless Deluge, if the network has correlated receptions. Since UFlood nodes exchange detailed feedback about what packets are with each of them, sender selection considers the states of both neighboring contending senders and the potential receivers. This means, UFlood's sender selection is aware of both correlated packet receptions and link invariance. Zhu et al. [581 described a feedback mechanism that exploits the existence of correlated receptions in wireless networks. They show that the Conditional Packet Reception Probability, CPRP (i.e., the probability that a node receives a packet, given the condition that its neighbor has received the same packet) of two neighbors is always high. Thus, every node predicts whether one of its neighbors has received a packet purely on overhearing and CPRP calculation, without exchange of any feedback with its neighbors. Therefore, the nodes need only to send periodic probe packets to maintain an accurate CPRP value. The authors claim that this reduces the feedback traffic but did not demonstrate the traffic overhead introduced by periodic probes for large networks. On the other hand, feedback in UFlood scales for large networks as only the neighbors exchange their feedback information and UFlood uses its own prediction mechanism to suppress the feedback traffic. Chapter 4.7.3 explains this in detail.
3.5
Flooding using Cooperative Coding and Diversity
By using RNC, UFlood (like MORE) has a built in form of error correction. An alternative might be to use source coding to improve flooding efficiency, as in MISTRAL 1461. One could also implement cooperative diversity techniques for combining errored pack-
ets received from multiple sources, similar to those proposed in Jakllari et al. 1241 and MIXIT 1301. UFlood can take advantage of cooperative coding and transmission strategies to improve its performance further. All of these techniques are complementary and exploring these ideas is an area for future work.
3.6
Bit-rate Selection in Wireless Networks
Many wireless nodes are capable of using various bit-rates for transmissions. The main challenge is to determine what bit-rate to use to increase throughput. Much is known about wireless bit-rate selection for point-to-point links 15, 14, 21, 26, 371 and for WiFi multicasting 131, 571, where all the receivers are within the radio range of the sender. To the best of our knowledge, there are no existing bit-rate selection mechanisms for flooding or multicast protocols in multi-hop mesh networks.
3.7
Chapter Summary
This chapter discussed the existing tree and gossip-based flooding protocols used for (i) route discovery in ad hoc routing protocols and (ii) disseminating large-scale data such as multimedia. This chapter also included a discussion of the flooding protocols that use coding techniques. Finally, this chapter contained an explanation of the bit-rate selection mechanisms used in wireless networks. The rest of this dissertation is a discussion of how UFlood overcomes the drawbacks of the existing flooding protocols.
44
Chapter 4 Design of UFlood The central task of UFlood is to select senders in a distributed manner considering the factors described in Chapter 2. The design of UFlood's sender selection involves three main sub tasks: (i) utility formulation, (ii) bit-rate selection, and (iii) feedback mechanism. This chapter discusses the design of each of these tasks. It begins with a description on the environment in which UFlood is expected to be used. The chapter also describes the limitations of UFlood.
4.1
Goals and Assumptions
The goal of UFlood is to distribute a large file from a single source to the rest of the nodes in a wireless mesh network. The main performance goals are high throughput and low airtime. Throughput is defined as the file size divided by the total time it takes for all the nodes to successfully receive the entire file. This definition assumes that all nodes need the file and there is no advantage to some nodes getting the file before the last node gets it. Airtime is defined as the sum over all nodes of the time each node spends in transmitting data, feedback, and acknowledgment packets. The definition reflects impact on other users of a shared channel: the less time spent transmitting during flooding, the more of the channel is available for other users. The design of the UFlood protocol relies on the following assumptions. Many realworld wireless mesh networks that use flooding have all of these properties.
*
A large quantity of data is to be flooded reliably.
" Each node operates at a fixed power level, on a single channel, with an omni-directional antenna. Thus, all the packet transmissions are broadcast. Few of the nodes can communicate directly, but UFlood must flood over multiple hops to cope with more distant nodes. * Nodes are stationary and are willing to forward data for each other. " The network size is on the order of dozens of nodes and there is a multi-hop path with non-zero delivery probability from the source to every other node. " The radios have a carrier sense mechanism that works reasonably well to avoid collisions and allow spatial re-use.
4.2
Design Overview
In outline, UFlood works as follows. Each node measures the delivery probabilities of the links to its one-hop neighbors I and distributes this information to rest of the nodes (refer to Chapter 5.1). All the nodes run the bit-rate selection algorithm using the measured delivery probabilities to calculate the best bit-rate for each node. Section 4.4 explains UFlood's bit-rate selection algorithm. All these are done before the actual flooding begins. A UFlood transfer begins at the source node, which has the data to be flooded. The source node divides the data into equal-sized packets called native packets, and floods one batch of K native packets at a time. The source begins by transmitting coded packets, each constructed by linearly combining the K native packets in the batch. Section 4.5 describes how each coded packet is constructed and how many such packets the source transmits. All the nodes then go through the following cycle until every node indicates to the source that it has received K linearly independent coded packets, which is enough to decode the entire batch. Each node calculates its own utility and the utility of its neighbors. Nodes with utilities higher than their neighbors transmit a burst of data packets, coded over the (One-hop) neighbors refer to those nodes that can communicate directly with each other with a delivery probability greater than 0.1.
packets they have received in the batch. All the transmissions of a node are carried out at its best bit-rate. A subset of the nodes then transmits feedback packets. The feedback contains information required for neighbors to calculate utilities. Section 4.7 illustrates UFlood's feedback mechanism in detail. This process continues until all nodes signal the source node that they are able to decode the batch at which time the source proceeds to the next batch.
4.3
Design Challenges
Design of UFlood should solve the following sub-problems. " UFlood should select the best bit-rate for each node such that the overall throughput is maximized. " Each UFlood node should calculate the utility of its transmission at its best bit-rate and those of its one-hop neighbors. " Each UFlood node should learn the state of its neighbors. The state of a node represents the number of coded packets it possesses and a summary of coefficients of those coded packets. UFlood should decide what information the neighbors exchange to learn each other's states. It should also decide which of the neighbors' states are necessary to guarantee unanimous sender selection in the neighborhood. That is the probabilities that two neighbors decide they are both the best senders or that no sender decides it is the best, must be low. * Each UFlood node should send feedback only when necessary. It should cope with delayed or dropped feedback from neighbors " The flooding protocol should handle hidden terminals in the network. " All of these must be achieved with low communication overhead. The solutions to the above-mentioned problems dominate much of the design of UFlood.
4.4
Bit-rate Selection
Chapter 2.5 explained the need for bit-rate selection in flooding protocols and the basic qualities that a bit-rate selection scheme should possess. The main goal of UFlood's bit-rate selection scheme is to select the best bit-rate for each node such that the overall flooding throughput is maximized. The crucial idea used is as follows. Each node constructs a unicast multi-hop path from the source through which it can receive the source's data in least time. The node's neighbor that is on the last hop in the unicast path is the best sender for delivering the source's data to the node. This means, each sender has a set of neighbors for which it is responsible for delivering source's data. The sender chooses the highest bit-rate that has good delivery probability to all the neighbors for whom it is likely to be the best sender. This mechanism helps UFlood attain a high overall throughput because the sender's bit-rate is selected, based on global information, to minimize the time taken to transfer the source's data to its worst-connected neighbor that depends on the sender for data. In addition, this mechanism ensures that the sender does not unnecessarily reduce its bit-rate to reach a neighbor which has a faster source of data from elsewhere. Each node runs the bit-rate selection algorithm to calculate the best bit-rate for itself and for every other node. The best bit-rate for a sender X is calculated as follows. First, the sender uses a standard routing protocol to compute unicast routes from the source to each of its neighbors that minimizes the expected transmission time (ETT) metric 1141 2. Since the sender already has a copy of the data it will send, it calculates the paths as if it had an infinitely fast link to the source. The sender then determines the set of its neighbors for which it is the last hop on the shortest ETT path. The node uses the bit-rate that will achieve the maximum throughput on the worst of the links to those neighbors. This causes the sender to choose a rate low enough to provide the best throughput for the worst-connected neighbor that depends on the sender for forwarding, but does not reduce the sender's rate needlessly to help nodes that have a faster path (not through the sender) by which they can receive. 2
ETT of a link is defined as the expected amount of time it would take to successfully transmit a packet of fixed size on that link; the time depends on the delivery probability of the link and the bit-rate of the transmission.
Finally, whenever a sender finds, based on the feedback from neighbors, that its transmissions are not useful to its worst-connected neighbor, it re-computes its best bit-rate by ignoring the worst-connected neighbor. Chapter 5.3 explains the implementation of the bit-rate selection algorithm.
4.5
Coding
The source uses randomized network coding over each batch to help make each transmission useful to multiple nodes even if they are missing different parts of the batch. Each transmission of the source is coded over all the native packets in a batch, as in MORE 181. If the K native packets are nl
...
1
K
and
C ... CK
are K randomly chosen integers, then a
k
cini. The arithmetic is byte-wise, so that the first byte
data packet transmission is p i1
of p is ci times the first byte of ni plus c2 times the first byte of n2 and so on until Ck times the first byte of nI. All the arithmetic is carried out in the finite Galois field GF(2 8 ) 18,401. Each coded broadcast also includes the K coefficients
(Cl ... CK)
used to construct p. A
packet coded over the native data is called a first-generation packet. A non-source sender broadcasts packets recoded over all the first generation coded packets it has received in the current batch using new random coefficients. For example, if a node possesses two first-generation coded packets pi and P2, then the packet transmitted by this node is a linear combination of these packets of the form c .pI + c 2 .p2. Different coefficient vectors (K randomly generated numbers) C'are chosen for constructing each coded packet. All nodes include, in each transmission, coefficients relative to the original native packets (refer to Section 4.7). Once a node has received K linearly independent packets in the current batch, it decodes them to obtain the native packets. At that point the node starts to act as a source-like node sending first-generation packets, coded from the native data.
4.6
Utility
Once the source has sent a full set of coded packets for a batch, multiple other nodes will be in a position to send further recoded packets to help spread the flood. The decision of a UFlood node to transmit depends on whether it thinks its transmission has higher utility than those of its neighbors. The objective of the utility heuristic is to choose the best senders based on the considerations explained in Chapter 2. The utility of a node is the expected rate (in Mbps) of useful data receptions that would ensue if it were to transmit. Node X estimates the utility of any node Y (possibly itself) as follows: Ux (Y)
-b(Y) -ly,z
(4.1)
Ny is the set of neighbors of Y. b(Y) is the best bit-rate for node Y. PY.Z,b(Y) is the delivery probability from Y to Z when Y transmits at the bit-rate b(Y). Iy.z is 1 if a coded packet from Y would be linearly independent of the packets Z already has and 0 otherwise. X computes Iy,z using the feedback it receives from Y and Z (and also interpolates, as described in Section 4.7.3). Figure 4-1 explains how utility works in UFlood using a simple example. Assume for simplicity that all the nodes transmit using a bit-rate of 1Mbps. The number on each link indicates its delivery probability. Source S wants to flood two native packets n] and n2 to the nodes A,B,C, and D. It constructs two coded packets, indicated by red colored text in the figure, using the random coefficients c. The source transmits the two coded packets, which are then received by the nodes A and B, indicated by blue colored text. Either S, A, or B can transmit the next packet. The utility of source S is zero since nodes A and B, the only potential receivers of the transmissions of S (Pscb(s) = 0 and PS,D,b(S) = 0), already have enough coded packets to decode the native packets; transmissions from S are no longer useful to them (Is,A = 0 and IS,B = 0). The utility of node A is 1 (PA,cb(A) = I and IA,c = 1) and that of node B is 0.5 (PB,D,b(B) = 0.5 and IB,D = 1.0). Thus A, with the highest utility compared to those of its neighbors (i.e., S, B and C), wins and sends coded packets until
Native Packets: n,n Coded Packets:
2
Coefficients: c
c. n +c2.n2 C3- 1+C4.n , 2 S 1
1 c. nc c3 . n+c
4 .n 2
A
B
c 5 . n 1 +c6 .n 2 c7. n I+c8.n 2
e IIIn +c 12.n 2 c 13 .n +c 1 4 .n2 C15 n 1+c 16 'n 2
0.5
C c5 . n +c6 .n2 c 7 . n +c8 .n 2
n. n c+c2.n2 +c 4. n 2 3. c9.n +c 101n
D cg.n I+c 101n c 13 .n +c 14 .n 2
Figure 4-1: Illustration of utility calculation in UFlood. Red and blue colored texts indicate packets that are transmitted and received, respectively, by the node. C receives two linearly independent coded packets. B, now the most useful node in the network with utility 0.5, transmits next until D gets 2 linearly independent coded packets of the batch and can decode the batch. Why does this definition of utility improve the overall flooding throughput? The reason is that the utility equation (Equation 4.1) captures all the considerations for sender selection mentioned in Chapter 2. Multiplying by delivery probability favors nodes with good links to receivers. Summing over neighbor nodes' delivery probabilities favors senders with many potential receivers. The Iy,z factor favors transmissions likely to be linearly independent of data already held by receivers. Additionally, Iy,z favors senders that could send multiple useful packets in a row without needing to wait for feedback. Multiplying by transmit bit-rate favors senders with faster links to receivers. UFlood's utility is a locally greedy heuristic. For example, it does not account for the possibility that a sender with only a few low-quality links might deliver packets to nodes
that would then be able to transmit to many receivers on high-quality links. Nevertheless, chapter 6 shows that this local utility heuristic leads to efficient flooding with high overall throughput in the network.
4.7
Feedback
One of the main challenges in the design of UFlood is to decide the best sender for every transmission in a distributed manner. A unanimous decision in a neighborhood is possible only if every node knows the states of those nodes, which all nodes in a neighborhood use in their utility calculation. That is, each node should know the states of both its one and two-hop neighbors. This is used in calculating ly,z in the utility equation indicating if a transmission by Y would be useful to Z. A node obtains this information through feedback packets. This section explains how UFlood nodes construct and transmit feedback packets.
4.7.1
Compact feedback representation
Coded packets do not have a simple unique identification, such a packet number. A straightforward method to summarize the coded information a node holds is by using the coefficients that were used in the construction of the coded packets. Each coded packet has a distinctive set of coefficients. The feedback that a node X sends can include these coefficients for each packet it has received in the current batch. This information is enough for the neighboring senders of node X to decide whether X would benefit from a particular coded transmission (i.e., whether a transmission would be linearly independent of the packets X already has). Though this is a simple mechanism, full description of the packets a node holds might require K coefficients for each of up to K packets; for K = 64 this is almost 4096 bytes. Exchange of such a vast amount of information is expensive. Therefore, UFlood uses a novel compact form of feedback to summarize the coded packets held by a node. UFlood ensures that this compact feedback is less expensive than sending coefficients. The underlying idea is that all transmissions ultimately are derived from first-generation packets (Fi) coded by the source and that whether a transmission is useful at a receiver has
to do with whether it adds to the receiver's total information about those first-generation packets. Any non-first-generation packet (Si) can be expressed in terms of a linear combination of first-generation packets. For example, assume a forwarder received a set of coded packets pi in the form I ci.ni, where ni are the native packets. Any packet transmitted by the forwarder would be a linear combination of these coded packets in the form Icj.pi, which can be expressed in the form of first-generation packets
Y(ci.c
1 ).ni.
Since the mul-
tiplicative group in a Galois field is cyclic, ci.cj is again a random number in the finite Galois field GF(2 8 ). Suppose the first-generation packets are numbered F1 , F2 , ... , Fl. Feedback of a node
consists of a count of the linearly independent packets that it holds (the "rank" of the node) and a bitmap with one bit for each Fi. The node sets bit i if it has received Fi or has received a non-first-generation packet that was recoded over Fi. UFlood limits the source to generating 256 distinct coded packets per batch of native packets; this means a feedback packet is just 33 bytes (an 8-bit rank and 256 bits).
T
FJ,F 2, F4
F5
X
W
Rank=3 Bitmap=1,2,4
S1
Rank=2 Bitmap=1,2,4,5
Figure 4-2: Illustration of feedback in UFlood. Fi and Si are first and non-first-generation packets, respectively. Figure 4-2 uses an example to illustrate UFlood's feedback mechanism. Suppose node W has received first-generation packet F5 directly from the source S and received a nonfirst-generation packet Si sent by node X, which X generated by coding packets F1 , F2 , and F4 from S. Then feedback of W will indicate a rank of two, and its bitmap will have entries 1, 2,4, and 5 set. Whereas feedback from X will indicate a rank of three, and a bitmap with entries set at 1, 2, and 4.
This feedback is sufficient to estimate Iy,z conservatively, without needing to know the actual coefficients as follows:
Irz= Ly,z
1 ifLy,z >0 0 otherwise
0
if rank(Z) > K, or
bi
if rank(Y) > rank(Z) (I1), or
b2 if rank(Y) < rank(Z) and Y has more bits
(4.2)
set in its bitmap than Z (12), or
0
otherwise
where Lyz is the maximum number of coded packets that Z can receive from Y that would be linearly independent of packets Z already has, bi is rank(Y) - rank(Z) and b2 is the number of bits that are set in the bitmap of Y but not set in the bitmap of Z. This calculation is a conservative estimate: if Ly,z is greater than zero, then a transmission from Y is likely to benefit Z, while if zero, there is still some chance that a transmission would be beneficial. Section 4.10.3 is a detailed discussion of this limitation of UFlood. As an example of condition I, consider Figure 4-2. Suppose node W has two packets, and its bitmap has bits set at positions 1,2, 4, and 5. A transmission from node X with a rank three is likely useful at W. The only way this could fail to be true is through an unlucky choice by W of its recoding coefficients. As an example of 12, consider Figure 4-2. Suppose node X has three packets, but none is coded over F5 . Then a transmission from W, which has only two packets will be linearly independent of the packets X already has since it is coded over F5 . This is the reason why sending the rank of nodes alone as feedback is not enough information to know whether a sender's transmission is useful to its receiver. One of the main contributions of this dissertation is to illustrate the need for detailed feedback even in the presence of coded transmissions. Once a node receives K linearly independent coded packets, the receivers of its transmissions will end up setting many bits in its feedback bitmap, which will make 12 rarely
true. For example, suppose node X has received F1 ...FK. X then transmits twice; Y receives only its first packet and Z receives only its second packet. Now Y and Z have the same rank (one) and the same set of bits set in their feedback bitmaps (1,2,... ,K), so neither condition II nor 12 is true. However, they could benefit from each other's transmissions, because they each have at least one linearly independent packet for the other. To address this situation, UFlood nodes that have received enough packets to decode the whole batch, begin to transmit first-generation packets, coded from the native data. Such nodes are called "source-like" nodes. Each feedback packet contains 256 bits for each source-like node from which the feedback sender has received packets. Condition 12 applies to the entire set of bits. UFlood strives to select best sender(s) in every neighborhood. A unanimous sender selection in a neighborhood is possible only if nodes have an accurate state information of not just its one-hop neighbors, but also its two-hop neighbors whose states also contribute to the utility of the neighbors. However, including the complete states of two-hop neighborhood is inefficient since it drastically increases the network traffic. Achieving this is a challenge and the current feedback implementation of UFlood includes only the ranks of a node's two-hop neighbors and not the summary of the coded packets. This still improves the agreement among neighbors in sender selection and helps avoid hidden-terminals. Section 4.9 explains this in detail. To summarize, a feedback packet from node Y contains (see Chapter 5.7 for details):
1. The rank of Y. 2. A bitmap identifying each distinct first-generation packet that contributed (via coding) to any of the packets held by Y. 3. The rank of each of the neighbors of Y.
A typical packet with the above contents has approximately 80 bytes of payload, far less than would be required for a full set of coefficients.
4.7.2
Feedback Timing
There is a tension between feedback timeliness and overhead. On the one hand, it is important for senders to have up-to-date knowledge of what coded packets receivers have, to suppress senders whose transmissions would not be linearly independent at many receivers and to avoid disagreement over who has the highest utility, which may cause idle-time in the network. Idle-time refers to the state of the network where no node in a neighborhood transmits because no node in the neighborhood thinks it has the highest utility in the neighborhood. On the other hand, frequent feedback is necessary to calculate utility accurately after every new transmission. However, in a network with dozens of nodes, each node sending a feedback packet after every data transmission is capacity consuming and increases the airtime. In addition, an increase in the number of feedback packets also contributes to the network traffic apart from its size due to packet collisions and retransmissions. Thus, it is important to space the feedback packet appropriately and to reduce the size to reduce both traffic and idle-time. At any point in time, there are two kinds of nodes in the network. First, there are nodes that do not have enough information to decode the batch. Feedback packets from such nodes help neighboring senders transmit the missing information. Second, there are nodes that have already decoded the batch, and which must have sent acknowledgment packets to inform the source of this. All the neighbors that heard these packets update the state of the nodes sending the acknowledgments. Since these states do not change until the end of the current batch, further feedback packets from such nodes are unnecessary. Therefore, in order to reduce idle-time and at the same time maintain consistent state information across neighbors, a node sends feedback only if the following two conditions are satisfied.
" Condition 1: The node does not have all the packets of the batch.
* Condition 2: The node senses the channel idle for the duration of three data packets, which is enough duration to detect an idle-time.
4.7.3
Feedback Interpolation
UFlood nodes send feedback infrequently and feedback packets may be lost, which means nodes must operate with stale feedback. This may cause neighbors to fail to agree which is the best sender. For example, in Equation 4.1, if node X can hear node Y and all of Y's neighbors, then it is easy to see that the equation correctly calculates Y's utility at X. If feedback from some neighbors of Y cannot be heard or is delayed, then X will underestimate Y's utility and may send data even though Y is actually the better sender. It is far worse if X were to over-estimate Y's utility and not send data as a result because that would introduce idle-time and slow down flooding. UFlood nodes attempt to correct stale feedback by interpolating. For every data transmission that X knows of since Y's last feedback, X predicts the effect of that transmission on Y's feedback using the probability equal to the delivery probability between the packet's sender and Y. If X predicts that Y received the packet and decides that the packet would have been linearly independent of the packets Y's feedback indicates it already has, X increments rank(Y) and sets the bits in Y's feedback bitmap corresponding to the source's packets that contributed to the data transmission. Each node does this interpolation whenever it sends or receives a data packet and overwrites its interpolated feedback for a neighbor whenever feedback arrives from that neighbor. Any node X may not know about all the potential senders from which a receiver Y can get its packets, so this interpolation is approximate.
4.8
Mechanisms to efficiently reduce Idle-time
In spite of UFlood's effort to reduce idle-time through feedback interpolation, it is not completely eliminated because of inaccuracies in the interpolation, and spacing of feedback packets to minimize airtime. Reducing idle-time without sending more feedback is challenging. UFlood has the following mechanisms that help it avoid idle-time from occurring.
4.8.1
Bursty packet transmission
To reduce idle-time, nodes that calculate that their utilities are higher than their neighbors' transmit a burst of packets. Sender selection occurs only at the end of each, reducing opportunities for disagreement in the neighborhood and resulting idle-time. When a node X decides it has the highest utility, it sends a burst of
min LAC
CCNA
(4.3)
packets. This, calculated using Equation 4.2, is the most packets that X can send without causing any neighbor to have higher utility than X. The overall burst sequence is as follows. The current sender sends a burst of packets. Other nodes calculate the sender's burst length (or observe it in the sender's packet headers) and wait long enough for the burst to have ended. Then all the nodes recalculate utilities and the best node sends a new burst. This process can proceed for a while without feedback packets with all nodes using interpolation instead. At some point, interpolation will predict that all nodes have enough packets to decode the whole batch and no node will send. Nodes that have not in fact received enough packets will observe an idle channel. Therefore, they will send feedback, which will cause one of its neighbors to become a sender. If all nodes can decode the batch, they will send acknowledgments to the source, which will start a new batch. The source also transmits a burst of packets at the beginning of the batch equal to
LSD/P,D,b(S)
(4.4)
packets, where S is the source node and D is the neighbor of S that has the best delivery probability from the source node.
4.8.2
Next-best node
Idle-time may occur despite the above mechanism. UFlood copes with this by having any node that thinks it has the second-highest utility begin transmitting if it hears no packet from the best node for a duration of three packets. The nodes with the third-highest utility begin transmitting if they hear no packet from both the first and second best nodes for fourpacket duration and so on. In addition, the current highest utility node is never reconsidered as the best node by its neighbors, until the neighbors receive further feedback that changes the states of the nodes.
4.8.3
Parent-child entity
A final idle-time situation can occur when most nodes are able to decode a batch, but those nodes' interpolation mechanism has caused them to guess incorrectly that all other nodes also have enough packets to decode the batch, and the rules for sending feedback do not trigger feedback from the few nodes that do not have enough packets. UFlood handles this by giving each node a parent node (determined by the unicast route back to the source), and having the parent reset its interpolated state for any child that does not send an acknowledgment to the source soon after it has decoded the whole batch. This causes the parent to become a sender, and thus drive the child toward completion. Whenever a parent node interpolates the reception of the last packet of the batch for any of its child node, it sets a timer for the duration of three packets. If the parent node does not receive the unicast acknowledgment from that child node in this duration, it resets the timer and sets the number of packets the child received to K - 1. Thus each parent keeps sending until its children acknowledge the batch.
4.9
Hidden Terminals
Two nodes that cannot hear each other might both decide to become senders and collide at common receivers. UFlood reduces the chance of this in the following way. As described in the previous discussion, feedback packets contain the ranks of two-hop neighbors. Thus,
feedback from common receivers will cause two-hop neighbors, and potential hidden terminals to be aware of each other. When a node decides if it has the highest utility, it compares not just against neighbors but also against two-hop neighbors with which it shares receivers that could benefit from both senders. In many cases this suppresses potential hidden terminals.
4.10
Limitations of UFlood
This section is a discussion of some of the limitations of UFlood.
4.10.1
Spatial Reuse
A good flooding protocol should maximize spatial reuse by allowing nodes to send concurrently when their transmissions do not interfere. In UFlood, distant nodes will likely not hear each other's feedback, and thus not consider each other as potential best senders. As a result, distant nodes that consider themselves to be local best senders will send concurrently allowing spatial reuse of wireless channel. However, an ideal protocol would choose the set of senders with the highest total amount of useful receptions over the whole network, accounting for interference. Therefore, UFlood deals with spatial reuse weakly.
4.10.2
Delivery Probabilities
Selecting the best sender requires knowledge of the delivery probabilities between every node-pair in the network, which is represented by PY,Z,b(Y) at all possible bit-rates b(Y) in the utility equation. Each node periodically measures and floods this information to the rest of the nodes. Both the probing and distribution are done at a low rate, so the delivery probability matrices are usually out of date. However, UFlood does not rely only on the delivery probabilities alone for its operation. Feedback helps in fixing the mistakes that occur because of out-of-date values.
4.10.3
Conservative Estimate of Lyz
Section 4.7.1 mentioned that Equation 4.2 is a conservative estimate of Lyz. That is, if Lyyz is greater than zero, then a transmission from Y is likely to benefit Z, while if zero, there is still some chance that a transmission would be beneficial. For example, in Figure 4-2, since nodes X and W together received four of the source's first-generation packets, they both can exchange packets to ensure that they receive four linearly independent packets each. Thus two transmissions from X should be useful to W. However, as soon as node W receives another coded packet from node X, both X and W will have a rank of three and all the bits set in W will also be set in that of X, thus Lwx = 0 even though one more transmission from W will still be useful to X. This is an example where Equation 4.2 incorrectly estimates a transmission from a node to be useless. However, this happens only when both the sender and the receiver have the same rank and the receiver has all those bits set that are set in the sender's bitmap. In addition, UFlood nodes transmit a burst of packets and do not calculate the utility for each transmission, which reduces the opportunity for miscalculating the utility of the senders.
4.10.4
Reliability
UFlood attempts to ensure that every node eventually receives enough coded packets to decode the current batch. Any node that does not receive batch-sized coded packets will eventually be handled by the parent-child entity explained in Section 4.8.3. However, UFlood faces a tension between achieving high throughput for the majority of nodes and delivering entire file to nodes with very unreliable links. UFlood sacrifices the latter in some cases: in particular, if a node's feedback packets go unheard for long enough, its neighbors will stop trying to retransmit data to it.
4.10.5
Look-ahead
Utility is a locally greedy heuristic: it does not account for the possibility that a sender with only a few low-quality links might deliver packets to nodes that would then be able to transmit to many receivers on high-quality links. In other words, one of the limitations
Figure 4-3: Illustration of the importance of look-ahead. of the utility equation is that it has no look-ahead. Suppose potential senders S1 and S2 in Figure 4-3 each have one node that can hear them (RI and R 2 ). All else being equal, Equation 4.1 will compute the same utility of 0.2 for the two senders. However, it could be the case that R, is the only path to a large number of other nodes while R2 is not. In that case, S1 should send first to start data flowing to those other nodes. In fact, in this example, R 2 has a better path from Ri and should receive packets from it and not from S2 , which
also is not considered by the utility equation. A better utility function should include look ahead.
4.10.6
Pipelining of batches
A UFlood source floods one batch at a time. In a large mesh network with hundreds to thousands of wireless nodes (as in many sensor applications), as it is UFlood is not the best flooding scheme. This is because a large part of the network (close to the source) that received all the packets of the current batch remains idle most of the time waiting for the flooding to complete in the rest of the network. Pipelining batches would enable several batches to coexist. Pipelining in UFlood should face several challenges. For example, UFlood's utility calculation should account for the coexistence of packets from different batches. The current implementation of UFlood does not include pipelining of batches.
4.11
Chapter Summary
The design of UFlood made two major contributions. First, it described the notion of utility as a local heuristic for selecting the best senders to achieve high throughput using low airtime. Second, the design demonstrated how to reduce feedback overhead with a compact representation and mechanisms to send feedback only when required. This chapter also describes the limitations of UFlood, which are avenues for future work.
64
Chapter 5 Implementation The UFlood implementation uses the Click 1431 software router toolkit running as a userspace daemon on Linux. The daemon sends and receives raw Ethernet frames from the wireless device using a libpcap-like interface. This chapter explains various components used in the implementation.
5.1
Data Structures
All the nodes maintain the following information.
Packet table Each node stores the coded packets it has received in the current batch along with the coefficients used in the construction of each of those packets in a table. It discards any newly arrived packet that is not linearly independent of the packets it already holds.
Node table Each node maintains a node table that holds the list of nodes in the network. This list is distributed by the source to rest of the nodes using a link state protocol.
Bitmap table Each node maintains a bitmap that contains 256 bits for the source and and for each sourcelike node whose first-generation packets have contributed to any coded packet it holds. It also maintains a recent copy of the bitmap for each of its neighbors derived from the feedback packet it received from them. This information is used to calculate IB,C in Equation 4.1. Rank table Every node stores its rank and the rank of its one and two-hop neighbor nodes. It also maintains an indicator bit for each of its neighbors; the bit is set if the status information it has about the neighbor is predicted (interpolated) rather than true. Delivery probability matrix Each node maintains a matrix [Plb(x) for every bit-rate b(X) containing an estimate of the link-layer delivery probability measured at bit-rate b(X) for every node-pair. Delivery probabilities are measured offline using the traditional probing method: each node sends back-to-back probe packets with 1024-bytes of random data for 30 seconds while other nodes record what fraction of probes they receive. This fraction provides the delivery probability between the corresponding node pairs, which is then flooded using a link state protocol, as in MORE 181 to the rest of the nodes.
5.2
Packet Formats
The nodes transmit three types of packets (data, feedback, and acknowledgment). remainder of the discussion uses K = 64. Data Packet A data packet from node X has the following contents: e A link layer broadcast header that includes X's address.
The
e A type field indicating a data packet. "
Current batch number.
" Rank of X. " Bitmap of X. * The 64 (K) coding coefficients for this packet, relative to the original native data. " 1024 bytes of coded data, constructed by a linear combination of all the data packets held by X. " The total number of packets X will send in the current burst. " The number of remaining packets in the current burst. " The ranks of X's neighbors, their IDs ,and a bit for each neighbor indicating whether the neighbor's rank is interpolated.
Feedback Packet A feedback packet from node X contains: * A link layer broadcast header that includes X's address. " A type field indicating a feedback packet. * Current batch number. " Rank of X. " Bitmap of X. " The ranks of X's neighbors, their IDs, and a bit for each neighbor indicating whether the neighbor's rank is interpolated. 'A 1-byte node ID refers to the position of the node in the node table.
A feedback packet's length is dominated by the bitmaps, and increases by 32 bytes for each source-like node that has been generating first-generation packets during the current batch. In the test-bed considered in this dissertation, each coded packet is constructed using the native packets of three source-like nodes at most.
Acknowledgment packet A node X sends an acknowledgment packet via unicast routing to the source when it is able to decode a batch, containing: " X's address. " Address of X's parent in the unicast path to the source. " A type field indicating an acknowledgment packet. " Current batch number. " Cumulative acknowledgment: a bitmap with one bit for each node; the bit corresponding to a node's position in the node table is set if the node has decoded the current batch. " The ranks of X's neighbors, their IDs, and a bit for each neighbor indicating whether the neighbor's rank is interpolated.
5.3
Bit-rate Selection
The delivery probabilities are used to select the best bit-rates. Each node uses its best bitrate to transmit all its data and feedback packets. Bit-rate selection for a sender X involves three main steps, as described below:
1. Choose best bit-rate for individual links
The expected transmission time (ETT) to send a packet from X to its neighbor Y is given by,
E
Y,b(X) ETTyb~)
=
)*b(X x~vb(x)1T
)
(5.1)
where b(X) is the bit-rate of node X and Pxy,b(x) is the delivery probability of the link from X to Y, when X transmits at bit-rate b(X). The cost metric of the link between nodes X and Y is given by Cx.y =
min
(ETTxYb(x))
(5.2)
b(X)=1,...,54
The minimum bit-rate that gives the lowest ETT corresponds to the best bit-rate for the link from X to Y. UFlood calculates this best bit-rate for all possible links.
2. Construct ETT-path from source to every neighbor node of the sender Dijkstra's algorithm 1141 is used to construct minimum cost paths from source to every neighbor of X using the cost metric (Cij) as link weights and assuming the cost to transmit packets from source to X as zero.
3. Select the best bit-rate for X Each path from the source node that passes through sender X, uses an outgoing link from X to one of its neighbors. These nodes rely on X for receiving source's data. The best bit-rate for sender X is the minimum of bit-rates from X to all its neighbors that rely on X for forwarding.
Whenever X finds that its transmissions are linearly dependent to the packets of its worst-connected neighbor that relies on it for source's data, X re-selects the best bit-rate by ignoring the worst-connected neighbor.
5.4
Coding and Decoding
UFlood's implementation of coding and decoding are similar to MORE 181. The native packets ni to nK are linearly combined using random coefficients cij to form coded packets K
pt. For example, the first coded packet pi = I ci 1 .n1 . The arithmetic is byte-wise, so that j=1
the first byte of pi is c1I times the first byte of ni plus C12 times the first byte of n2 and so on until
CIK
times first byte of nK- All the arithmetic is carried out in the finite Galois field
GF(2 8 ) 181. When a node receives K linearly independent coded packets, it decodes the native packets by using matrix inversion as follows:
n1
C11
... clK
p x(5.3) =
nK 5.5
CK1 ... CKK
PK
Main Loop
Figure 5-1 and 5-2 summarizes the set of actions executed when a packet is transmitted and received, respectively. The following discussion expands on various aspects. The sequence of steps that occurs during the execution of UFlood is as follows. * At the beginning of each batch, the source prepares the batch. The source starts by sending a burst of coded transmissions; burst size calculated from Equation 4.4. The rest of the nodes are silent during the source's initial set of transmissions (or until they estimate the source must have finished based on elapsed time). After that point, the source acts much like any other node, only sending if it has the highest utility. The source's packets are received by some of its neighbors. " All nodes calculate their utilities and the utilities of the nodes around them roughly once per burst. If a node is sending, the sequence is that it sends a burst of data packet, allows time for any feedback, then re-calculates utility, and perhaps sends again. If a node receives a data packet and the data packet indicates end of burst,
Data Packet Transmission
Feedback packet Transmission
Start of a batch
No
New batch 9 Yes end of batch
Figure 5-1: Flowchart of UFlood's main loop for packet transmission.
Packet Reception Received packet
return
Figure 5-2: Flowchart of UFlood's main loop for packet reception.
it also pauses for tfeedback, re-calculates utilities, and perhaps sends. If a node does not hear a packet, it waits a duration approximating the time necessary to send three data packets (tdata), perhaps sends a feedback, and re-calculates utilities. This is a necessary but not sufficient condition for feedback transmission (refer to Section 5.7).
The pause time tfeedback is the duration of a feedback packet transmission. For exam-
ple, for 1 Mbit/s 802.11 b, a 1024-byte data packet lasts approximately 8 milliseconds (tdata), and usually in UFlood, a feedback packet lasts less than one millisecond. A node uses the lowest bit-rate among all its neighbors to calculate tdata. On the other hand, tfeedback of a node is calculated using the lowest bit-rate among all the neighbors that have not decoded the current batch. The utility computation uses the feedback interpolation described in Chapter 4.7.3. * If the node has the highest utility among its neighbors at that point, it transmits a burst of packets; the burst size is calculated using Equation 4.3. " When a node receives a coded data packet, the node interpolates the states of its neighbors as explained in Chapter 4.7.3. If a node receives enough packets that it can decode the batch, it sends an acknowledgment to the source as explained in Section 5.6. " When a node X receives a feedback packet from node Y, it updates information about node Y and the ranks of Y's neighbors as explained in Section 5.7 " If the packet is an acknowledgment packet, node X forwards the packet to its parent node, only if X is on the unicast path from Y to the source node. * When the source receives acknowledgments from all nodes, it starts a new batch. " This process continues until the source successfully floods all the batches.
5.6
Batch Termination
Each node constructs a minimum cost unicast path back to the source node using the cost metric Cij (derived from ETT) as the link weights. A node, when required to transmit an acknowledgment, uses the bit-rate that provides minimum ETT to its parent in the unicast path to the source. When a node accumulates a batch-sized number of linearly independent coded packets, it decodes the batch. It then sends a message to its parent and persists until
its parent node acknowledges or until the node sees the start of a new batch. To reduce the acknowledgment traffic in the network, nodes send cumulative acknowledgments when they hear completion messages from more than one child.
5.7
Feedback Interpolation Rank of A
Bit is set, if rank(B) is interpolated
Rank of B
Bitmap of A_
1111110--
Headers
P(B)
1- - 6- P(C)
1
8
(a)
Bitmap(A): 1,2,3,4,5,6,7,8 Rank(A): 8 A 0.4
0.8
B
C _
Bitmap(B): 1,3,4,5,6 Rank(B): 5
Bitmap(C): 1,2,3,4,5,6,7,8 Rank(C): 8
B accepts A's prediction about C since P C,A > PC,B C rejects A's prediction about B since P BC> PBA
(b)
Figure 5-3: (a) A typical feedback packet in UFlood and (b) Illustration of feedback interpolation in UFlood. Figure 5-3 shows a typical feedback packet and how feedback interpolation is implemented in UFlood. The number on each link indicates its two-way delivery probabilities. For simplicity, assume K = 8 and nodes A, B, and C are part of a big network. At some point in time, node A has all the 8 packets of the batch. Suppose A transmits packets in burst, some of which are received by nodes B and C. The receivers of A 's transmission interpolate the states of their neighbors as mentioned in Chapter 4.7.3. For example, in Figure 5-3(b), when node B receives one of the A's packets,
it learns that A transmits 8 packets in the burst. For each of A's transmission, B assumes C received the packet with a probability 1. Thus B interpolates C's state (i.e., rank and bitmap) at the end of A's burst of transmission. Suppose A sends a feedback packet. Figure 5-3(a) shows the feedback packet of node A. When node B receives this packet, it accepts the rank information A provides about its neighbors (i,e., C) only if either of the following conditions hold. 1. If both A and B have the uninterpolated (or true) rank of C and A's feedback has higher rank for C than what B holds in its rank table. 2. If C has higher delivery probability to A than B. In the example, B accepts rank information supplied by A about node C because of condition 2 (Pc,Ab(C)
PC,B,b(C)). On the other hand, node C on receiving A's feedback,
rejects the information about B because both the conditions fail. This is because a feedback transmission from node B is more probable to be heard by C than A. Therefore, Node A might have interpolated B's state information based on stale feedback information.
5.8
Chapter Summary
This chapter discussed the implementation of UFlood protocol. It illustrated how UFlood handles transmissions, receptions, bit-rate selection, and feedback transmission and interpolation. The next chapter evaluates the performance of UFlood.
76
Chapter 6 Results and Discussion This chapter evaluates the performance of UFlood using flooding experiments on a 25node wireless testbed, comparing it with MORE and MNP. The main result is that UFlood achieves 150% higher throughput than MORE using 65% lower airtime. UFlood also uses 54% lower airtime than MNP, an existing flooding protocol to minimize airtime and achieves 300% higher throughput.
6.1
Experimental Setup
All the experiments, unless otherwise specified, run on a 25-node testbed deployed across 3 floors of an office building. Figure 6-1 shows the layout of the testbed. Each node has a 500 MHz AMD Geode LX800 CPU and a radio based on the Atheros 5212 chipset that operates in monitor mode. The nodes use a transmit power level of 12 mW. The testbed is large enough that many nodes cannot communicate directly with each other at this transmission power level. The transmissions are carried out at the 802.1 lb/g physical layer bit-rates ranging between I and 54Mbps. Some node pairs in this test-bed are about 4-hops away even at a bit-rate of IMbps. Since sender selection in UFlood relies only on two-hop information, the UFlood results on this test-bed can scale well for larger networks. Figure 6-2 shows the distribution of inter-node delivery probabilities at 5.5Mbps. These probabilities were measured as described in Chapter 5.1.
The curve has one point per
directed pair of nodes indicating the fraction of 1024-byte broadcast packets delivered from
* Floor 1 * Floor 2
A Floor 3
Figure 6-1: Physical layout of the 25-node testbed.
0
-
u5 0.3
E
-
0.2 0.1 0
0
0.2
0.6 0.4 Pair-wise Delivery Probability
0.8
1
Figure 6-2: CDF of pair-wise 1024-byte packet delivery probabilities at 5.5 Mbps for the testbed showing a wide range of link qualities.
one node to the other. The graph shows that even at a low bit-rate of 5.5Mbps, the testbed has a wide range of link qualities including many links with zero probability.
6.1.1
Evaluation Metrics
The two performance metrics throughput and airtime are computed as follows. Throughput(packets per second) =
F P* (te-ts)
(6.1)
N
Ti
Airtime(seconds)
(6.2)
i=1
Here F is the size (in bytes) of the file that the source floods, P is the number of bytes of data in the data packet (refer Chapter 5.2), t, is the time (in seconds) at which the source starts transmitting its first packet of the first batch, te is the time (in seconds) at which the source receives the last acknowledgment of the last batch, N is the total number of nodes in the network, and T is the total time (in seconds) node i spends in transmitting packets (i.e.,
data, feedback, and acknowledgment). Both the metrics include the overhead of UFlood's feedback packets. Increase in the feedback traffic reduces throughput and increases airtime.
6.1.2
Protocols used for comparison
The experiments compare UFlood with two existing flooding protocols: MORE 181 and MNP 1351. Chapter 3 explained the design of these protocols in detail. MORE is used for comparison with UFlood because MORE is a well-known high-throughput protocol. MNP is used for comparison because its objective is to minimize airtime by operating cautiously to reduce bandwidth consumption. This chapter will show that UFlood achieves higher throughput than MORE and lower airtime than MNP. We tested MORE and MNP using the same experimental setup as UFlood. The MORE software is the multicast implementation used in the MORE paper 181. We used the same code used by the authors of MORE. MNP is implemented as described in 1351, except that the nodes in MNP transmit coded packets as in UFlood. This helps to compare the sender selection of MNP and UFlood in a similar setting. This is required because it would be unfair to compare UFlood with non-RNC version of MNP, if most of the benefits that UFlood sees is due to use of RNC and not due to its sender selection or feedback mechanisms. MORE and MNP are designed to use a fixed bit-rate for all their transmissions. Thus, they are also compared with a version of UFlood called UFlood-R that operates at fixed bit-rate. All the transmissions of MORE, MNP, and UFlood-R are carried out at 5.5Mbps, which provides maximum flooding throughput on the testbed considered in this dissertation. The implementations of all the flooding protocols discussed in this chapter use the Click software router toolkit 1431 running as a user-space process on Linux.
6.1.3
Method
The flooding experiment involves the source distributing a 2MB file to the rest of the nodes. The default batch size (K) is 64 packets and 32 such batches are flooded. A data packet contains 1024 bytes of coded data plus protocol overhead (e.g., coding coefficients). Most of the results in this chapter report distributions of results over all choices of source node
L0.8 0.70.6 L: 0.
.. ..
--
*
0.5
5
- - -0--
MNP UFLOOD
0.4 0.3 -- -
-.
E
0
MORE UFLOOD-R
--
-
0.2 - ---
-
0.1 01 0
50
150 100 Throughput(Packets per second)
200
250
Figure 6-3: CDF over choices of source of the total throughput achieved while flooding a 2MB file. On average, UFlood's throughput is 63% higher than that of UFlood-R, 150% higher than MORE's and 300% higher than MNP's.
to emulate the effect that different topologies might have. Each point in each distribution represents the average of seven runs with a given source.
6.2
Main Results
This section presents measurements comparing the throughput and airtime of UFlood with those of UFlood-R, MORE, and MNP.
6.2.1
Throughput
Figure 6-3 shows the CDF of the total throughput achieved while flooding a 2MB file, comparing UFlood with UFlood-R, MORE and MNP over all possible sources. On average, UFlood's throughput is 150% higher than that of MORE and 300% higher than that of MNP. The graph also shows that UFlood's average throughput is 63% higher than UFloodR's, which demonstrates the effectiveness of UFlood's bit-rate selection algorithm. The
0.7
-
-
-
S0.6 -. - 0.
5
nS0. - -
.2
-
--
-...-.
..
- --.
E' O.8
- -
--
6 0.4 a)
- -
. . . . ..
UFLOOD-R
.. .
--
-
- --
-
MNP
UFLOOD
.... ....
...
...
. . . . .. . . . . . . . .
16 0.3 E 0 0.2r
r
--
0.1 0
0
20
40
60 80 100 Airtime (Seconds)
120
140
160
Figure 6-4: CDF over choices of source of the total airtime used in flooding a 2MB file. On average, UFlood uses 30% lower airtime than UFiood-R, 65% lower than MORE and 54% lower than MNP.
graph shows that UFlood-R's average throughput is 57% and 179% higher than that of MORE and MNP, which demonstrates that UFlood's higher throughput is due to sender selection as well as bit-rate selection.
6.2.2
Airtime
Figure 6-4 shows the airtime used by UFlood, UFlood-R, MORE, and MNP protocols during the flood. UFlood uses 54% lower airtime than MNP, and 65% lower than MORE. Low airtime helps UFlood achieve high throughput, and also reduce its impact on other network users. However, a low airtime alone is not enough to attain high throughput. For example, Figure 6-4 shows that MNP uses lower airtime than MORE but achieves far less throughput than MORE because MNP's feedback mechanism introduces high idle-time (refer to Chapter 3.3). UFlood achieves higher throughput and lower airtime than MORE and MNP because it simultaneously reduces both airtime and idle-time.
Why Does UFlood Win?
6.3
One of the main reasons behind UFlood's good performance is its sender selection. UFlood aims to select good senders by considering the factors mentioned in Chapter 2. UFlood's performance improvement over UFlood-R in terms of both throughput and airtime already illustrated the power of UFlood senders to choose good bit-rates. This section explores how well UFlood exploits the factors mentioned in Chapter 2.
6.3.1
Number of receivers
UFlood aims to select senders with many likely receivers. Figure 6-5 shows the CDF of the number of nodes that receive each data packet transmission during the flood of a single batch. On average, UFlood-R transmissions reach 50% and 20% more receivers than MORE and MNP transmissions, respectively. MNP's transmissions reach fewer receivers than UFlood-R's because MNP does not account directly for sender-to-receiver delivery probabilities. It is true that MNP dynamically chooses senders that hear requests from many receivers, which makes its transmissions useful to many more receivers than MORE's. However, in MNP, link asymmetry, collisions of the requests, and accidents of delivery easily can cause poor senders to receive more requests than good senders. UFlood-R, in contrast, uses measured forward link probabilities from sender to receivers in calculating utility, which allows UFlood-R's transmissions to reach many receivers. The difference between MORE and UFlood is not very huge because MORE considers the delivery probabilities of the node pairs in calculating the TX-credits of the nodes, which decides the sender for each transmission.
6.3.2
Number of useful receptions
In addition to choosing senders connected to many receivers, it is also to important to ensure that the transmissions of such senders benefit many receivers. UFlood aims to choose senders whose transmissions will convey new information to the most receivers. Figure 66 shows the CDF of the number of nodes that benefit from each data packet transmission
U-
0O5 S05
... .
.. .
. . . .. . . .
. ..
0.4 0.3 0.2 0.1 0
.-
-.-.-.-.-.-.-
-
0
1
2
3
4
5
6
7
8
Number of nodes that receive each data transmission
9
Figure 6-5: CDF over the data transmissions in a single batch of the number of nodes that received each transmission. UFlood-R's transmissions reaches 50% and 20% more nodes than MORE and MNP.
1 0.9
-
-
MORE
0.8 -
UFLOOD-R -
MNP
0.70.6
- - -
0.4
. . .. .
-.-.-
- -. -.-.-
-
0 .5
--
0.30 .2 - -
-
-
-
-
--
- -
0.1
0
1
2
3
4
5
6
Number of nodes that get benefitted by each data transmission
7
Figure 6-6: CDF over the data transmissions in a single batch of the number of nodes that benefited from each transmission. Typical UFlood-R transmissions benefit twice as many nodes as MORE and 20% more than MNP.
during the flood of a single batch. The average UFlood-R transmission is useful to twice as many receivers as the average MORE transmission and to 20% more receivers than the average MNP transmission. That is, UFlood-R transmissions are more likely to be linearly independent of data that receivers already hold, and are thus more likely to be useful in decoding the batch. This helps UFlood-R use fewer transmissions and complete flooding more quickly than MORE and MNP.
UFlood's dynamic choice of senders is superior to MORE's static TX-credit-based sender selection because UFlood chooses the best sender for each transmission exploiting both delivery probabilities and feedback from the neighbors. Chapter 2.3 explained the need to reconsider the choice of senders as receivers accumulate data. MORE's TX-credit calculations do not take in to account the current state of the receiver. That is, the probability of each MORE node transmitting is fixed during a transfer-the TXcredit values do not adapt to the actual pattern of receptions as a batch progresses. This causes problems toward the end of each batch, when a few nodes will likely be missing packets, but which nodes they are is hard to predict statistically; thus the best sender to satisfy those nodes often is not the one with the highest TX-credit. Another reason why the fixed TX-credit may perform poorly is that reception probabilities may change as a transfer progresses. In contrast, UFlood-R uses feedback to adjust its choice of sender as a batch progresses, reflecting actual receptions. It establishes priority among senders, rather than using per-sender rates as in MORE. In some cases, one sender is strictly more useful than another sender is (can be heard by a superset of receivers). UFlood-R's utility mechanism will cause the former sender to take priority over the latter, while MORE's TX-credit may cause either of them to send, which is left to the underlying CSMA MAC protocol to decide.
Finally, UFlood-R has an edge over MNP because MNP effectively bases sender choice on coarse information: whether or not senders and receivers hear single query and response packets.
u-
0.4
0.0.1 0 0
5
10
15
20
25
30
35
40
Throughput (Packets per second)
Figure 6-7: Use of low-probability links improves throughput by 88% for the median case.
6.3.3
Use of low probability links
One reason why UFlood's sender selection is good is because it accounts for low probability links. To evaluate this, UFlood-R is compared against a slightly modified version of UFlood-R, labeled UFlood-R(High Prob), which only includes links with delivery probability greater than 50% in all utility calculations. 20 of the 25 nodes in the test-bed are used to create a sparse network with many low-probability links. This is because, in a dense network, the real benefits provided by the use of low-probability links is usually low. Hence, the flooding experiments are carried out only on the chosen 20 nodes. Many wireless protocols attempt to avoid low quality links. In contrast, UFlood-R, like opportunistic unicast routing (e.g., ExOR [6]) considers even the weakest links of the network to exploit the potentially high aggregate delivery probability of large numbers of weak links. Figure 6-7 shows that such use of low probability links provides a 88% higher throughput over UFlood-R(High Prob). Removing all the sub-50% links reduces the opportunity for senders to consider many potential receivers. UFlood-R(High Prob) chooses the best senders to satisfy only their well-connected receivers. Although this approach marginally increases throughput for some well-connected nodes because the best sender choice is favorable for them, it degrades the throughput of
1
O O O "%R(OR(FMII9 000
0
.0 00 000
09
0 6
7
0
00
@%
O0 O
05
06
8
O
O O O5O1O 0
00
01
0
01
02
0.3
04
07
0.
09
1
Delivery probabilities of nodepairs
Figure 6-8: Packet receptions are highly correlated in our testbed. The x-axis shows P5 (r) for every link with non-zero delivery in the network. For each such point, there are multiple points on the y-axis, one for every other link from s. If all links were independent (from s), we would expect the points in this scatter-plot to all lie along the 45-degree y x line. -
the rest of the nodes in the network that have lower quality links to many of their neighbors. The conclusion is that when marginal links are available, UFlood-R uses them profitably.
6.4
Feedback
UFlood's feedback is another important reason that helps it achieve good performance. Apart from aiding dynamic sender selection based on the current state of the receivers, feedback from receivers makes senders aware of correlated reception. That is when multiple potential senders have received a similar set of packets, feedback helps them realize that it not be worthwhile for all of them to forward coded packets derived from that set. The value of a given node transmitting depends on the degree to which its previous receptions overlap receptions of the neighboring senders. MORE effectively assumes that receptions will be independent, whereas UFlood-R's feedback allows it to perform well even in the face of correlated reception. Chapter 3.4 discussed several research findings that illustrated the existence of correlation in wireless networks and its effect on the performance of wireless flooding. To explore the degree of correlation in the testbed, packet reception data are gathered in the following
way. For each link (directed pair of nodes) (s, r), the long-term packet delivery probability, P(r) are measured. For every other link (s,r') from the same sender, Ps(rlr')is measured. If packet receptions are independent, then this quantity should be equal to Ps(r); the larger the difference, the greater the correlation. Figure 6-8 shows the results as a scatter-plot. The x-axis shows P (r) for every link with non-zero delivery in the network. For each such point, there are multiple points on the y-axis, one for every other link from s. If all links were independent (from s), we would expect the points in this scatter-plot to all lie along the 45-degree y = x line. A large number of these points are above the 45-degree line, and in some cases, the majority of the points are well above it, suggesting that very few receptions in those cases are independent. There are almost no points below the 45-degree line; this makes sense because there is no physical reason to expect receptions to be anti-correlated (we have not investigated whether the one anomaly has any significance). The conclusion is that the spatial independence assumption does not hold well in the testbed. This dissertation does not demonstrate how much UFlood gains by making its nodes aware of correlated receptions over flooding protocols that assume independent receptions.
6.4.1
Analysis of Feedback Overhead
This section discusses how much traffic UFlood's detailed feedback packets introduce in the network and how good its compact feedback is. Figure 6-9 shows the overhead imposed by feedback, comparing total bytes of data packets alone with total bytes of both data and feedback packets transmitted by all the nodes. The experimental finding is that the feedback overhead is only 3%. This is mainly because UFlood-R sends compact feedback only when needed, which reduces both the size and frequency of feedback packets. Compact feedback representation helps to suppress feedback traffic in UFlood. However, as mentioned in Chapter 4.10.3, a compact feedback from a receiver helps potential senders to only conservatively estimate whether the sender's transmission would be useful to the receiver. Thus, it is important to evaluate how much the conciseness of UFlood's
12 0.8U .
20.70 - 6
-
- -
-
-
-
~dIS --- - -r
---
-
-
-
-
-
....
l 0.6 -
S0.5-
01
0
0
1 4 6 8 2 Amount of data transmitted to flood a 2MB file (MB)
12
Figure 6-9: CDF over different choices of source of the total bytes of data packets transmitted, compared to total bytes of both data and feedback packets. The totals include all headers up to and including the 802.11 header. On an average, the feedback overhead is 3%.
feedback compromises its performance in comparison to a detailed feedback mechanism (DETAILED), where a node's feedback includes coefficients used in the construction of each of its coded packets. As mentioned in Section 4.7, such a feedback packet might be huge and often require multiple transmissions. Thus, this experiment transmits the feedback for both UFlood and DETAILED schemes using ethernet to detach the overhead due to multiple transmissions for a fair comparison. In DETAILED feedback, each node broadcasts the coefficients of all of its coded packets after each data transmission in the network. Nodes calculate utility for every transmission based on the up-to-date feedback from all of the nodes in the network, which means there is no need for either bursty transmission or feedback interpolation. Figure 6-10 shows that the combination of techniques (i.e., compact feedback representation, feedback timing, feedback interpolation, and bursty transmissions) used by UFlood to reduce feedback traffic leads to an 1 I% reduction in throughput compared to DETAILED. Considering the practical difficulties in using frequent large amounts of feedback in wireless networks, this loss is acceptable.
0.7-
0.5 LL
00.4
2
40
60
80
10
.4. 6
10
~0.3-I 0.2 -
..
....
...
0.1_ 01 0
20
40
60
80
100
120
140
160
Throughput (Mbps)
Figure 6-10: Detailed Vs. UFlood's compact feedback representation. Compact feedback looses only II % throughput due to conciseness. A further reduction in UFlood's feedback traffic is possible if nodes include only their ranks in the feedback packets as in Rateless Deluge. The subsequent discussion will show that such a reduction has adverse effects on the performance of a flooding protocol. Figure 6-11 compares UFlood with a scheme similar to UFlood, except that the feedback includes only the rank of the nodes. This scheme is named UFlood-rank. In such a scheme, IB,C (in Equation 4.1) is I if, and only if, rank(B) > rank(C), so that the utility calculation will assume that B benefits C only in cases where B has more packets than C. This simplification eliminates most of the complexity and communication overhead of the feedback scheme, but at the same time compromises on accuracy because it always assumes IB,C to be 0 when rank(B) < rank(C), while it is not always the case. Figure 6-11 shows that UFlood-R's feedback, in spite of increasing feedback traffic, results in significantly lower airtime of 23% than the simpler rank-only scheme, justifying UFlood-R's compact feedback representation.
6.5
Factors Influencing the Performance of UFlood
This section discusses the factors influencing the performance of a flooding protocol.
0.8.2 07....
0.6 0.50.4 -~0.3-
U 0.2
-
0.1
00
5
10
15
20
25
30
Airtime(Seconds)
Figure 6-11: CDF over different choices of source of total airtime, comparing UFlood-R with a simpler version that includes only rank in feedback packets.
6.5.1
Network density
The density of nodes per radio range affects the performance of a flooding protocol, even if the number of nodes in the network remains the same. This section studies the effect of density on the performance of UFlood-R using two five-node networks: a dense network where all nodes can communicate directly with each other and a sparse network where each node has a link to at most two other nodes. Figures 6-12 and 6-13 show the performance of UFlood-R and MORE in the two networks. The throughput advantage of UFlood-R more than doubles in the sparse network compared to the dense network. This is because low delivery probabilities in the sparse network cause different nodes to receive different packets, which increases the importance of sender selection. In addition, in sparse networks, only a few nodes possess packets useful for others, and MORE's static sender selection does a good job. Whereas, in dense networks, there are many potential senders for every transmission with hard-to-predict states of neighbors that result from probabilistic reception, and choosing the best sender in such scenarios is challenging. UFlood-R's feedback-based dynamic sender selection does better than MORE's static selection for the reasons mentioned in Section 6.3.
Mean Improvement of UFlood-R over MORE = 16%
0
50
100
150
200
250
Overall throughput per node (PPS)
300
350
Figure 6-12: Mean throughput improvement on a 5-node dense network is 16%
Mean Improvementof UFLOOD-R over MORE = 38%
60
80
100
120
140
160
Overall throughput per node (PPS)
Figure 6-13: Mean throughput improvement on a 5-node sparse network is 38%
0
@a 100C)
-4 C.) CU
60
-
S~ 60:3
:3
0~40-
0
-c 20
8
16
32
64
Batchsize
Figure 6-14: Throughput of UFlood-R, MORE and MNP for various batch sizes
6.5.2
Batch size
Another factor that affects the performance of UFlood-R is the batch size, the number of native packets used in the construction of a coded packet. Figures 6-14 and 6-15 show the performance of UFlood-R, MORE, and MNP on the 25-node testbed, as the batch size increases. Each bar represents the performance averaged over all the sources. A larger batch size means the source should wait longer for each batch to complete since every node in the network should receive a large number of coded packets before decoding each batch. In a large network, this is disadvantageous because nodes, especially those closer to the source, remain idle most of the time waiting for the rest of the nodes to receive the packets of the current batch. On the other hand, smaller batch size increases the number of batches, which means the per-batch overhead increases during a period toward the end of the batch when progress is slow while satisfying the last few nodes. Thus, the nodes wait a longer time between completion of each batch. Figure 6-14 shows that throughput decreases with decrease in batch size. This effect is more prominent in sparse networks with poor links, where each batch takes more time to complete than a dense network.
*0 0 CD)
U) 15 CD
E
10
0
8
32
16
64
Batchsize
Figure 6-15: Airtime of UFlood-R, MORE and MNP, for flooding a 2MB file, as batch size varies.
6.5.3
Asymmetric Links
Wireless networks often suffer from asymmetric links. A node X might be able to hear all the transmissions of node Y perfectly, while Y might not hear any of X's transmissions. This is an example of a node-pair with fully asymmetric links. In real wireless networks, however, most of the node pairs often suffer from partial asymmetricity. Asymmetricity between a node pair XY is defined as follows. Asymmetricity
Pxy -
, if Py'x > Pxy
(6.3)
Here Px'y denotes the delivery probability of the transmissions from node X to Y. As Px,y reaches Py,x, F{ reaches one and the links between X and Y becomes more symmetrlC.X ric. Figure 6-16 plots the CDF of asymmetricity values between node pairs in the 25-node network. The figure clearly indicates that 25% of the node pairs have asymmetricity of more than 0.5. Why this matters is because it leads to incorrect sender selection caused by loss of feedback on highly asymmetric links. UFlood copes with asymmetry by includ-
.. .
0.9 -. 0.80.7 0.60
...
0.5 - . . .. .
0.4 -
0.3 --0.2-
-
0.10
0.1
0.2
0.3
0.6 0.5 0.4 Asymmetricity
0.7
08
09
1
Figure 6-16: CDF of asymmetricity of the links in the testbed.
ing two-hop information in the feedback packets. In addition, a node in UFlood-R knows about a neighbor not only through the direct feedback it hears from it but also through the feedback from its other neighbors, which reduces the loss of feedback due to asymmetricity. This dissertation notes that increase in asymmetricity has adverse affects on the performance of UFlood but does not evaluate it, since it is difficult to create test-beds with desired level of asymmetricities.
6.5.4
Hidden Terminals
This section evaluates how UFlood performs in the presence of hidden terminals in the network. A few of the nodes in the test-bed were carefully placed to create hidden-terminals in the network. The flooding experiment is conducted considering each node as the source node. In many situations, MORE stops working because of persistent collisions caused by hidden terminals, whereas UFlood and MNP works to completion. This is because UFlood reduces the effect of hidden terminals by including the two-hop neighbors' rank in feedback packets. In MNP, the receivers of the hidden nodes send a request (advertisement) only to one of the senders. Since, the two hidden senders more often receive different number of requests
only the sender with highest number of requests sends at any time. Thus, MNP also runs to completion in the presence of hidden terminals.
6.6
Summary of Findings
A brief summary of the experimental findings from this section is as follows: " UFlood, on average, achieves 150% higher throughput than MORE using 65% lower airtime. UFlood also uses 54% lower airtime than MNP, an existing flooding protocol to minimize airtime and achieves 300% higher throughput. " UFlood achieves 63% higher throughput with 30% lower airtime than UFlood-R, which demonstrates the power of UFlood's bit-rate selection. " The main factors that contribute to the high performance of UFlood are its sender selection and feedback mechanisms. " Maximizing number of receivers that benefit from each transmission, opportunistic use of low-probability links, and dynamic sender selection are vital in improving the performance of UFlood.
Chapter 7 Application: WiFi Multicasting using Client Cooperation Traditionally, flooding in wireless mesh networks has been mainly used for disseminating route updates in routing protocols. The real potential of flooding has remained largely unexplored due to the limited use of mesh networks. Recent trends indicate an enormous growth in wireless mesh network deployments and a need for good flooding protocols for new applications on mesh networks, such as real-time video broadcasting and disaster management (refer to Chapter 8.2). UFlood can be of use to some of these applications that require both high throughput and low airtime. This dissertation proposes one such potential application of UFlood in WiFi multicasting. This chapter describes the design of UCast, a WiFi multicasting protocol that uses mesh flooding to improve its performance. Multicast is a method to distribute live streams such as seminars and lectures inside campuses and companies. With the rapid rise in WiFiconnected clients, the delivery of such multicast streams over infrastructure 802.11 networks is becoming important. Unfortunately, multicast over such networks often is inefficient, suffering from low throughput and significantly reducing the capacity available for other traffic. Section 7.1 discusses the reason behind this inefficiency. UCast is a system that uses cooperative client flooding to improve the delivery of WiFi multicast streams. UCast clients subscribed to a given multicast group along with the WiFi access points (APs) form a cooperative mesh network over which the multicast data is dis-
tributed from APs to the clients. The key to making this idea work is to use an efficient and robust flooding of data over the cooperative mesh. The main aim of this chapter is to show how much client cooperation using flooding can help UCast. The performance of UCast is analyzed using different flooding schemes for underlying client cooperation. The rest of the text represents these variations in the form UCast/X, where X is the corresponding flooding protocol used in UCast. Experiments on an indoor WiFi test-bed show that UCast/UFLOOD can achieve 300600% improvement in throughput compared to a scheme that is similar to it except that only APs send data. UCast/UFLOOD also improves throughput compared to DirCast+, an existing WiFi multicast protocol. For both throughput and airtime, we find that UCast/UFLOOD is superior to all others.
7.1
Related Work
Over the past few years, two big trends in networking have been the rise of video, particularly live streaming content 19, 131, and the growth in the number of WiFi (802.11) devices and networks. For example, the citywide network in Chaska, Minnesota has provided WLAN coverage in a 15 square miles area since October 2004. A similar network is operational in Taipei consisting of 2300 APs and providing coverage to 50% of the city's population, and is planned to be extended to provide coverage to 90% of the city's population in the near future [101. A study by Cisco 1131 projects that mobile video will generate 66% of all mobile traffic by 2015. One might expect WiFi, which is broadcast at the physical layer to be a natural fit for multicast traffic. Yet WiFi multicast performs poorly 12, 9, 151. First, in many networks, multicast runs at a low rate such as 6 Mbps or 11 Mbps in order to be heard even by poorly connected clients. This makes multicast slow and slows down other traffic by occupying an inordinate amount of airtime. Second, multicast frames do not use 802.11 link-layer ACKs and retransmission because the standard strategy would lead to the ACK implosion/collision problem. That is reliable multicast requires each client to send acknowledgment packets back to its AP, which is difficult to scale to a large number of clients. Hence,
the application-visible loss rate for multicast can be much higher than for unicast. The problem is so severe that one currently popular commercial approach converts multicast data to unicast before transmission over the air 1331. The problems with infrastructure WiFi multicast have been documented well (e.g., 1491), and the problem has received some attention recently, but no previous scheme exploits client forwarding. DirCast 191 decreases the airtime and increases the reliability of WiFi multicast using two techniques: (i) each AP sends packets as unicast to the worst-connected client, which sends acknowledgments, while other nodes receive in promiscuous mode and gain reliability with Forward Error Correction (FEC) and (ii) the clients associate with APs in a way that maximizes the bit-rates at which APs can send multicast frames. The main advantage UCast has over DirCast is that UCast uses client forwarding to reduce airtime and increase throughput. Section 7.5 compares the performance of UCast over DirCast. Sen et al. 1491 show that even modest levels of multicast traffic can result in very poor performance. Their previous work 1481 suggests use of smart beam-forming antennas to improve performance of WiFi multicasting. This idea requires special hardware not available in most APs today. At the physical layer, SMACK 1161 avoids the ACK implosion problem by encoding N ACKs from different nodes on N OFDM sub-carriers; this idea requires changes to the physical layer. Chen et al. 1101 show that optimizing various objectives (minimize the load of APs, balance the load of APs, maximize the number of users) is NP-hard and propose approximation algorithms to make multicast more efficient, giving simulation results. Another idea 115, 361 is leader election among receivers to send link-layer ACKs. These ideas are all complementary to UCast. For unicast, SoftRepeater 121 addresses the WiFi rate-anomaly problem, in which a few slow clients cause APs to provide poor throughput to well-connected clients. Highrate SoftRepeater clients opportunistically transform themselves into repeaters for low rate clients. UCast exploits such client participation, but the scheme is tailored to multicast and includes many new techniques to choose the forwarders.
7.2
Goals and Assumptions
The goal of UCast is to distribute data from a server, connected to several APs over ethernet, to all clients subscribed to a multicast group. UCast enlists clients to forward data when that helps to improve the performance. The main performance goals are throughput and airtime, as defined in Equation 6.1 and 6.2, except that the nodes in the mesh refer to APs and clients. The source in UCast is the set of APs. The design of the protocol relies on the following assumptions. " A large quantity of data, typically real-time video, is to be multicast reliably. * WiFi clients connect to one of the APs: in the experimental implementation, clients pick the AP from which the packet delivery rate is highest at 5.5 Mbps. The clients send and receive unicast traffic using the AP they are associated with. " UCast makes opportunistic use of all multicast transmissions each client overhears, including transmissions from all APs, not just the client's AP. To use UCast, a client ideally should be able to associate with an AP while also communicating in monitor mode with other clients; this capability is available on many commodity cards and drivers. * The APs and clients are equipped with a omni-directional antenna and can transmit packets at adaptive bit-rates. " It is assumed that clients are willing to cooperate because the reduction in airtime helps all traffic. This seems reasonable in single-enterprise networks where power is not limited. In Section 7.5.3, the conditions under which it may be profitable to have clients not subscribed to a group participate in the flooding of packets is explored.
7.3
Key Ideas of UCast
UCast uses two main ideas: (i) clients cooperatively forward data for each other, and (ii) clients of one AP may forward data to the clients of another AP, perhaps reducing the 100
number of packets the other AP needs to send. To illustrate, Figure 7-1 shows a network with two APs A and E. The other nodes are clients, all of which subscribe to the multicast group; B, D, and C associate with A, and F associates with E. Each number indicates the delivery probability of the corresponding link. Since the delivery probability between A and D is 20%, multicasting a packet directly from A to all its clients would require an expected five link-level broadcast transmissions. If B or C forwards, only an expected two transmissions will be required. Roughly speaking, the benefits of this technique depend on how wide a spread of link qualities an AP's clients have. A(AP)
E(AP)
0.2
Figure 7-1: Illustration of the benefits of clients forwarding data and overhearing packets from multiple APs. Figure 7-1 also illustrates the benefit of opportunistically overhearing transmissions. Client C can hear packets from both APs, and is in a good position to forward to clients of both APs (D and F). In this situation, AP E need not send all (or perhaps any) of the data; instead, it is sufficient for C to receive all data from A. The result is a 5x reduction in the airtime.
7.4
Design and Implementation
In UCast, source nodes are the APs and they obtain the data to be flooded over the wired network from a remote server. A subset of the clients of each AP that are interested in the multicast data joins the multicast group through subscription. Clients identify the multicast group using the destination address in the 802.11 link-layer header. The clients along with 101
the sources form a mesh network. UCast uses a mesh flooding scheme to flood the data from the sources to all the clients in the mesh network. There is more than one source flooding the same file. Each source considers one batch of K native packets at a time. They create K coded packets from the current batch's native packets and flood one batch at a time. The clients, on receiving enough linearly dependent coded packets to decode a batch, send unicast acknowledgments back to the AP with which they are associated. Since the wired background connects all the APs, they exchange the acknowledgments with one another using the wired network. Once all the APs received acknowledgments from all the clients in the network, either through the clients or through other APs, they simultaneously start flooding the next batch.
7.5
Evaluation
This section presents measured throughput and airtime of UCast. Experiments are conducted on the same experimental test-bed described in Chapter 6. The UCast measurements designate some of the nodes of the test-bed as "APs," and others as "clients". Depending on the experiment, between 3 and 5 of the nodes are designated as APs. Each client associates with the AP from which it has the highest packet delivery ratio at 5.5Mbps.
7.5.1
Comparative Protocols
UCast is compared with two schemes: a Strawman protocol that does not use client forwarding, and DirCast+, a variant of DirCast. Strawman is UCast minus client forwarding (or the mesh flooding among the clients). Strawman is not the same as any existing WiFi multicasting protocol but shares the general approach of APs communicating directly to the clients. Each AP broadcasts new coded packets for a batch until all of its clients indicate they are able to decode the batch. Clients opportunistically listen for packets from any AP. When a client can decode a batch, it sends an acknowledgment by unicast multi-hop routing to its AP similar to UCast. When all clients of the multicast group have decoded the batch, the APs move on to the next batch. All the Strawman APs use the same fixed bit-rate of 5.5Mbps. The main point of the 102
160140-
-
140
120
S120
-
-
Strawman
UCast/UFlood-R
___
UCast/UFlood -.-.-.-.-.-.-. DirCast+
100-
80-
o 60 -/ 0
20
00
0.1
0.2
0.4
0.3
0.5
0.6
0.7
Minimum delivery probabilities to clients
Figure 7-2: Throughput achieved as a function of the minimum allowed delivery probability on client/AP links.
Strawman protocol is to be similar to UCast/UFLOOD except for client forwarding. It also is loosely inspired by DirCast, though it lacks DirCast's rate-optimnized association. DirCast+ is similar to DirCast [91, as described in Section 7.1, except that it uses a coding scheme and end-of-batch acknowledgments from clients to APs, similar to UCast. UCast is compared against DirCast+, rather than against DirCast to show that it is not just UCast's use of coding that gives it higher throughput and airtime.
7.5.2
Throughput and Airtime
The reason one might expect UCast to increase performance is that typically some clients have significantly worse AP links than others, and clients with bad AP links may well have good links to other clients. This is likely to vary from one AP network and thus we look at the performance of UCast as a function of how bad the worst client-AP links are. Figures 7-2 and 7-3 show the results of a set of experiments in which the minimum allowable delivery probability for a client to associate with an AP is varied. As the minimum is decreased, fewer APs are required. Nevertheless, there is a fixed population of X clients and Y APs; some of the APs are not used when the minimum is low. The net effect is that 103
200 -
180-
-
- Strawman -
160 -----
\.........
UCast/UFIood-R UCast/UFlood
DirCast+
140120-
0
40-200
0
' 0.1
0.2
0.3
0.4
0.5
0.6
0.7
Minimum delivery probabilities to clients
Figure 7-3: Airtime as a function of the minimum allowed delivery probability on client/AP links.
client forwarding is likely to be more useful in the left-hand part of each graph. Each data point represents the average of five runs with different choices of APs. The graph x-axes only go up to 0.6 because it would take a relatively large number of APs to ensure every client had 0.7 or higher delivery probability. Figure 7-2 shows that UCast/UFLOOD achieves 100-200% higher throughput than UCast/UFLOOD-R, which demonstrates the power of UFlood's bit-rate selection algorithm. UCast/UFLOOD can select bit-rates to deliver data faster on better-than-average links, and with high delivery probability on bad links. Figure 7-2 also shows that UCast/UFLOOD-R achieves 2-4x higher throughput than Strawman and DirCast+. The main reason is that UCast/UFLOOD-R's forwarding through clients often can deliver data in two transmissions that Strawman and DirCast+ must retransmit many times. Even when the worst client/AP connection has a delivery probability of 0.6, UCast/UFLOOD-R still delivers data 2x faster than Strawman and DirCast+. One reason is that there is often a client that is better situated than some of the APs. UCast/UFLOOD-R will arrange for that client to forward, and will not send anything from ill-suited APs; Strawman and DirCast+, on the other hand, are forced to send from 104
such APs. Another reason is that, even in situations where client forwarding is not useful, UCast/UFLOOD-R APs coordinate so that the most useful AP sends first, which may result in other APs not needing to send as much or at all. Figure 7-2 shows similar performance differences for DirCast+ and Strawman over UCast/UFLOOD-R, but for different reasons. DirCast+ gains from its rate-aware association scheme while Strawman gains due to the feedback from the clients. However, UCast/UFLOOD-R beats both the protocols due to client cooperation. Moreover, in the test-bed, DirCast+ selects either 5.5 or 1 Mbits/s at least for one of the APs limiting the gain achieved using DirCast+'s association algorithm. Figure 7-3 supports the claim that UCast/UFLOOD-R derives its throughput advantage largely by consuming low airtime: its careful choice of sender and their bit-rates makes each UCast/UFLOOD-R transmission more useful than corresponding Strawman and DirCast+ transmissions.
7.5.3
Client Cooperation
The hypothesis is that UCast derives gains from two factors: first, the cooperative forwarding done by APs and clients, and second, the use of feedback that, even in the absence of any client forwarding, could enable some APs to avoid forwarding as much data. Nevertheless, in some situations, only a subset of multicast subscribers may be willing to forward cooperatively. Figure 7-4 shows the effect of varying the fraction of cooperating subscribers in a configuration with 20 clients and 4 APs. The cooperating clients are chosen randomly. Throughput increases quickly with the cooperation level, so even small amounts of cooperation help significantly. Another noteworthy conclusion from Figure 7-4 relates to the benefits of feedback even when there is no cooperation (the throughput when the x-axis is 0). UCast/UFLOOD-R is 25% faster than Strawman in this case; this gain is entirely the result of some APs not sending all the packets, benefiting instead from other APs and opportunistic receptions of coded data. 105
1101
100-
1
1
1
1
11
UCast/UFlood-R - - - Strawman
90-
8 3
80d
807060-
50--
C) 30-20-
100
0
0.1
0.2
0.3
0.4
0.5
0.6
0.7
0.8
0.9
1
#cooperating clients/total #clients
Figure 7-4: Effect on throughput of varying the fraction of clients that cooperate in flooding.
UCast/UFLOOD's client cooperation is powerful because it uses UFlood for mesh flooding. Figure 7-5 and 7-6 shows the total throughput and airtime for multicasting a 2MB file on the test-bed, comparing UCast/UFLOOD and UCast/UFLOOD-R with DirCast+, UCast/MORE, and UCast/MNP for 5 configurations with different choice of APs. All the variations of UCast win over DirCast+, which demonstrates the power of client cooperation. UCast/UFLOOD-R wins over UCast/MORE and UCast/MNP due to higher throughput using lower airtime that UFlood provides to UCast compared to MORE and MNP flooding protocols.
106
0.7 - 0.6 0.5 -* D
0.40
8
0.3 -
U
.+
.- I. . .
0.2-
0.1 0
0
10
40 30 Throughput(PPS)
20
50
70
60
Figure 7-5: Throughput of UCast/UFLOOD-R is 400%, 50%, and 180% higher than DirCast, UCast/MORE and UCast/MNP, respectively.
1* 0.90.80.70Y) 0
0.6-
~0.5-*
4*-
0.4 0 LL0 .
rCast*
Dast/UFlood-R Dast/MORE 'ast/MNP 40
50 60 70 Airtime(Seconds)
80
90
100
110
Figure 7-6: UCast/UFLOOD-R consumes 66%, 44% and 37.5% lower airtime than DirCast, UCast/MORE, and UCast/MNP, respectively.
107
108
Chapter 8 Conclusion This chapter summarizes the contributions made in this dissertation and directions for future work.
8.1
Summary
A protocol that floods data efficiently to all nodes in a wireless mesh network is useful for applications such as software updates. An ideal flooding protocol should transmit each packet the smallest total number of times at efficient bit-rates to achieve highest throughput using lowest airtime. With probabilistic delivery, opportunistic receptions, and spatial diversity offered by broadcast transmissions in wireless networks, the problem becomes much more difficult to implement. This dissertation makes the following significant contributions. First, it proposes UFlood, a flooding protocol for wireless mesh networks. UFlood is the first protocol to combine the opportunistic receptions of gossip protocols with a precise calculation of transmission utilities using delivery probabilities and knowledge of what packets neighboring nodes have, to decide which nodes should transmit at any given time and what bit-rates to use. UFlood also takes advantage of broadcast transmissions to reduce the number of redundant transmissions without pre-computing a transmission topology or schedule. It uses RNC to increase the usefulness of transmissions, and knowledge of what coded information receivers already hold to help it choose the sender that ensures high throughput and low airtime. In 109
particular, UFlood chooses senders whose transmissions are most likely to be linearly independent of the packets that receivers already hold. A key idea in UFlood is that because the best sender changes with each reception, the utility calculation tracks these changes to select best senders dynamically. Second, the dissertation describes a novel compact feedback mechanism in which nodes exchange infrequent feedback packets describing the coded information it has received and interpolate the status of their neighbors when required. UFlood sacrifices some of the potential reduction in feedback traffic that coding in principle could provide, but uses the feedback judiciously to pick which nodes should suppress their transmissions. Experiments on a test-bed show that this sacrifice is worthwhile. The third contribution of this dissertation is a novel bit-rate selection algorithm to calculate the best bit-rate for each UFlood transmission. UFlood's bit-rate selection trades off the speed of high bit-rates against the larger number of nodes likely to receive at low bit-rates. The fourth contribution of this dissertation is an evaluation which shows that UFlood achieves 150% higher throughput than MORE using 65% lower airtime consumption in transmitting the packets. UFlood also achieves 300% higher throughput using 54% lower airtime than MNP. UFlood's bit-rate selection provides a 63% improvement in throughput over a version of UFlood without bit-rate selection. Final contribution of this dissertation is to present UCast, a new system that uses cooperative client flooding to improve the delivery of multicast streams. In UCast, clients connect as usual to the best AP, but in addition all clients subscribed to a given group form a cooperative mesh along with APs over which they forward multicast packets for each other. The key to making UCast work is UFlood, which is used for efficient flooding of data over the cooperative mesh. Experimental results over an indoor multicast test-bed show that UCast improves throughput by 300-600% over both strawman, a protocol similar to UCast except that only APs send, and DirCast+, which also does not use client cooperation. 110
8.2
Future Work
Chapter 4.10 discusses few limitations of UFlood that needs to be addressed. Apart from this, the dissertation leaves several interesting directions for future work. Many applications require flooding for mobile mesh networks such as distributed mobile sensing systems for traffic mitigation, mobile sensor networks for intruder detection, and mobile flooding in battlefield and disaster relief situations. In its current form, UFlood may not work well in such situations because the utility equation relies on the delivery probabilities of the links between the node pairs, which changes often in a mobile environment. There are also flooding applications that aim to optimize metrics other than throughput and airtime as defined in this dissertation. For example, applications like disaster management require the source's data to be delivered quickly to as many nodes as possible rather than to all the nodes in the network. That is, it aims to maximize individual throughput of the nodes rather than the overall throughput of the network. Real-time video streaming applications, on the other hand, require only a subset of the source's data to be flooded as quickly as possible. UFlood, in its current form, may not work well for all these applications. The sender and bit-rate selections in UFlood may have to be altered to optimize these other metrics and is left to future study. In summary, this dissertation presented UFlood, a new protocol for efficiently flooding data over wireless networks. UFlood achieves high throughput and low airtime by carefully choosing which nodes send exploiting knowledge of delivery probabilities, bit-rates and of opportunistic receptions. Looking ahead, this dissertation can be extended to flood a large quantity of data in mobile multi-hop networks.
III
112
Bibliography S1I
R. Ahlswede, N. Cai, S. R. Li, and R. W. Yeung. Network Information Flow. IEEE Trans. on Infbrmation Theory, July 2000.
121 Paramvir Bahl, Ranveer Chandra, Patrick P. C. Lee, Vishal Misra, Jitendra Padhye, Dan Rubenstein, and Yan Yu. Opportunistic Use of Client Repeaters to Improve Performance of WLANs. IEEE/ACM TON, 17, August 2009.
131 S. Banerjee, A. Misra, Jihwang Yeo, and A. Agrawala. Energy-efficient broadcast and multicast trees for reliable wireless communication. In WCNC 2003. [41 Suman Banerjee and Archan Misra. Adapting Transmission Power for Optimal Energy Reliable Multi-hop Wireless Communication. In (WiOpt '03).
151 John Bicket, Daniel Aguayo, Sanjit Biswas, and Robert Morris. Architecture and evaluation of an unplanned 802.11 b mesh network. In ACM MobiCon '05. 161 Sanjit Biswas and Robert Morris. ExOR: Opportunistic multi-hop routing for wireless networks. In ACM SIGCOMM '05.
171 http: //www.boundlesss.com/wireless-videosurveillance.html. 181 Szymon Chachulski, Michael Jennings, Sachin Katti, and Dina Katabi. Trading Structure for Randomness in Wireless Opportunistic Routing. In SIGCOMM '07.
191 R. Chandra, S. Karanth, T. Moscibroda, V. Navda, J. Padhye, R. Ramjee, and L. Ravindranath. DirCast: A Practical and Efficient Wi-Fi Multicast System. In ICNP, 2009.
1101 Ai Chen, Dongwook Lee, and Prasun Sinha. Efficient multicasting over large-scale WLANs through controlled association. Comp. Networks, 53(1), January 2009. 1111 Ching-Chuan Chiang, M. Gerla, and Lixia Zhang. Shared tree wireless network multicast. In Computer Communicationsand Networks 1997.
1121 Ching-Chuan Chiang and Mario Gerla. On-Demand Multicast in Mobile Wireless Networks. In ICNP '98.
1131 Optimizing Enterprise Video Over Wireless LAN. Cisco white paper c 1-577721, 2010. 113
1141 Richard Draves, Jitendra Padhye, and Brian Zill. Routing in Multi-radio, Multi-hop Wireless Mesh Networks. In MobiCom, 2004. 1151 Diego Dujovne and Thierry Turletti. Multicast in 802.11 WLANs: An Experimental Study. In MSWiM, 2006. 1161 Aveek Dutta, Dola Saha, Dirk Grunwald, and Douglas Sicker. SMACK: a SMart ACKnowledgment scheme for broadcast messages in wireless networks. In SIGCOMM, 2009. 1171 http://www.tessco.com/yts/partner/manufacturerlist/vendors/ firetide. 1181 Chao Gui and Prasant Mohapatra. SHORT: Self-healing and optimizing routing techniques for mobile ad hoc networks. In MobiHoc '03. 1191 Andrew Hagedorn, David Starobinski, and Ari Trachtenberg. Rateless Deluge: Overthe-Air Programming of Wireless Sensor Networks Using Random Linear Codes. In Proceedingsof the 7th internationalconference on Information processing in sensor
networks, IPSN '08, pages 457-466, Washington, DC, USA, 2008. IEEE Computer Society. 1201 T. Ho, M. Medard, R. Koetter, D. Karger, M. Effros, J. Shi, and B. Leong. A Random Linear Network Coding Approach to Multicast. IEEE Trans. on Info. Theory, 52(10), October 2006. 121] Gavin Holland, Nitin H. Vaidya, and Paramvir Bahl. A Rate-Adaptive MAC Protocol for Multi-Hop Wireless Networks. pages 236-251, 2001. 1221 Jonathan W. Hui and David Culler. The Dynamic Behavior of a Data Dissemination Protocol for Network Programming at Scale. In SenSys 2004. 1231 S. Jaggi, P. Sanders, P.A. Chou, M. Effros, S. Egner, K. Jain, and L.M.G.M. Tolhuizen. Polynomial time algorithms for multicast network code construction. IEEE Transactionson Information Theory, 51(6), June 2005.
[241 G. Jakllari, S.V. Krishnamurthy, M. Faloutsos, and P.V. Krishnamurthy. Power Efficient Broadcasting with Cooperative Diveristy in Ad hoc Networks. In IEEE WPMC 2005.
1251 D. Johnson, D. Maltz, and J. Broch. DSR: The Dynamic Source Routing Protocol for Multihop Wireless Ad Hoc Networks, chapter 5, pages 139-172. Addison-Wesley,
2001. 1261 Ad Kamerman and Leo Monteban. WaveLAN-II: a high-performance wireless LAN for the unlicensed band. Bell Labs Technical Journal,2:118-133, 1997.
1271 Intae Kang and Radha Poovendran. Iterated Local Optimization for Minimum Energy Broadcast. In WIOPT '05.
114
1281 Intae Kang and Radha Poovendran. Maximizing network lifetime of broadcasting over wireless stationary ad hoc networks. Mobile Network Applications, 10(6), 2005. 1291 K. Karenos, A. Khan, S.V. Krishnamurthy, M. Faloutsos, and X. Chen. Local versus Global Power Adaptive Broadcasting in Ad Hoc Networks. In IEEE WCNC, 2005. 1301 Sachin Katti, Dina Katabi, Hari Balakrishnan, and Muriel Medard. Symbol-Level Network Coding for Wireless Mesh Networks. In ACM SIGCOMM 2008. 1311 Byung-Seo Kim and Sung Won Kim. Dynamic rate adaptation for wireless multicast. In Military Communications Conference, 2009. MILCOM 2009. IEEE, 2009.
1321 D. Kim, J. Garcia-Luna-Aceves, K. Obraczka, J. Cano, and P. Manzoni. Power-Aware Routing Based on The Energy Drain Rate for Mobile Ad Hoc Networks. In Proceedings of the IEEE InternationalConference on Computer Communication, 2002.
[331 W. Kish, J. Chanak, and C. Gram. Systems and Methods for Improved Data Throughput in Communications Networks. US Patent 7,505,447, 2009.
1341 R. Koetter and M. Medard. Beyond routing: an algebraic approach to network coding. In INFOCOM 2002. Twenty-First Annual Joint Conference of the IEEE Computer and Communications Societies. Proceedings.IEEE, volume I , pages 122 - 130 vol. I,
2002.
1351 Sandeep Kulkarni and Limin Wang. MNP: Multihop Network Reprogramming Service for Sensor Networks. In ICDCS, 2005. 1361 Joy Kuri and Sneha Kumar Kasera. Reliable Multicast in Multi-Access Wireless LANs. Wireless Net., 7, September 2001.
1371 Mathieu Lacage, Mohammad Hossein Manshaei, and Thierry Turletti. IEEE 802.11 Rate Adaptation: A Practical Approach. 1381 S.J. Lee, W. Su, and M. Gerla. On-Demand Multicast Routing Protocol in Multihop Wireless Mobile Networks. Mobile Network Applcations, 2000.
1391 P. Levis, N. Patel, D. Culler, and S. Shenker. Trickle: A Self-Regulating Algorithm for Code Propagation and Maintenance in Wireless Sensor Networks. In NSDI 2004.
1401 S. Li, R. Yeung, and N. Cai. Linear Network Coding. IEEE Trans. on Info. Theory, 49(2), February 2006. 1411 S.-Y.R. Li, R.W. Yeung, and Ning Cai. Linear network coding. Information Theory, IEEE Transactionson, 49(2):371 -38 1, feb. 2003. 1421 Madhav V. Marathe, Heinz Breu, Harry B. Hunt III, S. S. Ravi, and Daniel J. Rosenkrantz. Simple Heuristics for Unit Disk Graphs. Networks, 25, 1995.
1431 Robert Morris, Eddie Kohler, John Jannotti, and M. Frans Kaashoek. The Click modular router. In SOSP '99. 115
1441 Robert T. Morris, John C. Bicket, and John C. Bicket. Bit-rate selection in wireless networks. Technical report, Masters thesis, MIT, 2005.
1451 Charles E. Perkins and Elizabeth M. Royer. Ad hoc On-Demand Distance Vector Routing. In WMCSA 1999. 1461 Stefan Pleisch, Mahesh Balakrishnan, Ken Birman, and Robbert van Renesse. MISTRAL: Efficient flooding in mobile ad-hoc networks. In MobiHoc '06. [471 Hari Rangarajan and J. J. Garcia-Luna-Aceves. Using labeled paths for loop-free on-demand routing in ad hoc networks. In MobiHoc '04. [481 S. Sen, Jie Xiong, R. Ghosh, and R.R. Choudhury. Link layer multicasting with smart antennas: No client left behind. In ICNP, 2008.
1491 Sayandeep Sen, Neel Kamal Madabhushi, and Suman Banerjee. Scalable WiFi Media Delivery Through Adaptive Broadcasts. In NSDI, 2010. 1501 P. Sinha, R. Sivakumar, and V. Bharghavan. MCEDAR: Multicast core extraction distributed ad-hoc routing. In WCNC, 1999. 1511 Prasun Sinha, Raghupathy Sivakumar, and Vaduvur Bharghavan. CEDAR: A CoreExtraction Distributed Ad Hoc Routing Algorithm. In INFOCOM, 1999. 1521 Kannan Srinivasan, Mayank Jain, Jung Il Choi, Tahir Azim, Edward S. Kim, Philip Levis, and Bhaskar Krishnamachari. The K factor: inferring protocol performance using inter-link reception correlation. In Proceedingsof the sixteenth annual international conference on Mobile computing and networking, MobiCom '10, pages 317-
328, New York, NY, USA, 2010. ACM. 1531 Jayashree Subramanian, Robert Morris, and Hari Balakrishnan. UFlood: HighThroughput Flooding over Wireless Mesh Networks. In IEEE INFOCOM, 2012.
1541 Yu-Chee Tseng, Sze-Yao Ni, Yuh-Shyan Chen, and Jang-Ping Sheu. The broadcast storm problem in a mobile ad hoc network. Journal of Wireless Networks, 8(2/3), 2002.
1551 Jeffrey E. Wieselthier, Gam D. Nguyen, and Anthony Ephremides. Energy-efficient broadcast and multicast trees in wireless networks. Mob. Netw. Appl., 7(6), 2002. 1561 Brad Williams and Tracy Camp. Comparison of broadcasting techniques for mobile ad hoc networks. In MobiHoc '02.
1571 Naixue Xiong, Laurence T. Yang, Yuanyuan Zeng, Ma Chao, and Jong Hyuk Park. Implementation of Rate Control in Distributed Wireless Multicast by Neural Network Prediction. IEEE Computer Society. 1581 Ting Zhu, Yu Zhong, Tian He, and Zhang. Correlation for Efficient Flooding in Wireless Sensor Networks. In NSDI, 2010. 116