Dura à Tenera Oil Palm (Elaeis guineensis Jacq.) Genotypes in Cameroon. Mondjeli Constantin1, 2, Sobir Ridwani2, Muhamad Syukur2, Willy Bayuardi ...
Journal of Agricultural Science and Technology A 7 (2017) 81-90 doi: 10.17265/2161-6256/2017.02.002
D
DAVID
PUBLISHING
Genetic Diversity and Interrelationship among Some Dura × Tenera Oil Palm (Elaeis guineensis Jacq.) Genotypes in Cameroon Mondjeli Constantin1, 2, Sobir Ridwani2, Muhamad Syukur2, Willy Bayuardi Suwarno2 and Ntsomboh-Ntsefong Godswill1 1. Institute of Agricultural Research for Development, Specialized Centre for Oil Palm Research (CEREPAH-IRAD), P.O. Box 243, Douala, Cameroon 2. Department of Agronomy and Horticulture, Bogor Agricultural University (IPB), Bogor 16680, Indonesia Abstract: In this study, the multivariate tools, namely principal component analysis (PCA) and cluster analysis, were used to classify and measure the pattern of genetic diversity and evaluate the correlation of nine oil palm traits in 25 progenies. Fresh fruit bunch weight (FFB), kernel to fruit (K/F) and kernel to bunch (K/B) ratios showed significant variance, while bunch number (BN), kernel yield (KY) and oil yield (OY) showed little variance. Positive significant correlation between these traits and yield was appreciated through PCA, where 90.55% of the variation was explained by the first three principal components. Progeny grouping was performed and revealed three clusters of oil palm progenies. Cluster I contained progenies with high production of FFB, BN, OY and KY, while low height increment (HI) of palm trees was found in cluster II. However, most of progenies with high mean values of bunch spikelet weight (SpW), average fruit weight (AFW), K/F and K/B were grouped in cluster III. This grouping could help oil palm breeders to identify progenies with the traits of interest for breeding and commercial seed production. Key words: Oil palm, Elaeis guineensis Jacq., cluster analysis, correlation, genetic diversity, principal component analysis.
1. Introduction Oil palm (Elaeis guineensis Jacq.) is a major crop that ranks first in the world market as a product of vegetable fats and oils. An estimated 74% of global palm oil usage is for food products and 24% is for industrial purposes [1]. A mastery of the genetic diversity and structure of oil palm is particularly important for the conservation of genetic resources, identification of oil palm populations, exploration of plant genetic resources and development of future breeding programs. Significant progress in crop improvement could be achieved by exploitation of relationships between characters in a genetically diverse population [2]. In the oil palm, analysis of yield components and their relative contributions Corresponding author: Sobir Ridwani, professor, research fields: plant breeding and biotechnology.
towards yield will give a better chance of selecting high yielding progeny [3, 4]. Several works have previously estimated the genetic variation of the different oil yield components of oil palm [5-7]. There is a high genetic variability among the oil palm progenies, indicating ample scope for further breeding and selection [8]. Principal component analysis (PCA) used in this study is a descriptive procedure for analyzing relationships that may exist in a set of quantitative variables. Genetic diversity could be estimated with such quantitative traits using multivariate analysis tools, like PCA and a tree diagram hierarchical clustering technology analysis [9]. These taxonomic relationships analysis tools were chosen as efficient approaches to perform genetic diversity of quantitative agronomical characters of the new oil palm progenies test population. The objective of this study was to
82
Genetic Diversity and Interrelationship among Some Dura × Tenera Oil Palm (Elaeis guineensis Jacq.) Genotypes in Cameroon
evaluate the magnitude of genetic diversity within the introgressed Dura × Tenera (D × T) oil palm progenies of the third selection cycle of the Specialized Centre for Oil Palm Research (CEREPAH) of Cameroon, using multivariate and clustering tools and to determine correlation among the studied important agronomic traits under Cameroonian climatic conditions.
2. Materials and Methods In this study, 25 Dura × Tenera progenies (Table 1) of the third selection cycle of oil palm breeding program were evaluated in the experimental field of CEREPAH, Cameroon (3°46′-4°01′ N latitude and 9°44′-10°04′ E longitude) from 2004 to 2014. A total of 2,730.49 mm of annual mean rainfall and 27.36 °C Table 1
of annual mean temperature were recorded during this study. The progeny test experiment was conducted in a randomized complete block design with three replications. The palms were laid down in a triangular planting system at 9 m apart with 12 palm plants per progeny. The oil palm field agronomic protocol steps were applied to achieve healthy plants. The collection of data was focused on nine oil palm agronomical traits, namely, fresh fruit bunch weight (FFB), bunch number (BN), spikelet weight (SpW), average fruit weight (AFW), kernel to fruit ratio (K/F), kernel to bunch ratio (K/B), oil yield (OY) and kernel yield (KY), following the method implemented by Mandal and Kochu [10]; while the vegetative trait, namely, palm height increment (HI) of trees, was determined in cm per year [11], following Eq. (1):
Dura × Tenera oil palm progenies from CEREPAH, Cameroon (2004-2014) used in this study. Origin of grandparent Tenera/Pisifera
Origin of grandparent Dura
LM2T × DA115D
Origin of Origin of Dura Tenera/Pisifera BRT10 Dabou
LM22478
LM5100D × LM11096T
DA2356
LM9838
DA115D × LM269D
LM2T × WI10T
LM21761
LM11087T × LM2749D
LM9175
DA787
LM5T × WI15T
DA10D × DA 3D
Progenies
Parents
LM21661
LM22099
LM11087T × LM7409D
LM9175
LM7899
LM5T × WI15T
LM3257D AF
LM22001
LM11088T × LM2531D
LM9175
DA507
LM5T × WI15T
DA115D AF
LM22527
LM11088T × LM2781D
LM9175
DA787
LM5T × WI15T
DA10D × DA3D
LM22534
LM11088T × LM7811D
LM9175
LM7899
LM5T × WI15T
LM3257D AF
LM21884
LM11089T × LM2749D
LM9175
DA787
LM5T × WI15T
DA10D × DA3D
LM21864
LM12963T × LM5100D
LM9175
DA2356
LM5T × WI15T
DA115 D × LM269D
LM22130
LM11091T × LM2749D
LM9287
DA787
LM5T × WI1T
DA10D × DA3D
LM21709
LM11091T × LM5100D
LM9287
DA2356
LM5T × WI1T
DA115 D × LM269D
LM21706
LM11097T × LM2531D
LM9927
DA507
LM5T × WI10T
DA115D AF
LM21787
LM11097T × LM5100D
LM9927
DA2356
LM5T × WI10T
DA115 D × LM269D
LM21839
LM11097T × LM7422D
LM9927
LM7899
LM5T × WI10T
LM3257D AF
LM21925
LM7422D × LM11091T
LM7899
LM9287
LM3257D × LM3257D LM5T × WI1T
LM21728
LM12960T × LM5100D
LM9287
DA2356
LM5T × WI1T
DA115D × LM269D
LM21790
LM12960T × LM7409D
LM9287
LM7899
LM5T × WI1T
LM3257D AF
LM21881
LM12961T × LM2509D
LM9287
DA507
LM5T × WI1T
DA115D AF
LM22575
LM12961T × LM2749D
LM9287
DA787
LM5T × WI1T
DA10D × DA3D
LM21852
LM12961T × LM5155D
LM9287
LM2911
LM5T × WI1T
LM269D × DA115D
LM21886
LM12965T × LM2509D
LM9927
DA507
LM5T × WI10T
DA115D AF
LM21867
LM12965T × LM2749D
LM9927
DA787
LM5T × WI10T
DA10D × DA3D
LM21874
LM12967T × LM2781D
LM9927
DA787
LM5T × WI10T
DA10D × DA3D
LM21836
LM12967T × LM2509D
LM9927
DA507
LM5T × WI10T
DA115D AF
Genetic Diversity and Interrelationship among Some Dura × Tenera Oil Palm (Elaeis guineensis Jacq.) Genotypes in Cameroon
HI (cm/year)
height at year t
(1)
t – 2
where, t is the age of the palm. The recorded data for statistical analysis of all parameters were mean values. Determination of the level of interrelationship between traits was done with Pearson’s correlation coefficients [12]. Cluster analysis was performed to determine genetic distance between progenies and cluster diagram was constructed following grower’s method to study the dissimilarities among progenies with the help of R program statistic tool version 3.0.3. Scatter plots were visualized based on the principal components (PCs) to illustrate the variability patterns in the studied oil palm progeny test population.
3. Results and Discussion An important prerequisite for breeding programs in crop improvement is the estimation of genetic variability. The co-association of economical traits can be evaluated on the basis of the presence of genetic variability among the traits. By this approach, very high variability was observed among the studied traits in the present study. The described basic features of statistical analysis showed a wide diversity of the nine studied traits in the 25 oil palm progenies of the test population. Traits, such as FFB (kg), K/F (%) and K/B (%) showed wide range of high variance values. On the other hand, OY (tons), AFW (g), BN, SpW (kg) and KY (tons) showed little Table 2
83
variant values (Table 2). Exploitation of variability for selection of these traits in the studied population could yield good response. Other studies found significant variability and diversity among Dura × Pisifera progeny populations [7, 8, 13]. Okwuagwu et al. [3] also reported significant variability and diversity in Dura × Tenera oil palm population for FFB trait. It has also been reported by Talebi et al. [14] that in quantitative study, agronomic features with high variance and significant variability can be used in breeding programs for genetic improvement of varieties. OY, AFW, BN, SpW and KY showed little variance in the present study. Little variance values were also reported by Malik et al. [15] in their genetic diversity analysis of morpho-genetic traits in Desi chickpea (Cicer arietinum). In this study, the correlation coefficients between the nine studied traits of 25 oil palm progenies (Table 3) were estimated. OY showed positive and high significant association with FFB (P < 0.001; r = 0.97), BN (P < 0.001; r = 0.85) and KY (P < 0.001; r = 0.55). The result showed that OY trait is thus an expression of multi-association trait components resulting from action of various other oil palm traits. There was also high strong positive association between KY and FFB (P < 0.001; r = 0.66), BN (P < 0.001; r = 0.71), KF (P < 0.001; r = 0.88) and KB (P < 0.001; r = 0.91). KY was also significantly correlated with AFW (P < 0.05; r = 0.49). Moreover,
Descriptive statistics for the nine studied quantitative traits in 25 oil palm progenies from CEREPAH, Cameroon.
Traits Height increment (cm) Fresh weight of fruit bunch (kg) Total bunches number Spikelet weight (kg) Average fruit weight (g) Kernel to fruit ratio (%) Kernel to bunch ratio (%) Kernel yield (tons) Oil yield (tons)
Range 21.4-35.8 90.3-140.3 8.1-14.6 7.5-12.4 6.8-9.4 43.5-85.5 27.6-56.1 4.99-9.7 4.04-7.4
σ2 = variance; σ = standard deviation; SE = standard error.
Mean ± SE 25.6 ± 0.4 112.4 ± 1.2 11.6 ± 0.2 9.8 ± 0.1 8.1 ± 0.1 61.4 ± 1.2 40.3 ± 0.8 6.5 ± 0.2 5.7 ± 0.1
σ2 14.1 134.3 2.7 1.3 0.6 145.6 70.7 3.0 0.4
σ 3.8 11.6 1.6 1.1 0.8 12.1 8.4 1.7 0.6
84
Table 3
Genetic Diversity and Interrelationship among Some Dura × Tenera Oil Palm (Elaeis guineensis Jacq.) Genotypes in Cameroon Correlation coefficients among nine quantitative traits of 25 oil palm progenies.
Variables
FFB
BN
SpW
AFW
KF
KB
KY
HI
0.26
0.17
0.11
0.24
0.22
0.22
0.28
FFB BN
0.91
a
-0.35 -0.65
-0.16 a
SpW
0.24
0.30
0.18
0.66
a
0.97a
0.71
a
0.85a
-0.05
0.37
-0.10
-0.31
-0.29
-0.37
-0.31
0.76a
0.71a
0.49b
-0.29
0.99a
0.88a
0.11
a
0.19
AFW KF KB
0.41
b
OY
0.91
0.55a
KY
HI: height increment; FFB: fresh fruit bunch weight; BN: bunch number; SpW: spikelet weight; AFW: average fruit weight; KF: kernel to fruit ratio; KB: kernel to bunch ratio; KY: kernel yield; OY: oil palm yield. a Significant at P < 0.001; b significant at P < 0.05. Table 4 Eigenvalue, proportion of variability and quantitative traits that contributed to the three principal components (PCs) in 25 oil palm progenies of Cameroon. Traits
PC1
PC2
PC3
Height increment (cm)
0.292
0.122
0.850
Fresh fruit bunch (kg)
0.771
-0.583
0.177
Total bunches number
0.807
-0.546
-0.098
Spikelet weight (kg)
-0.532
0.348
0.567
Average fruit weight (g)
0.339
0.847
-0.046
Kernel to fruit (%)
0.721
0.673
-0.097
Kernel to bunch (%)
0.752
0.624
-0.067
Kernel yield (tons)
0.946
0.266
0.020
Oil yield (tons)
0.679
-0.667
0.166
Eigenvalue
4.169
2.851
1.130
Cumulative eigenvalue
4.169
7.020
8.150
Variance (%)
46.321
31.676
12.554
Cumulative of variance (%)
46.321
77.997
90.551
KB showed strong positive association (P < 0.001) with AFW, KF and positive significant correlation (P < 0.05) with BN. KF and BN also showed positive significant association with AFW and FFB, respectively. These results could be exploited to improve yields by indirect selection for these traits. The characters that showed positive significant correlation can be exploited to achieve high yield Tenera hybrid of oil palm elites for seed production in Cameroon. PCA is a multivariate tool analysis, which helps to obtain at the same time component groups with more important traits. This approach was widely implemented by several other plant scientists for specific breeding [16-20]. In this study, PCA revealed
that the first three principal components (PC) with eigenvalue greater than 1, accounted for 90.55% variation within the 25 progenies (Table 4). The first principal component (PC1) related to the following progenies: LM21674, LM22130, LM21709, LM21925, LM21728, LM21790, LM21661, as determined with 46.32% of variation, while eight characters gave positive values apart from SpW, which produced negative value. KY, BN, FFB, KB, KF and OY per progeny were the main traits that respectively contributed more to the variation among the studied oil palm progenies. PC2 explained 31.68% of all the accumulated variation, in which AFW, KF and KB were the main contributing traits in this component.
85
Genetic Diversity and Interrelationship among Some Dura × Tenera Oil Palm (Elaeis guineensis Jacq.) Genotypes in Cameroon
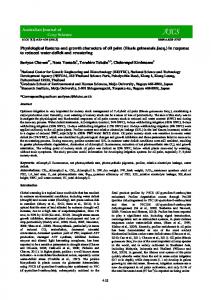
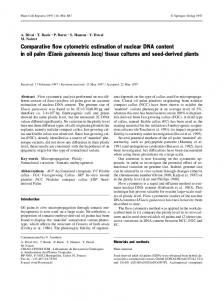
were observed between Dura × Tenera progenies and can be visualized on the scatter plot (Fig. 1). An important genetic diversity was revealed by the high
PC2 (31.68%)
HI and SpW were the major traits in PC3. Based on the first two principal components of the biplot graph, the studied individual genetic differences
PC1 (46.32%) Fig. 1 Scatter plot of first two principal components contributing 78% of the total variation for nine quantitative traits in 25 oil palm progenies of Cameroon.
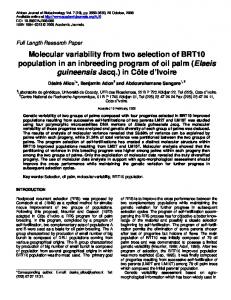
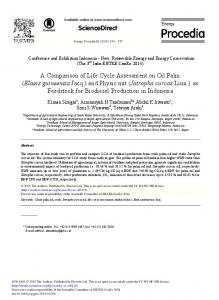
Cluster I (7 progenies)
Fig. 2
Cluster II (16 progenies)
Cluster III (2 progenies)
Dendrogram depicting genetic relationships of 25 oil palm progenies based on nine studied characters.
86
Genetic Diversity and Interrelationship among Some Dura × Tenera Oil Palm (Elaeis guineensis Jacq.) Genotypes in Cameroon
Table 5 Means and standard errors of the nine studied oil palm variables in the three clusters with the related number of progenies.
Height increment (cm)
Cluster I (7 progenies) 26.43 ± 1.36
Cluster II (16 progenies) 25.41 ± 2.40
Cluster III (2 progenies) 25.59 ± 2.37
Fresh weight of fruit bunch (kg)
123.70 ± 4.05
108.31 ± 5.23
94.45 ± 5.24
Total bunches number
13.37 ± 0.46
10.79 ± 0.48
8.94 ± 0.14
Spikelet weight (kg)
8.81 ± 0.48
10.24 ± 0.67
11.18 ± 0.74
Average fruit weight (g)
8.56 ± 0.31
7.75 ± 0.25
9.23 ± 0.25
Characters
Kernel to fruit (%)
74.35 ± 4.54
54.08 ± 3.75
78.66 ± 4.88
Kernel to bunch (%)
49.44 ± 4.03
35.26 ± 2.52
51.59 ± 3.98
Kernel yield (tons)
8.74 ± 0.79
5.45 ± 0.44
6.90 ± 0.41
Oil yield (tons)
6.20 ± 0.36
5.50 ± 0.32
4.64 ± 0.19
progeny dissemination in all the four compartments of the biplot graphic display. The progenies closest to each other in this biplot graph presented less or no differences in the expression of the phenotypic specific studied traits (Fig. 1). However, progenies occurring far from the origin illustrated more variability in the expression of traits. Thus, the parent crosses of these progenies can be effectively used for the hybrid breeding program, with the evidence to also improve the oil palm germplasm genetic potential. Cluster analysis used in this study further helped to group or show dissimilarity relationships among progenies depending on morpho-genetic traits. Cluster diagram based on Euclidean dissimilarity constructed by gower’s method, grouped the 25 oil palm progenies into three clusters at 0.35 dissimilarity value level (Fig. 2). Table 5 shows the range, means and standard errors of the nine studied oil palm variables in the three clusters of the 25 oil palm progenies. The similarity matrix is presented in Table 6. Cluster I contained seven progenies, which were characterized by high production of FFB and BN per progeny, OY and KY per hectare. Cluster II comprised of 16 progenies, classified by low HI per year, moderate production of FFB and BN, progeny with moderate SpW, AFW, KF and KB, medium OY and KY per hectare. Cluster III contained two progenies, which were characterized by moderate HI and KY, low OY, FFB and BN, high
mean values for SpW, AFW, KF and KB. Such hierarchical grouping of individuals is useful to oil palm breeders for the selection of progenies with traits of interest needed in the production of superior hybrid commercial varieties. Oil palm crosses can be selected from the displayed clusters. Cluster analysis, which supported the results of correlation analysis, both indicated that OY per hectare, FFB, BN, KY, KF and KB may be improved simultaneously and put together in a single progeny for yield improvement. This was obvious from the fact that these components are positively associated with yield and with themselves. Furthermore, progenies with high mean values for these characters and those with high OY and KY were grouped in same cluster. Camillo et al. [21] reported evidence of correlation between oil palm seed trait components in their oil palm clustering study of Brazilian germplasm bank.
4. Conclusions Through the characterization of the oil palm population of introgressed progenies in this study, some interesting crosses with specific traits were identified. The studied oil palm population was found to exhibit wide genetic diversity for most of the expressed oil palm characters. To improve overall yield, the following traits must be considered: FFB, BN, KF, KB and KY. There was a positive significant correlation between these traits and yield as confirmed
Table 6 Progeny LM 21674 LM 21661 LM 22478 LM 21761 LM 22099
Similarity matrix of oil palm progenies studied. LM2 LM21 LM22 LM21 LM220 LM22 LM22 LM22 LM21 LM21 LM22 LM21 LM21 LM21 LM21 LM21 LM21 LM21 LM21 LM22 LM21 LM21 LM21 LM21 LM21 1674 661 478 761 99 001 527 534 884 864 130 709 706 787 839 925 728 790 881 575 852 886 867 874 836 NA 0.838 775 0.533 177 0.671 326 0.541 579
NA
NA
NA
NA
NA
NA
NA
NA
NA
NA
NA
NA
NA
NA
NA
NA
NA
NA
NA
NA
NA
NA
NA
NA
NA
NA
NA
NA
NA
NA
NA
NA
NA
NA
NA
NA
NA
NA
NA
NA
NA
NA
NA
NA
NA
NA
NA
NA
NA
NA
NA
NA
NA
NA
NA
NA
NA
NA
NA
NA
NA
NA
NA
NA
NA
NA
NA
NA
NA
NA
NA
NA
NA
NA
NA
NA
NA
NA
NA
NA
NA
NA
NA
NA
NA
NA
NA
NA
NA
NA
NA
NA
NA
0.855 119
NA
NA
NA
NA
NA
NA
NA
NA
NA
NA
NA
NA
NA
NA
NA
NA
NA
NA
NA
NA
NA
NA
NA
NA
NA
NA
NA
NA
NA
NA
NA
NA
NA
NA
NA
NA
NA
NA
NA
NA
NA
NA
NA
NA
NA
NA
NA
NA
NA
NA
NA
NA
NA
NA
NA
NA
NA
NA
NA
NA
NA
NA
NA
NA
NA
NA
NA
NA
NA
NA
NA
NA
NA
NA
NA
NA
NA
NA
NA
NA
NA
NA
NA
NA
NA
NA
NA
NA
NA
NA
NA
NA
NA
NA
NA
0.625 707 0.759 727 0.632 801
0.755 680 0.784 315
LM 22001 LM 22527 LM 22534 LM 21884 LM 21864 LM 22130
0.470 729 0.609 025 0.618 060 0.492 078 0.565 524 0.674 791
0.614 730 0.746 494 0.720 045 0.576 768 0.656 746 0.826 631
0.680 459 0.788 746 0.800 463 0.765 647 0.816 022 0.756 582
0.797 789 0.870 539 0.910 667 0.788 004 0.856 205 0.801 267
0.877 728 0.868 255 0.856 215 0.844 636 0.926 145 0.733 263
0.849 662 0.830 130 0.857 618 0.849 763 0.727 060
0.888 057 0.794 461 0.845 702 0.827 606
LM 21709 LM 21706 LM 21787 LM 21839 LM 21925 LM 21728
0.699 884 0.467 559 0.382 279 0.541 052 0.769 707 0.623 660
0.838 315 0.587 758 0.481 340 0.640 114 0.844 611 0.700 744
0.640 815 0.747 353 0.706 685 0.798 823 0.613 760 0.607 319
0.671 791 0.709 998 0.644 242 0.767 089 0.649 476 0.493 672
0.605 583 0.792 098 0.726 601 0.860 060 0.543 020 0.411 0029
0.599 380 0.779 164 0.693 837 0.803 306 0.513 048 0.395 507
LM 21790
0.685 0.787 386 391
0.533 577
0.607 144
0.5260 0.536 757 710
0.856 723 0.861 292 0.768 661
0.878 901 0.652 908
NA
NA
NA
NA
NA
NA
NA
NA
NA
NA
NA
NA
NA
NA
NA
NA
0.755 769
NA
NA
NA
NA
NA
NA
NA
NA
NA
NA
NA
NA
NA
NA
NA
0.709 543 0.731 913 0.635 881 0.767 143 0.657 892 0.540 351
0.648 802 0.730 708 0.646 043 0.765 341 0.638 415 0.504 151
0.534 845 0.756 919 0.720 312 0.795 403 0.503 259 0.399 359
0.629 528 0.826 826 0.784 751 0.894 717 0.567 145 0.434 975
0.864 562 0.742 956 0.636 538 0.760 245 0.779 684 0.656 214
NA
NA
NA
NA
NA
NA
NA
NA
NA
NA
NA
NA
NA
NA
NA
NA
NA
NA
NA
NA
NA
NA
NA
NA
NA
NA
NA
NA
NA
NA
NA
NA
NA
NA
NA
NA
NA
NA
NA
NA
NA
NA
NA
NA
NA
NA
NA
NA
NA
NA
NA
NA
NA
NA
NA
NA
NA
NA
NA
NA
0.835 806
NA
NA
NA
NA
NA
NA
NA
NA
NA
0.597 773
0.566 352
0.423 075
0.525 937
0.770 167
0.878 973
0.775 675
NA
NA
NA
NA
NA
NA
NA
NA
0.653 326 0.535 105 0.632 565 0.873 488 0.788 978 0.847 252
0.870 121 0.868 302 0.577 800 0.458 772
0.809 353 0.471 381 0.340 551
0.552 235
0.434 159
0.570 182 0.438 011 0.572 779
(Table 6 continued) Progeny
LM2 LM21 LM22 LM21 LM220 LM22 LM22 LM22 LM21 LM21 LM22 LM21 LM21 LM21 LM21 LM21 LM21 LM21 LM21 LM22 LM21 LM21 LM21 LM21 LM21 1674 661 478 761 99 001 527 534 884 864 130 709 706 787 839 925 728 790 881 575 852 886 867 874 836
LM 21881 LM 22575 LM 21852 LM 21886 LM 21867
0.502 859 0.592 027 0.630 575 0.664 278 0.557 185
0.592 096 0.691 089 0.723 105 0.756 809 0.701 186
0.587 421 0.813 080 0.817 589 0.795 974 0.670 506
0.532 551 0.849 582 0.757 161 0.747 188 0.843 052
0.5770 359 0.897 046 0.780 418 0.785 118 0.770 531
0.525 950 0.849 301 0.676 563 0.715 595 0.846 204
0.551 022 0.848 678 0.785 126 0.784 182 0.838 667
0.541 147 0.839 077 0.780 925 0.784 989 0.844 881
0.557 089 0.803 673 0.732 519 0.788 982 0.807 844
0.629 403 0.906 534 0.821 011 0.829 718 0.786 827
0.658 511 0.812 035 0.820 416 0.820 715 0.782 207
0.730 702 0.684 354 0.701 145 0.730 193 0.672 007
0.746 786 0.845 366 0.728 961 0.754 028 0.674 733
0.702 238 0.760 496 0.702 878 0.689 567 0.601 028
0.680 962 0.912 171 0.836 164 0.848 340 0.681 545
0.686 478 0.621 972 0.664 400 0.698 607 0.599 504
0.638 313 0.489 801 0.532 229 0.585 310 0.478 986
0.643 984 0.619 402 0.590 584 0.618 423 0.584 943
NA
NA
NA
NA
NA
NA
NA
0.633 249 0.651 808 0.720 551 0.450 903
NA
NA
NA
NA
NA
NA
0.810 560 0.842 174 0.768 558
NA
NA
NA
NA
NA
0.864 222 0.670 315
NA
NA
NA
NA
0.660 341
NA
NA
NA
LM 21874 LM 21836
0.566 718 0.509 751
0.659 248 0.590 484
0.859 622 0.640 736
0.788 549 0.537 693
0.865 185 0.599 342
0.781 597 0.525 893
0.827 852 0.566 527
0.837 177 0.556 652
0.848 727 0.586 714
0.918 520 0.658 225
0.747 570 0.658 454
0.629 507 0.711 687
0.829 497 0.746 729
0.797 416 0.751 335
0.905 279 0.719 702
0.597 921 0.649 845
0.470 316 0.543 946
0.517 737 0.572 888
0.656 517 0.851 667
0.893 805 0.637 855
0.865 136 0.775 364
0.866 791 0.760 459
0.716 689 0.450 846
NA
NA
0.718 419
NA
NA: non available.
Genetic Diversity and Interrelationship among Some Dura × Tenera Oil Palm (Elaeis guineensis Jacq.) Genotypes in Cameroon
by the used PCA multivariate analysis tool. Obtained clusters of studied progenies could be exploited by oil palm breeders for identification and selection of interesting progeny crosses needed to boost and improve the oil palm breeding program and genetic resource materials, in terms to develop superior hybrid Tenera varieties with the introgessed traits of interest that will be distributed to oil palm farmers.
Acknowledgments The authors greatly acknowledge PT Astra Agro Lestari Tbk, Indonesia and Institute of Agricultural Research for Development (IRAD)-CEREPAH, Cameroon for providing financial and technical support for this research. Bogor Agricultural University (IPB) of Indonesia is acknowledged for the supervision of this study.
References [1]
[2]
[3]
[4]
[5]
[6]
[7]
Food and Agriculture Organization of the United Nations (FAO). 2012. “FAOSTAT.” FAO, Rome. Accessed March 10, 2015. http://faostat.fao.org. Bello, D., Sajo, A. A., Chubado, D., and Jellason, J. J. 2006. “Variability and Correlation Studies in Okra (Abelmoschus esculentus (L.) Moench).” J. Sustain. Dev. Agric. Environ. 2 (1): 120‐6. Okwuagwu, C. O., Okoye, M. N., Okolo, E. C., Ataga, C. D., and Uguru, M. I. 2008. “Genetic Variability of Fresh Fruit Bunch Yield in Deli/Dura × Tenera Breeding Populations of Oil Palm (Elaeis guineensis Jacq.) in Nigeria.” J. Tropical Agri. 46 (1-2): 52-7. Okoye, M. N., Okwuagwu, C. O., and Uguru, M. I. 2009. “Population Improvement for Fresh Fruit Bunch Yield and Yield Components in Oil Palm (Elaeis guineensis Jacq.).” American-Eurasian J. Sci. Res. 4 (2): 59-63. Okwuagwu, C. O., and Tai, G. C. C. 1995. “Estimate of Variance Components and Heritability of Bunch Yield and Yield Components in the Oil Palm (Elaeis guineensis Jacq.).” Plant Breeding 114 (5): 463-5. Rafii, M. Y., Rajanaidu, N., Jalani, B. S., and Kushairi, A. 2002. “Performance and Heritability Estimations on Oil Palm Progenies Tested in Different Environments.” J. Oil Palm Res. 14 (1): 15-24. Musa, B. B., Saleh, G. B., and Loong, S. G. 2004. “Genetic Variability and Broad-Sense Heritability in Two
[8]
[9]
[10]
[11]
[12]
[13]
[14]
[15]
[16]
[17]
[18]
[19]
89
Deli-Avros D × P Breeding Populations of the Oil Palm (Elaeis guineensis Jacq.).” SABRAO J. Breed. Genet. 36 (1): 13-22. Noh, A., Rafi, M. Y., Mohd Din, A., Kushairi, A., Norziha, A., Rajanaidu, N., Latif, M. A., and Malek, M. A. 2014. “Variability and Performance Evaluation of Introgressed Nigerian Dura × Deli Dura Oil Palm Progenies.” Genet. Mol. Res. 13 (2): 2426-37. Ghafoor, A., Sharif, A., Ahmad, Z., Zahid, M. A., and Rabbani, M. A. 2001. “Genetic Diversity in Blackgram (Vigna mungo (L.) Hepper).” Field Crops Res. 69 (2): 183‐90. Mandal, P. K., and Kochu, B. M. 2008. “Bunch Analysis of Oil Palm.” Technical Bulletin No. 8, National Research Centre for Oil Palm, Malaysia. Breure, C. J., and Powell, M. S. 1987. “The One-Shot Method of Establishing Growth Parameters in Oil Palm.” In Proceedings of the Palm Oil Research Institute of Malaysia (PORIM) International Oil Palm Conference, 203-9. Singh, R. K., and Chaudhary, B. D. 1979. Biometrical Methods in Quantitative Genetic Analysis. New Delhi, India: Kelyani Publisher, 303. Kushairi, A., Rajanaidu, N., Jalani, B. S., and Zakri, A. H. 1999. “Agronomic Performance and Genetic Variability of Dura × Pisifera Progenies.” J. Oil Palm Res. 11 (2): 1-24. Talebi, R., Fayaz, F., Mardi, M., Pirsyedi, S. M., and Naji, A. M. 2008. “Genetic Relationships among Chickpea (Cicer arietinum) Elite Lines Based on RAPD and Agronomic Markers.” Int. J. Agric. Biol. 10: 301‐5. Malik, S. R., Shabbir, G., Zubir, M., Iqbal, S. M., and Ali, A. 2014. “Genetic Diversity Analysis of Morphogenetic Traits in Desi Chickpea (Cicer arietinum).” Int. J. Agri. Biol. 16 (5): 956-60. Hamayoon, R., Khan, H., Shah, S., Naz, L., Munir, I., Arif, M., Khalil, I. A., and Khan, A. Z. 2011. “Performance of Chickpea Genotypes under Two Different Environmental Conditions.” African J. Biotech. 10 (9): 1534‐44. Shiv, S., Iquebal, M. A., Singh, N. P., Solanki, R. K., and Sarika. 2012. “Genetic Diversity Studies in Chickpea (Cicer arietinum L.) Germplasm.” J. Food Legumes 25 (1): 31‐6. Ekezie, D. D. 2013. “Principal Component Analysis, an Aid to Interpretation of Data: A Case Study of Oil Palm (Elaeis guineensis Jacq.).” J. Emerg. Trends Eng. Appl. Sci. 4 (2): 237-41. Montoya, C., Cochard, B., Flori, A., Cros, D., Lopes, R., Cuellar, T., Espeout, S., Syaputra, I., Villeneuve, P., Pina, M., Ritter, E., Leroy, T., and Billotte, N. 2014. “Genetic Architecture of Palm Oil Fatty Acid Composition in
90
Genetic Diversity and Interrelationship among Some Dura × Tenera Oil Palm (Elaeis guineensis Jacq.) Genotypes in Cameroon
Cultivated Oil Palm (Elaeis guineensis Jacq.) Compared to Its Wild Relative E. oleifera (H.B.K.) Cortés.” PLoS One 9 (5): e95412. [20] Zhou, L. X., Xiao, Y., Xia, W., and Yang, Y. D. 2015. “Analysis of Genetic Diversity and Population Structure of Oil Palm (Elaeis guineensis) from China and Malaysia Based on Species-Specific Simple Sequence Repeat
Markers.” Genet. Mol. Res. 14 (4): 16247-54. [21] Camillo, J., Braga, V. C., De Abreu Mattos, J. K., Lopes, R., Vieira da Cunha, R. N., Padilha, J., and Scherwinski-Pereira, J. E. 2014. “Seed Biometric Parameters in Oil Palm Accessions from a Brazilian Germplasm Bank.” Pesquisa Agropecuária Brasileira 49 (8): 604-12.