Oct 10, 2003 - D. Burgard. Nanogate GmbH, Gewerbepark Eschberger Weg, 661 21 Saarbrücken, Germany. Received 12 March 2003; revised manuscript ...
PHYSICAL REVIEW B 68, 155410 共2003兲
Electrical and optical properties of thin films consisting of tin-doped indium oxide nanoparticles J. Ederth
Department of Engineering Sciences, The A˚ngstro¨m Laboratory, Uppsala University, P.O. Box 534, SE-751 21 Uppsala, Sweden
P. Johnsson Department of Condensed Matter Physics, Royal Institute of Technology, S-164 40, Stockholm-Kista, Sweden
G. A. Niklasson, A. Hoel, A. Hulta˚ker,* P. Heszler,† and C. G. Granqvist
Department of Engineering Sciences, The A˚ngstro¨m Laboratory, Uppsala University, P.O. Box 534, SE-751 21 Uppsala, Sweden
A. R. van Doorn and M. J. Jongerius Philips CFT, P.O. Box 218/SAQ, 5600 MD Eindhoven, The Netherlands
D. Burgard Nanogate GmbH, Gewerbepark Eschberger Weg, 661 21 Saarbru¨cken, Germany 共Received 12 March 2003; revised manuscript received 4 August 2003; published 10 October 2003兲 Electrical transport and optical properties were investigated in porous thin films consisting of In2 O3 :Sn 共indium tin oxide, ITO兲 nanoparticles with an initial crystallite size of ⬃16 nm and a narrow size distribution. Temperature dependent resistivity was measured in the 77⬍t⬍300 K temperature interval for samples annealed at a temperature in the 573⭐t A⭐1073 K range. Samples annealed at 573⭐t A⭐923 K exhibited a semiconducting behavior with a negative temperature coefficient of the resistivity 共TCR兲. These data were successfully fitted to a fluctuation induced tunneling model, indicating that the samples comprised large conducting clusters of nanoparticles separated by insulating barriers. Samples annealed at t A⫽1073 K displayed a metallic behavior with no signs of insulating barriers; then the TCR was positive at t⬎130 K and negative at t⬍130 K. Effects of annealing on the ITO nanoparticles were investigated by analyzing the spectral optical reflectance and transmittance using effective medium theory and accounting for ionized impurity scattering. Annealing was found to increase both charge carrier concentration and mobility. The ITO nanoparticles were found to have a resistivity as low as 2⫻10⫺4 ⍀ cm, which is comparable to the resistivity of dense high quality In2 O3 :Sn films. Particulate samples with a luminous transmittance exceeding 90% and a resistivity of ⬃10⫺2 ⍀ cm were obtained. DOI: 10.1103/PhysRevB.68.155410
PACS number共s兲: 78.40.Pg, 78.40.Fy, 78.67.Bf, 71.55.Ht
I. INTRODUCTION
Materials exhibiting a high visible transparency and good electrical conductance are interesting for several important applications, and can be used as transparent electrodes for display devices, as well as in solar cells.1 Transparent conducting oxides attract particular interest, with In2 O3 :Sn 共known as indium tin oxide, ITO兲 being the most widely studied alternative. Many investigations have been performed on electrical and optical properties of ITO produced with different methods, such as physical vapor deposition2– 4 and spray pyrolysis.5 High quality ITO films have a resistivity as low as ⬃10⫺4 ⍀ cm in combination with a high visible transmittance.6 The optical band gap lies between 3.75 and 4.55 eV depending on the amount of Sn doping and the accompanying charge carrier concentration.7 ITO films, to be used as front-surface electrodes in display devices, are normally produced by a process involving several steps, such as film deposition followed by etching to obtain the desired patterned structure. Patterning is time consuming and hence costly, and it would be a significant improvement if the etching could be eliminated and replaced by a direct printing process wherein ITO nanoparticles are dispersed in a liquid and applied directly onto the substrate. A 0163-1829/2003/68共15兲/155410共10兲/$20.00
subsequent heat treatment of the film would then give a high visible transmittance and a low resistivity. Thus far only a few results have been published concerning electrical transport properties of such nanoparticle/nanocrystalline ITO films.8 –11 In this paper we report on temperature dependent electrical transport and optical properties of porous thin films consisting of ITO nanoparticles produced by a wet-chemical method. The films were spin coated from a dispersion of ITO nanoparticles with a narrow size distribution. In a practical application, the dispersion would be printed directly onto the substrate to produce fine-patterned structures. However, in this work large area depositions were preferred in order to enable analyses of the optical and electrical properties of the nanoparticle films. Sections II and III below describe the sample preparation and sample characterization, respectively. Theoretical considerations concerning electrical transport and optical properties are then presented in Sec. IV, and experimental results are given in Sec. V. Specifically we show that the dc electrical transport properties are dominated by thermally activated voltage fluctuations across insulating barriers between large metallic clusters of individual nanoparticles in the sample, giving a negative temperature coefficient of the resistivity.12
68 155410-1
©2003 The American Physical Society
PHYSICAL REVIEW B 68, 155410 共2003兲
J. EDERTH et al. TABLE I. Sample data showing annealing temperature t A for treatment at 1 h in air and 1 h in N2 , lattice parameter a, and mean grain size d. Sample
tA (°C)
a 共nm兲
d 共nm兲
A B C D E
300 400 500 650 800
1.0150 1.0144 1.0156 1.0150 1.0147
16 16 16 19 34
The results from the optical spectroscopy measurements were fitted to the Bruggeman effective medium model,13 including the effect of ionized impurity scattering, i.e., electrons scattered by dopant Sn4⫹ ions introduced in the material. Fitting theoretical data to experimental results made it possible to determine the charge carrier concentration and mobility in the ITO nanoparticles after annealing to different temperatures. We analyzed annealing-dependent changes of the volume fraction of ITO in the film, related to the density of the samples, and obtained valuable data on the efficiency of the sintering. Finally Secs. VI and VII present a discussion and conclusions of the results in this work. II. SAMPLE PREPARATION
ITO nanoparticles with a tin to indium atomic ratio of 5% were produced by a commercial wet-chemical method 共Nanogate GmbH兲. The primary particle diameter size was ⬃16nm as measured by a laser back scattering method using a LECOTRAC LTU-150 Ultrafine Particle Size Analyzer. Thin films were produced by spin coating a dispersion of the ITO nanoparticles onto glass substrates. The film thickness, measured by a Dektak 3030 mechanical stylus profilometer, was found to be ⬃1.1 m. Rutherford backscattering 共RBS兲 measurements combined with thickness measurements indicated a highly porous structure, i.e., a low density, with a filling factor of ITO nanoparticles in the range 30– 40 vol %. Scanning electron microscopy investigations of these samples supported the notion of a highly porous film structure.14 Post-deposition annealing was carried out in the temperature interval 573⭐t A ⭐1073 K. The heating rate was 10 K/min. At each temperature, annealing was performed initially for 1 h in air followed by annealing for 1 h in a N2 atmosphere. Table I presents the samples and their corresponding t As.
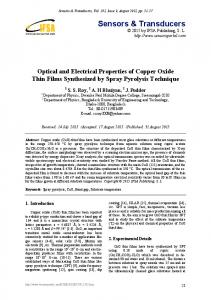
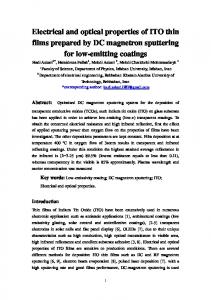
FIG. 1. X-ray diffractogram of ITO 共sample A兲. The peak intensities are labeled according to the major peaks of In2 O3 .
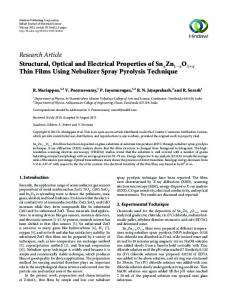
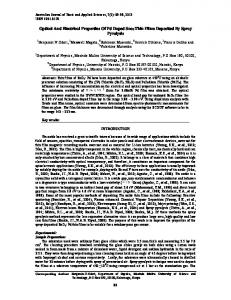
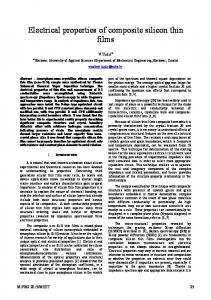
peak, put on top of each sample, and a was obtained from the 共222兲 peak corresponding to In2 O3 . Data on a are given in Table I for all samples. It is found that the lattice parameter remains constant for annealing to 1073 K with a value slightly larger to that of pure In2 O3 , i.e., a⫽1.0118 nm. The enhancement of the lattice parameter may be due to the tin doping causing a distortion of the In2 O3 lattice. Scherrer’s method15 was employed to estimate grain size d. The 共222兲 peak in the diffractogram was used, and data are given in Table I. It is well known that effects of lattice strains may give additional peak broadening, thus resulting in an erroneous grain size. Figure 2 presents scanning electron micrographs of three samples annealed at the shown annealing temperatures, thus providing independent information on the grain size. Data from the two analysis methods were in satisfactory agreement, with the difference in the mean grain size lying below 5%. The grain size was found to be constant up to t A⫽773 K. Annealing at 923 K resulted in a grain growth to 19 nm, and the final annealing at 1073 K produced a significant increase of d to 34 nm. Figure 3 shows ITO nanoparticle size distributions of the five different samples. The distributions were determined by measuring the diameter of more than 200 individual nanoparticles shown on scanning electron micrographs. It is observed that the size distributions are very similar and narrow for samples A–C; see Figs. 3共a兲–3共c兲. Annealing at high temperature gives an increased mean particle size and the size-distribution becomes wider; see Figs. 3共d兲 and 3共e兲. IV. THEORETICAL CONSIDERATIONS
III. SAMPLE CHARACTERIZATION
A. Electrical transport
All samples were characterized using x-ray diffractometry 共Siemens D5000 diffractometer兲 employing CuK ␣ radiation with a wavelength of 0.15405 nm. Figure 1 presents a diffractogram of sample A. The peaks were consistent with In2 O3 共Powder Diffraction File 06-0416兲 and no peaks pertinent to other crystalline structures were observed. Determinations of lattice parameter a were carried out using Si powder as a reference with a well defined 共111兲
Temperature dependent electrical transport in semiconductor materials is a complex property, whose reconciliation with theory demands a detailed knowledge of the local electronic structure. A theoretical modeling is also made difficult by the fact that there are several different transport mechanisms exhibiting a negative temperature coefficient of the resistivity 共TCR兲; among these one finds tunneling and hopping conduction.
155410-2
PHYSICAL REVIEW B 68, 155410 共2003兲
ELECTRICAL AND OPTICAL PROPERTIES OF THIN . . .
FIG. 2. Scanning electron micrographs for samples A, C, and E characterized in Table I.
Below we consider electrical transport mechanisms yielding a negative TCR, starting with hopping mechanisms and following with a transport mechanism dominated by the capacitive charging energy in a system consisting of a distribution of individually isolated small metal particles. Temperature dependent resistivity in a system consisting of large conducting clusters of individual nanoparticles, separated by thin insulating layers, is also considered. This section ends with the effect of ionized impurity scattering on the temperature dependent resistivity. Hopping conduction can be represented by an exponential temperature dependent resistivity (t) of the form16
冋冉 冊 册
B2 共 t 兲 ⫽B 1 exp t
e2 2C
,
共 t 兲 ⫽B 3 exp
冉 冊
t1 , t⫹t 0
共3兲
where B 3 is a constant and t 0 and t 1 are related to the properties of the insulating barriers between the metallic clusters and obtained from17 t 0⫽
16 0 បAV 3/2 0
共 2m 兲 1/2w 2 e 2 k B
共4兲
and
1/q
,
共1兲
where B 1 , B 2 , and q are constants. A conduction mechanism dominated by hopping between localized states distributed randomly in the film 共i.e., variable range hopping, VRH兲 yields a temperature dependence as described by Eq. 共1兲 with q⫽4.16 Another hopping conduction mechanism, characterized by q⫽1, is representative of localized states distributed in a periodic array 共i.e., nearest neighbor hopping, NNH兲.16 The granular-metal system is characterized by a distribution of small metallic grains separated by thin insulating layers. In such systems, the resistivity is governed by a charging energy E c , which is inversely proportional to a capacitance C, i.e., E c⫽
dominated by fluctuation induced tunneling between the metallic regions, and (t) is given by12
共2兲
where is a constant and e is the electronic charge. A small particle size gives a small capacitance, which results in a large E c . Then (t) is dominated by electrons hopping between the metal grains. The corresponding granular-metal model 共GM兲 is given by Eq. 共1兲 with q⫽2.16 A different temperature dependent resistivity appears if the metallic regions can be regarded as large internally connected clusters separated by thin insulating layers. This yields a much higher total capacitance, which results in E c being negligible compared to the thermal energy k B t, where k B is Boltzmann’s constant. In such samples the resistivity is
t 1⫽
8 0 AV 20 e 2k Bw
.
共5兲
Here A is the barrier area, V 0 is the barrier height, m is the charge carrier mass, w is the width of the barrier, 0 is the permittivity for free space, and ប is Planck’s constant divided by 2. Ionized impurities are an important source of scattering in doped semiconductors. If this scattering dominates, the TCR is negative and the temperature dependent drift mobility is given by18
共 t 兲 ⬀t 3/2.
共6兲
In a heavily doped degenerate semiconductor, the temperature dependent charge carrier concentration due to intrinsic carriers is negligible because of the high doping level. Thus the temperature dependence of (T) is given by (T), so that
共 t 兲 ⬀t ⫺3/2.
共7兲
B. Optical properties
Low density nanoparticle films can, from a theoretical point of view, not be treated as homogeneous samples. In a recent paper19 we successfully applied an effective medium theory by Bruggeman 共Br兲 to fit spectral reflectance and transmittance data of porous ITO nanoparticle films. Information on charge carrier concentration n e , mobility , and filling factor f of the ITO nanoparticles—i.e., the volume
155410-3
PHYSICAL REVIEW B 68, 155410 共2003兲
J. EDERTH et al.
FIG. 3. 共a兲–共e兲 Size distributions for the five samples specified in Table I.
fraction of ITO in the sample—were obtained from the fitting parameters. The same approach is used here to analyze changes in these parameters upon annealing. Our samples are modeled as consisting of spherical ITO nanoparticles connected in a percolating network surrounded by air. The Bruggeman model for spherical particles reads13 f
¯ Br a⫺ ¯ Br p ⫺ ⫽0, Br ⫹ 共 1⫺ f 兲 p ⫹2 ¯ a⫹2 ¯ Br
For heavily doped indium oxide, as in the case of our ITO nanoparticles, n e easily exceeds the Mott critical density 关 ⬃4⫻1018 cm⫺3 for ITO 共Ref. 20兲兴 so that the Fermi energy level is located above the minimum of the conduction band. This gives free electrons in the conduction band of the ITO nanoparticles, and we may represent their dielectric function by the Drude model. The Drude model is given by
共8兲
where p is the dielectric function for the ITO nanoparticles, a is the dielectric function for air, and ¯ Br is the effective medium dielectric function. 155410-4
p ⫽ ⬁ ⫺
冉
2p
1 ⫹i 0
冊
,
共9兲
PHYSICAL REVIEW B 68, 155410 共2003兲
ELECTRICAL AND OPTICAL PROPERTIES OF THIN . . .
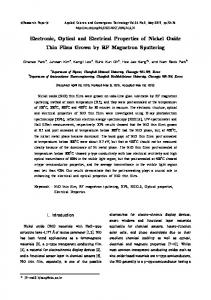
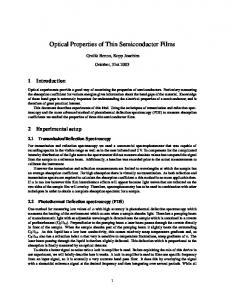
FIG. 4. Room temperature resistivity as a function of annealing temperature for the samples characterized in Table I. Dots indicate data and lines were drawn for convenience.
with p and 0 according to n ee 2 , m e 0
共10兲
me . pn ee 2
共11兲
2p ⫽
0⫽
Here ⬁ is the optical dielectric constant, p the plasma frequency, 0 the relaxation time, m e the effective electron mass, and p the resistivity of the ITO nanoparticles. Earlier work by Hamberg and Granqvist21 supported the use of Drude theory to model the dielectric function of ITO provided that an energy dependent relaxation time is used in the energy range between the band gap and the screened plasma frequency. In heavily doped ITO, this relaxation time is due to electrons scattered by ionized dopant atoms, i.e., ionized impurity scattering 共IIS兲 prevails. At frequencies higher than the screened plasma frequency we compare data based on a frequency dependent relaxation time due to ionized impurity scattering21 and a constant effective relaxation time according to Drude theory. At frequencies lower than the screened plasma frequency, a constant relaxation time is used. In the case of ionized impurity scattering, the frequency dependent relaxation time is given by21
共 兲⫽0 IIS
冉 冊 p
⫺3/2
冑 ⬁
3/2,
共12兲
where p / 冑 ⬁ is the screened plasma frequency. We put ⬁ ⫽4 in the calculations and used m e ⫽0.4 m, where m is the free electron mass.21 The filling factor in the Bruggeman model is related to the sample resistivity in the dc limit as22
⫽p
冉 冊
1⫺ f c , f⫺fc
共13兲
where is the resistivity measured for the film and f c is the filling factor corresponding to the percolation limit, which is 0.33 in the Bruggeman model. Thus Eq. 共13兲 makes it pos-
FIG. 5. Normalized resistivity vs temperature t for the samples characterized in Table I. Part 共a兲 represents data for all samples, and part 共b兲 amplifies the resistivity change for sample E.
sible to relate the measured dc resistivity to the resistivity obtained by fitting the Bruggeman model to the experimental data, as considered in Sec. V. V. RESULTS A. Electrical data and analysis
Temperature dependent resistivity measurements were performed using a standard four-probe setup. All samples were cut into 7⫻7 mm2 squares, and four electrodes were mounted in the corners using silver paste. Resistance was measured by applying a constant current of 500 A, using a Keithley 2400 source instrument, and measuring the voltage using a Keithley 2002 voltmeter. The heating rate was set to 2.5 K/min. Figure 4 presents room temperature resistivity data for all samples. It is clearly displayed that the resistivity is decreased upon annealing. Sample E exhibits a resistivity of ⬃1⫻10⫺2 ⍀ cm, which is much larger than the minimum value found in the literature, viz. ⬃1⫻10⫺4 ⍀ cm. 23,24 However, one should take into consideration that the present samples exhibit a large degree of porosity, as evident from the filling factor being 0.33–0.35.
155410-5
PHYSICAL REVIEW B 68, 155410 共2003兲
J. EDERTH et al.
FIG. 6. Normalized resistivity versus temperature t for samples A–D characterized in Table I. Experimental data are shown together with computations from the fluctuation induced tunneling model 关Eq. 共3兲兴 using the fitting parameters in Table II.
Measurements of temperature dependent resistivity (t) were carried out in the 77⬍t⬍300 K range. Figure 5 shows that samples A–D exhibit a negative TCR in the whole temperature range, whereas the temperature dependent resistivity of sample E displays a metallic-like behavior with a positive TCR in the 150⬍t⬍300 K range. At approximately 130 K, the resistivity of this sample reaches a minimum and at t ⬍130 K the temperature dependent resistivity has a negative TCR. There are several different electrical transport mechanisms that can yield a negative TCR, as discussed in Sec. IV above, and next we analyze the (t) data of samples A–D in order to obtain information on which mechanism is dominating in our porous ITO nanoparticle films. The experimental resistivity data for samples A–D are compared to data obtained from the fluctuation induced tunneling model in Fig. 6. Good agreement is observed for all samples in the whole temperature range. The fitting parameters, i.e., t 0 and t 1 , are given in Table II. Figure 7 presents data for samples A–D plotted as log (t) versus t ⫺1/q with q⫽4, corresponding to the VRH model for electrical transport, as introduced above. A straight-line fit would indicate that this theoretical model applies. Since the curve deviates from a linear fit by a concave curvature, VRH is not valid for the transport mechanism present in these samples. Furthermore we can conclude, from
FIG. 7. Logarithm of the normalized resistivity vs temperature t to the power ⫺1/q, with p⫽4 according to the VRH model, for samples A–D characterized in Table I. A straight line would indicate the applicability of the VRH model.
the concave curvature shown in Fig. 7, that neither q equal to 1 共NNH兲 nor 2 共GM兲 can represent the data. Figure 8 shows (t) versus t ⫺3/2 for samples A–D in the whole measured temperature range. None of the samples exhibit a straight line, i.e., Eq. 共7兲 is also incapable of representing our data. B. Optical data and analysis
Spectral near-normal reflectance R and transmittance T were measured in the 0.3⬍⬍2.5 m wavelength range using a Perkin Elmer Lambda 9 spectrophotometer equipped with an integrating sphere coated with BaSO4 . Infrared transmittance was measured at 2.5⬍⬍4.5 m and infrared reflectance at 2.5⬍⬍30 m using a Perkin Elmer 983 infrared spectrophotometer with an Au mirror as reference. Figures 9共a兲–9共e兲 presents R for 0.3⬍⬍30 m and T for 0.3⬍⬍2.5 m.
TABLE II. Data for the fitting parameters t 0 and t 1 in the fluctuation induced tunneling model; see Eq. 共2兲. Sample
t0 共K兲
t1 共K兲
t 21 /t 0 共K兲
A B C D
138 139 141 137
317 289 193 119
728 601 264 103
FIG. 8. Normalized resistivity vs temperature t to the power ⫺3/2 for samples A–D characterized in Table I. A straight line would indicate the applicability of Eq. 共7兲. 155410-6
PHYSICAL REVIEW B 68, 155410 共2003兲
ELECTRICAL AND OPTICAL PROPERTIES OF THIN . . .
FIG. 9. 共a兲–共e兲 Experimental spectral reflectance and transmittance fitted to the Bruggeman effective medium theory including the effect of ionized impurity scattering 共IIS兲. Data are shown for the samples specified in Table I. Note the change in scale at 2.5 m in wavelength. Theoretical modeling embraces a constant relaxation time 共Drude model兲 and a relaxation time varying as expected for IIS.
The data show that the luminous transmittance exceeds 90% for all samples, except for sample E where this transmittance is slightly lower than 90%. Infrared reflectance data show that R increases upon annealing, with sample E displaying R⬇45% at ⫽30 m. Figure 10 shows the absorption coefficient ␣ for all samples at 0.3⬍⬍2.5 m as calculated from the method of Hong25 by the relation
冉
冊
1⫺R 共 兲 1 ␣ 共 兲 ⫽ ln , T共 兲
共14兲
where is sample thickness. Figure 10 clearly displays an increase in the absorption strength, and a shift of the absorption peak towards shorter wavelengths, upon annealing. These effects are discussed below. The fitting involves varying the filling factor, starting from the percolation limit. The resistivity of the particles is then given by Eq. 共13兲, by taking to be equal to the mea-
sured dc value. Equation 共11兲 yields a relation between p , n e , and . Thus we use f and n e as fitting parameters. Their values determine uniquely the other parameters of the problem, namely p 关by Eq. 共13兲兴 and 0 关by Eq. 共11兲兴. The mobility is obtained from
p⫽
e0 . me
共15兲
The reflectance and transmittance were calculated for the samples, with proper account taken of the glass substrate. The thin porous ITO film was represented as a single layer,26 using the dielectric function for the composite film derived from the effective medium theory. The glass substrate was treated in the noncoherent approximation, i.e., only considering light intensities, which were summed up to a total reflectance and transmittance. For the 0.3⬍⬍2.5 m wavelength range we used unpublished optical constants for Corning 7059 glass. Optical constants at 5.0⬍⬍30.0 m
155410-7
PHYSICAL REVIEW B 68, 155410 共2003兲
J. EDERTH et al.
FIG. 10. Spectral absorption coefficient for the samples specified in Table I.
were taken from Ref. 27, and optical constants at 2.0⬍ ⬍5.0 m were calculated from experimental R and T using the method of McPhedran et al.28 Figures 9共a兲–9共e兲 present data based on the effective medium model fitted to experimental results on R and T. Theoretical descriptions using a constant relaxation time 共Drude兲 as well as a frequency dependent relaxation time 共IIS兲 according to Eq. 共12兲 were employed. Fitting parameters are given in Table III. Both models give identical reflectance in the infrared wavelength range since the frequency dependent relaxation time is introduced at ⬎ p / 冑 ⬁ . Thus both models gave the same dc-relaxation time. It is in the visible and near infrared wavelength range that the two models exhibit discrepancies. The difference in R is not significant, due to its low level at visible and near infrared wavelengths in these samples, but differences in T are clearly observed. The Drude model is found to give a lower T than the IIS model. Within the IIS model the relaxation time increases with increasing frequency at ⬎ p / 冑 ⬁ , and hence the absorption is decreased. This leads to a higher T than the one obtained by the Drude model. VI. DISCUSSION
A straight line in Fig. 7 would have indicated that the transport property is dominated by a variable range hopping mechanism. However, in the experiments no straight lines TABLE III. Fits between theory and experiment were made with the shown values of filling factor f , and electron density n e . Data are given also on the derived mobility p and resistivity p .
f
ne (1020 cm⫺3 )
p (cm2 /Vs)
p (10⫺4 ⍀ cm)
0.334 0.336 0.338 0.348 0.349
4.0 5.0 5.5 6.0 8.0
22.3 20.8 25.2 26.0 39.0
7.0 6.0 4.5 4.0 2.0
Sample A B C D E
were found. So, a hopping mechanism is not likely. Thus the charge carriers, i.e., the conduction electrons, are not localized and the electrical transport within each ITO particle was found to be due to conduction electrons scattered by ionized impurities. However, the fact that Fig. 8 also does not yield a straight-line behavior clearly shows that the conduction electrons, scattered by ionized impurities, do not govern the temperature dependent electrical dc transport properties in these samples. It is thus evident that the grain boundaries, or the possible insulating barriers between particles or clusters of particles, play a significant role for the transport properties. A granular-metal charging energy model would not be unexpected, since the samples consist of nanosized ITO particles in a percolating network. However, since q⫽4 gives a clear concave curvature 共see Fig. 7兲, putting q⫽2, as expected in the granular metal model, would then give an even stronger concave curvature, thus indicating that the temperature dependent resistivity is not strongly influenced by the capacitive charging energy of the individual ITO nanoparticles. This gives a clear indication that the particles are sintered into clusters minimizing the charging energy. The good fit between experiment and theory for fluctuation induced tunneling in Fig. 6 gives a strong indication of a film structure consisting of large clusters of particles, and further shows that possible insulating barriers between the individual nanoparticles, within each cluster, do not contribute significantly to the electrical transport properties of the films. For the fluctuation induced tunneling model to be applicable to the experimental data, the charging energy must be negligible compared to the thermal energy k B t, which means that the metallic parts or clusters of sintered ITO particles must be of the order of several m. Thus the temperature dependent resistivity is dominated by thermally activated voltage fluctuations across the insulating layers, and this mechanism is responsible for the negative TCR. From Table II it is observed that t 0 is almost identical for all annealing temperatures, and that t 1 decreases with annealing. Equations 共4兲 and 共5兲 yield that the ratio t 21 /t 0 is proportional to AV 5/2 0 , and from Table II it is clearly shown that this ratio is decreased upon annealing. This means that the barrier height drops with annealing. This is certainly a scenario that is physically reasonable, since the room temperature resistivity also goes down as a result of annealing. Furthermore, as V 0 decreases with annealing the area A of the boundary must increase 共assuming a constant width of the barrier兲 to maintain a constant t 0 , which is reasonable since it is likely that sintering occurs due to the annealing, resulting in an increased area between adjacent clusters. From Eqs. 共4兲 and 共5兲 it is obvious that t 0 and t 1, obtained from the fitting, are insufficient for a determination of the three barrier parameters w, A, and V 0 . However, an estimation of A and V 0 may be obtained if one assumes a value of w. A reasonable value for the barrier width would be ⬃1 nm, and using the data on t 0 and t 1 for sample D then gives a barrier height of ⬃0.08 eV and an area of ⬃93 nm2 . From the fitting parameters obtained from the fluctuation induced tunneling model for samples A–D the resistivity curves were extrapolated down to low temperatures. It was found that the crossover to a temperature independent resisitivity due to inelastic tunnel-
155410-8
PHYSICAL REVIEW B 68, 155410 共2003兲
ELECTRICAL AND OPTICAL PROPERTIES OF THIN . . .
ing, which should be observable much below t 0 , 12 appears at approximately 20 K for all samples. Sample E, annealed at the highest temperature, exhibits a metallic behavior with a positive TCR in the 130⬍t ⬍300 K range. Within our framework of interpretation, the conducting clusters have then sintered and formed conducting paths through the whole sample so that a metallic behavior is observed. At t⬍130 K, the TCR changes sign. Unfortunately we have data only down to 77 K, which makes the analysis of the resistance data below 130 K difficult. However, we can speculate that at low temperatures the resistivity is dominated by ionized impurity scattering, as would be consistent with our optical analysis; see below. It is clearly seen in Figs. 9共a兲–9共e兲 that the introduction of a frequency dependence in the relaxation time, due to ionized impurity scattering, significantly improves the fit in the visible and near infrared wavelength ranges. This gives a strong indication of a transport mechanism within the ITO nanoparticles that is dominated by ionized impurity scattering. The agreement between theory and experiment is less good further out in the infrared. This may be an effect of grain boundary scattering, which is not included in the models. It is observed that the agreement between theory and experiment improves for samples with larger grain size, i.e., samples E and D. Furthermore, it is found that all samples display a low filling factor; as seen from Table III, f is close to the percolation limit. This supports the results from our RBS measurements and thickness determinations, which yielded a high degree of porosity. It is also shown that n e and p increase upon annealing. The ITO nanoparticles in sample E display n e ⬇8⫻1020 cm⫺3 along with p ⬇39 cm2 /Vs. Room temperature resistivity obtained from the fitting is as low as ⬃2⫻10⫺4 ⍀ cm 共sample E兲. This result can be compared to data in the literature and, for example, 7.2⫻10⫺5 ⍀ cm was reported for highly transparent thin ITO films prepared by laser evaporation in a magnetic field29 while a room temperature resistivity of ⬃1⫻10⫺4 ⍀ cm is more typically quoted for optimized ITO films.30,31 The increase in the mobility is most probably due to two effects: grain growth and improved crystallinity. The lattice may be distorted as a consequence of the introduction of dopant atoms, i.e., Sn4⫹ in the case of ITO. The degree of distortion is represented by the change in the lattice parameter. However, the lattice parameter in our samples is close to the value of undoped In2 O3 and, furthermore, no change was observed in the lattice parameter upon annealing. Grain growth results in a decreased number of grain boundaries and, thus, less grain boundary scattering. Our samples dis-
*Present address: Optical Systems Department, Fraunhofer-Institut fu¨r Angewandte Optik und Feinmechanik, Schillerstrasse 1, D-07745 Jena, Germany. † Also at Research Group of Laser Physics of the Hungerian Academy of Sciences, P.O. Box 406, H-6701 Szeged, Hungary. 1 R. G. Gordon, MRS Bull. 25, 52 共2000兲. 2 Y. Shigesato, S. Takaki, and T. Haranou, Appl. Surf. Sci. 48Õ49, 269 共1990兲.
play a significant grain growth upon annealing, which may explain the increased mobility. The increase in n e may be a result of the increased number of oxygen vacancies upon annealing in a reducing atmosphere at each temperature. Each oxygen vacancy contributes two extra electrons. Since our samples are porous there is a large internal sample surface in contact with the reducing atmosphere. It is therefore possible that oxygen vacancies are created close to the particle surface. However, RBS measurements did not reveal any significant decrease of the oxygen content in the film upon annealing. As a result of the increased n e , the plasma frequency—responsible for a peak in the absorption—shifts towards shorter wavelengths, which clearly is consistent with the experimental data shown in Fig. 10. It is obvious from the fitting parameters in Table III that the filling factor of ITO remains low upon annealing. Thus a very important result of our work is that in order to produce samples with low resistivity, an increased filling factor of ITO is required.
VII. CONCLUSIONS
Temperature dependent electrical transport and optical properties in porous thin films comprising ITO nanoparticles with a narrow size distribution have been investigated. In samples annealed at t⭐923 K, the transport properties are dominated by thermally activated voltage fluctuations across insulating barriers as described by a fluctuation induced tunneling model, thus indicating that the sample consists of m-sized conducting clusters separated by insulating barriers. Samples annealed at 1073 K display a metallic behavior at t⬎150 K, and the resistivity has a minimum at ⬃130 K. Effects of annealing on the electrical transport properties within the ITO nanoparticles were investigated by an analysis of optical data using the Bruggeman effective medium theory and accounting for ionized impurity scattering. All samples exhibited a low filling factor of ITO, i.e., a high degree of porosity and a low mass density were obtained. The filling factor remained almost unchanged upon annealing, suggesting that the compaction of the samples was not significant due to the heat treatment. It was found that both the charge carrier concentration and mobility increased upon annealing. The resistivity within the ITO nanoparticles was as low as 2⫻10⫺4 ⍀ cm, which is comparable to the resistivity in dense ITO films made by physical vapor deposition. Hence, an efficient densification process is required to obtain films with a low resistivity.
3
R. B. H. Tahar, T. Ban, Y. Ohya, and Y. Takahashi, J. Appl. Phys. 83, 2631 共1997兲. 4 N. Kikuchi, E. Kusano, E. Kishio, A. Kinbara, and H. Nanto, J. Vac. Sci. Technol. A 19, 1636 共2001兲. 5 K. Subba Ramaiah, V. Sundara Raja, A. K. Bhatnagar, R. D. Tomlinson, R. D. Pilkington, A. E. Hill, S. J. Chang, Y. K. Su, and F. S. Juang, Semicond. Sci. Technol. 15, 676 共2000兲. 6 C. G. Granqvist and A. Hulta˚ker, Thin Solid Films 411, 1 共2002兲.
155410-9
PHYSICAL REVIEW B 68, 155410 共2003兲
J. EDERTH et al. 7
I. Hamberg, C. G. Granqvist, K. F. Berggren, B. Sernelius, and L. Engstro¨m, Phys. Rev. B 30, 3240 共1984兲. 8 M. Toki and M. Aizawa, J. Sol-Gel Sci. Technol. 8, 717 共1997兲. 9 N. Nadaud, M. Nanot, and P. Boch, J. Am. Ceram. Soc. 77, 843 共1994兲. 10 T. Kayukawa, H. Shigetani, and M. Senna, J. Mater. Sci. Lett. 14, 252 共1995兲. 11 J. Ederth, A. Hulta˚ker, P. Heszler, G. A. Niklasson, C. G. Granqvist, A. R. van Doorn, C. van Haag, M. J. Jongerius, and D. Burgard, Proc. Soc. Photo-Opt. Instrum. Eng. 4590, 280 共2001兲. 12 P. Sheng, Phys. Rev. B 21, 2180 共1980兲. 13 D. A. G. Bruggeman, Ann. Phys. 共Leipzig兲 24, 636 共1935兲. 14 A. Hulta˚ker, A. Hoel, C. G. Granqvist, A. van Doorn, M. J. Jongerius, and D. Burgard, in Nanophase and Nanocomposite Materials IV, edited by S. Komarneni, J. C. Parker, R. A. Vaia, G. Q. Lu, and J. Matsuchita, MRS Symposia Proceedings No. 703 共Materials Research Society, Pittsburgh, 2002兲, p. 185. 15 B. D. Cullity, Elements of X-Ray Diffraction 共Addison-Wesley, Reading, MA, 1956兲. 16 N. Mott, Metal-Insulator Transitions 共Taylor and Francis, London, 1990兲. 17 Z. H. Wang, M. S. Dresselhaus, G. Dresselhaus, K. A. Wang, and P. C. Eklund, Phys. Rev. B 49, 15 890 共1994兲.
18
B. R. Nag, Electron Transport in Compound Semiconductors 共Springer, Berlin, 1980兲, Vol. 11. 19 J. Ederth, G. A. Niklasson, A. Hulta˚ker, P. Heszler, C. G. Granqvist, A. van Doorn, M. J. Jongerius, and D. Burgard, J. Appl. Phys. 93, 984 共2003兲. 20 I. Hamberg, Ph.D. thesis, Chalmers University of Technology, Gothenburg, Sweden, 1984. 21 I. Hamberg and C. G. Granqvist, J. Appl. Phys. 60, R123 共1986兲. 22 C. G. Granqvist and O. Hunderi, Phys. Rev. B 18, 1554 共1978兲. 23 Y. Suzuki, F. Niino, and K. Katoh, Thin Solid Films 218, 30 共1997兲. 24 K. Utsumi, O. Matsunaga, and T. Takahata, Thin Solid Films 334, 30 共1998兲. 25 W. Q. Hong, J. Phys. D 22, 1384 共1989兲. 26 Z. Knittl, Optics of Thin Films 共Wiley, New York, 1976兲. 27 G. Ljungdahl, Ph.D. thesis, Uppsala University, Uppsala, Sweden, 1992. 28 R. C. McPhedran, L. C. Botten, D. R. McKenzie, and R. P. Netterfield, Appl. Opt. 23, 1197 共1984兲. 29 A. Suzuki, T. Matsushita, T. Aoki, Y. Yoneyama, and M. Okuda, Jpn. J. Appl. Phys. 40, L401 共2001兲. 30 Y. Suzuki, F. Niino, and K. Katoh, Thin Solid Films 218, 30 共1997兲. 31 K. Utsumi, O. Matsunaga, and T. Takahata, Thin Solid Films 334, 30 共1998兲.
155410-10