Sep 9, 2002 - applying either cathodic protection or the relatively new ... However, both cathodic protection and electrochemical chloride extraction.
Electrochemical Chloride Extraction: Influence of Concrete Surface on Treatment
Stephen R. Sharp Gerry G. Clemeña Y. Paul Virmani Glenn E. Stoner Robert G. Kelly
September 9, 2002
i
FOREWORD Many now recognize that once chloride-induced corrosion of the reinforcing steel bars has initiated in a concrete bridge, the only truly effective means of stopping corrosion in the structure is by applying either cathodic protection or the relatively new electrochemical chloride extraction. In addition to providing some beneficial effects to a treated concrete bridge, electrochemical chloride extraction offers some advantages over the use of cathodic protection. Electrochemical chloride extraction extends the functional life of the treated structure, but does not require the long-term commitment generally required of cathodic protection systems. However, both cathodic protection and electrochemical chloride extraction are operated without requiring the excavation of structurally sound concrete that is contaminated with chlorides. This can provide an advantage that does not exist with other restoration techniques. To facilitate wider application of electrochemical chloride extraction in the rehabilitation of concrete bridges, this investigation was initiated with the objectives of improving the effectiveness of the treatment and contributing to the determination of additional service life that results from treating a structure. This interim report describes the progress made in ascertaining the cause of the abrupt drop in the amount of current that can pass through salt-contaminated concrete. This reduction in current, typically observed during the first several days of treatment, in turn relates to a decrease in chloride removal.
T. Paul Teng, P.E. Director, Office of Infrastructure Research and Development
NOTICE This document is disseminated under the sponsorship of the U. S. Department of Transportation in the interest of information exchange. The U. S. Government or the State of Virginia assumes no liability for its content of use thereof. This Report does not constitute a standard, specification, or regulation. The U. S. Government or the State of Virginia does not endorse products or manufacturers. Trade and manufacturers’ names appear in this report only because they are considered essential to the object of the document.
i
1. Report No .
Standard Title Page - Report on Federally Funded Project 3. Recipient’s Catalog No. 2. Government Accession No .
FHWA-RD-02-107 4. Title and Subtitle
5. Report Date
Electrochemical Chloride Extraction: Influence of Concrete Surface on Treatment
September 2002 6. Performing Organization Code
VTRC 02-R 7. Author(s)
8. Performing Organization Report No.
Stephen R. Sharp,* Gerry G. Clemeña,* Y. Paul Virmani,** Glenn E. Stoner,*** Robert G. Kelly *** 9. Performing Organization and Address
10. Work Unit No. (TRAIS)
Virginia Transportation Research Council 530 Edgemont Road Charlottesville, Virginia 22903
11. Contract or Grant No. 13. Type of Report and Period Covered
12. Sponsoring Agencies' Name and Address Office of Infrastructure Research and Development Federal Highway Administration 6300 Georgetown Pike McLean, Virginia 22102-2296
Interim Report 14. Sponsoring Agency Code
15. Supplementary Notes
* Virginia Transportation Research Council, 530 Edgemont Road, Charlottesville, Virginia 22903 ** Federal Highway Administration, Turner-Fairbank Highway Research Center, 6300 Georgetown Pike, McLean, VA 22101-2296 *** University of Virginia, Material Science and Engineering, Charlottesville, VA 22903 Drs. O. M. Schneider and C. A. Dukes, and Messrs. C. M. Apusen, L. E. Dougald, and B. T. Ward, and Ms. E. F Aiken are each recognized for their contributions to this project 16. Abstract
One bridge restoration technique available for reducing corrosion-induced concrete deterioration, which removes chloride ions while simultaneously realkalizing the concrete adjacent to the steel, is electrochemical chloride extraction (ECE). Studies have shown that ECE is capable of removing, in a single application, a significant portion of the chloride ions from a reinforced concrete structure. Prior research has also shown that the quantity of chloride ions removed is dependent on numerous factors including quantity and spacing of reinforcing steel, applied voltage, initial chloride concentration, etc. In addit ion, investigations into chloride binding and competition between other ions as current carriers have helped to clarify the probable mechanisms responsible for decreases in current efficiency with time during chloride removal. This portion of the investigation has focused on the influence of water-to-cement (w/c) ratio. In addition, an investigation was conducted to identify the cause of decrease in efficiency during chloride removal. A clear relationship between the w/c ratio and the chloride extraction rate was not evident. However, the investigation revealed that the resistance of the concrete surface layer increases considerably during ECE, which effectively restricts the current flow, while the resistance of the underlying layer of concrete either decreases or remains constant. It appears that the increased resistance of the surface layer concrete is accompanied by the formation of a tightly adhering residue on the concrete surface. Preliminary analysis of the surface formation indicates it contains calcium carbonate and calcium chloride. 17. Key Words
18. Distribution Statement
Cathodic protection, chloride ions, electrochemical chloride extraction, rehabilitation of concrete bridges, reinforced concrete, removal of chloride, steel corrosion in concrete,
No restrictions. This document is available to the public through NTIS, Springfield, VA 22161.
19. Security Classif. (of this report)
20. Security Classif. (of this page)
21. No. of Pages
Unclassified
Unclassified
49
Form DOT F 1700.7 (8-72)
Reproduction of completed page authorized
i
22. Price
ii
Table of Contents LIST OF FIGURES ........................................................................................................................................................iv LIST OF TABLES ...........................................................................................................................................................v INTRODUCTION, LITERATURE REVIEW, AND PURPOSE........................................................................... 1 Introduction................................................................................................................................................................. 1 Literature Review....................................................................................................................................................... 1 Corrosion Threshold ............................................................................................................................................. 1 Electrochemical Chloride Extraction................................................................................................................. 2 Conductivity and Electrochemical Chloride Extraction................................................................................. 5 Purpose....................................................................................................................................................................... 10 EXPERIMENTAL METHOD .................................................................................................................................... 11 Specimen Design...................................................................................................................................................... 11 Electrochemical Chloride Extraction .................................................................................................................... 16 Current and Voltage Measurements...................................................................................................................... 16 IR Drop Measurements............................................................................................................................................ 16 4-Pin Resistivity Measurements............................................................................................................................. 18 Half-Cell Measurements ......................................................................................................................................... 18 Collection of Concrete Samples............................................................................................................................. 18 Potentiometric Titration .......................................................................................................................................... 19 X-Ray Diffraction..................................................................................................................................................... 19 X-Ray Photoelectron Spectroscopy....................................................................................................................... 19 RESULTS AND DISCUSSION ................................................................................................................................. 21 Changes in the Current and Voltage during ECE ............................................................................................... 21 Influence of Concrete Surface on Voltage and Current..................................................................................... 23 Changes in the Concrete Resistance During ECE .............................................................................................. 26 Resistivity .................................................................................................................................................................. 26 Chloride Concentration in Concrete with ECE ................................................................................................... 28 Visual Observations................................................................................................................................................. 31 Surface Deposit Analysis ........................................................................................................................................ 33 CONCLUSIONS AND FUTURE WORK................................................................................................................ 37 Conclusions............................................................................................................................................................... 37 Future Work .............................................................................................................................................................. 37 REFERENCES............................................................................................................................................................... 39
iii
LIST OF FIGURES Figure 1. Potential influences on the corrosion threshold for steels exposed to chlorides................................. 2 Figure 2. Cathodic protection system for reinforced concrete................................................................................ 3 Figure 3. Illustration of ECE setup on the 34th Street Bridge in Arlington, Virginia, USA ............................. 4 Figure 4. Illustration of a Type I Specimen ............................................................................................................. 13 Figure 5. Illustration of a Type II Specimen ............................................................................................................ 15 Figure 6. Illustration of voltage components for a driven system........................................................................ 17 Figure 7. Change in voltage after interruption of applied current........................................................................ 17 Figure 8. Four pin resistivity test method................................................................................................................. 18 Figure 9. Type II specimen drill pattern for sample collection............................................................................. 19 Figure 10. Measured voltage changes during ECE in a set of Type I specimens.............................................. 22 Figure 11. Comparison of the voltages measured in two Type II specimens..................................................... 23 Figure 12. Timeline of concrete surface study........................................................................................................ 24 Figure 13. Influence of concrete exterior surface on the voltage and current in a 0.45-w/c Type I specimen ........................................................................................................................ 24 Figure 14. Example showing the change in resistances for a single set of Type I specimens during ECE .. 26 Figure 15. Change in Resistivity for Type I specimens of various w/c ratios.................................................... 27 Figure 16. Resistivity change in the upper layer of concrete................................................................................ 27 Figure 17. Resistivity change in the lower layer of concrete................................................................................ 28 Figure 18. Average change in chloride concentrations due to ECE in Type I specimens with 4.4 cm of concrete cover over rebar......................................................................................................................... 29 Figure 19. Average change in chloride concentrations due to ECE in Type I specimens with 5.7 cm of concrete cover over rebar......................................................................................................................... 29 Figure 20. Change in chloride concentrations due to ECE in a single set of Type II specimens with 3.8 cm of concrete cover over rebar ....................................................................................................... 30 Figure 21. Average change in chloride concentrations due to ECE in Type II specimens with 6.4 cm of concrete cover over rebar......................................................................................................................... 30 Figure 22. Tightly adhering layer of white material formed on the concrete surface during ECE. ............... 31 Figure 23. Various views of surface layer that formed on the concrete during ECE........................................ 31 Figure 24. Layer of white material formed on the concrete surface directly above the reinforcing steel following ECE on an actual bridge deck ............................................................................................... 31 Figure 25. Surface appearance of a Type I specimen............................................................................................. 32 Figure 26. Surface deposit XRD pattern from a Type II specimen...................................................................... 33 Figure 27. Proposed Type III specimen.................................................................................................................... 38
iv
LIST OF TABLES Table 1. Factors influencing corrosion threshold value........................................................................................................... 2 Table 2. Ionic conductivity values............................................................................................................................................... 6 Table 3. Calculated transference values for a solution containing 0.5 mol/l NaCl and 0.5 mol/l NaOH........................ 6 Table 4. Influences of various factors on ECE.......................................................................................................................... 7 Table 5. ECE treatment on selected North American structures............................................................................................ 8 Table 6. Half-cell potentials on treated and untreated North American structures ............................................................. 9 Table 7. Description of Type I concrete test blocks ............................................................................................................... 11 Table 8. Description of Type II concrete test blocks.............................................................................................................. 12 Table 9. Mix design for Type I concrete specimens............................................................................................................... 12 Table 10. Mix design for Type II concrete specimens........................................................................................................... 12 Table 11. Description of contact points used to make measurements in Type I concrete test blocks ........................... 14 Table 12. Description of contact points used to make measurements in Type II concrete test blocks.......................... 14 Table 13. ECE comparison between the different specimens............................................................................................... 14 Table 14. ECE parameters........................................................................................................................................................... 16 Table 15. Surface deposit peak data using x-ray diffraction................................................................................................. 34 Table 16. Surface deposit peak data using x-ray photoelectron spectroscopy................................................................... 35
v
6
INTRODUCTION, LITERATURE REVIEW, AND PURPOSE Introduction This report contains typical scientific abbreviations. It is known that chlorides can lead to corrosion in reinforced concrete structures. A second detrimental factor then transpires because the corrosion product requires a larger volume of space than the original iron. This creates tensile stresses, which makes the concrete more prone to cracking and spalling. If this process continues, premature deterioration of a bridge can result. Therefore, in chloride contaminated bridges it is vital to have a method for alleviating the corrosive attack on the reinforcing steel. Currently, two electrochemical methods are available, cathodic protection (CP) and electrochemical chloride extraction (ECE), each having certain advantages and disadvantages. Although ECE is a proven means of removing chlorides from the concrete while increasing the pH in the region adjacent to the reinforcing steel, extensive use has not developed partially due to a deficient understanding in the following issues : •
The cause of the decrease in current flow and, therefore, the rate of chloride extraction over the duration of a treatment.
•
The influence of initial parameters, such as concrete properties and initial chloride concentration, on the required duration of chloride extraction for a concrete structure.
•
An estimation of the additional service life following an application.
Interest in the movement of ions through concrete has prompted numerous studies, both theoretical and experimental. Currently, data from field and laboratory experiments indicate certain regions in concrete appear to lead to inefficient chloride extraction. By determining the regions of low efficiency and the controlling mechanisms, questions relating to extraction rates, efficiency, and beneficial life can be addressed. It is anticipated that upon the completion of this project, techniques for altering the procedure and/or materials will provide a means to improve the ECE process.
Literature Review Corrosion Threshold Despite differing opinions on corrosion mechanisms and ion ingress into concrete, the concentration and movement of oxygen, chloride, and hydroxyl ions are all considered important factors in the corrosion of reinforcing steel. However, chloride ions are considered the key factor with regard to the corrosion. Li, et al., presented the flow chart shown in figure 1, which is based on the work from several studies that investigated the relationship between chloride concentration and reinforcing steel corrosion.[1] This diagram emphasizes the numerous factors that could influence the corrosion threshold value.[1] Early research into the corrosion of reinforcing steel indicated that a change in alkalinity near the reinforcement can significantly influence the steels’ susceptibility to corrosive attack.[2] According to Hausmann, the chloride threshold value, which is given in equation 1, is a function of the chloride and hydroxyl ion concentrations ratio and should not exceed 0.61.[2]
1
[Cl ] ≤ 0.61 [OH ] −
(1)
−
Figure 1. Potential influences on the corrosion threshold for steels exposed to chlorides [1] Based on the relationship in equation 1, it has been suggested that concrete could have a higher percentage of chlorides if they were introduced during the mixing stage, due to binding of some of the chloride, versus if chlorides diffuse into a cured concrete block.[3, 4] Other researchers have produced estimates for the chloride threshold value that range from 75 – 3640 ppm in concrete.[5] The effects of several other factors on the corrosion threshold value are summarized in Table 1. Table 1. Factors influencing corrosion threshold value[3, 5-12] Description Dehydration of concrete Water saturation resulting in oxygen depletion Concrete sealed or pores constricted Increase in humidity Changing concrete mixture (i.e. admixtures, w/c ratio)
Effect on Threshold Value Increases Increases Increases Decreases Increases or Decreases
Electrochemical Chloride Extraction The concept of removing chloride ions from concrete by electrochemical migration was borne in 1973 out of Kansas Department of Transportation (KDOT) experiments on electro-stabilization of clayey
2
soils. [13] Since then, numerous studies have shown it is possible to remove chlorides from concrete using electrochemical means.[14-17] To facilitate the treatment of vertical surfaces a commercial electrochemical method was developed, which is known as Norcure TM.[18] The benefit of removing the chloride ions electrochemically is that contaminated concrete that are still structurally sound would not require excavation and will remain in place after the application of the chloride removal process. This restoration technique has inherited various names; electrochemical chloride removal, desalination, and electrochemical chloride extraction.
Electrochemical Chloride Extraction vs. Cathodic Protection ECE and CP have some distinct similarities and differences. Although both are DC techniques that cathodically polarize the reinforcing steel and reduce the corrosion rate, CP is usually permanently installed, operates at lower current densities (approximately 10 mA/m2 ), and usually requires routine maintenance.[17] Figure 2 is an illustration of a typical CP system installed on a bridge deck with the anode permanently embedded in the concrete overlay. In contrast, ECE is an in-situ restoration technique that is designed to remove chlorides and increase the alkalinity adjacent to the reinforcing steel. A temporary treatment system is attached to the concrete and the applied voltage causes a direct current, which can be up to 1 A/m2 , to flow through the concrete for typically 4 to 8 weeks.[14, 16, 17] The ECE system is then removed following completion of the treatment process. Currently, ECE of bridge decks, using a system such as that illustrated in figure 3, requires changes to the traffic pattern during operation. However, ECE of concrete bridge piers do not generally require the rerouting of traffic.
Figure 2. Cathodic protection system for reinforced concrete
3
Figure 3. Illustration of ECE setup on the 34th Street Bridge in Arlington, Virginia, USA [17] Both electrochemical techniques produce hydroxyl ions at the cathode or the rebars, while water is decomposed at the anode.[16] As shown in the following reactions, hydrogen gas can be produced at the cathode, and chlorine evolution and/or acidification of the electrolyte can occur at the anode during ECE. Two possible reactions at the cathode during ECE are: [16] 2H2 O + O2 +4e - à 4OH-
(2)
H2 O + e- à Ho ADS + OH-
(3)
At the anode, ECE can generate the following reactions: [16] 2H2 O à 4e- + O2 + 4H+
(4)
2Cl- à 2e- + Cl2
(5)
In addition, the following chemical reaction can occur in the electrolyte: [16] H2 O + Cl2 à HCl + HClO
(6)
As hydroxyl ions are produced at the cathode the pH adjacent to the steel increases, which is beneficial for the rebar, but these electrochemical reactions can create adverse effects like hydrogen embrittlement or alkali aggregate reaction. In equation 3,“Ho ADS” is nascent hydrogen, which could either enter the metal or form hydrogen gas. These issues are discussed further in the section “Effects of Electrochemical Chloride Extraction” on page nine.
Material Requirements for Electrochemical Chloride Extraction Figure 3 is an illustration of an ECE system using a catalyzed titanium mesh anode, however other anodes have performed satisfactorily.[14, 16, 17, 19-25] Steel mesh anodes cost less than inert catalyzed titanium mesh anode, but some of the steel is consumed during the extraction process and therefore it has a shorter functional life.[20, 26] In addition, some have suggested that the corrosion product from the steel anode can deposit in concrete pores and decrease the chloride extraction efficiency if ECE is being applied on an upward facing horizontal surface.[25]
4
Potable water has shown favorable results as an electrolyte during ECE. [22] Calcium hydroxide solutions have also been used as an electrolyte in many applications. A benefit of using calcium hydroxide is it reduces the chance of the electrolyte becoming acidic and etching the concrete when a catalyzed titanium anode is used.[17, 26] In addition, increasing the alkalinity of the electrolyte reduces the evolution of chlorine gas.[25] A third common electrolyte is lithium borate solution, which is useful when dealing with concrete containing aggregates susceptible to alkali-aggregate or alkali-silica reaction (ASR).[22, 26, 27] The lithium borate solution is actually a mixture of lithium hydroxide and boric acid, which ensures lithium ions are available to penetrate the concrete and reduce or eliminate ASR.[3, 26] This solution is the most expensive of the commonly used electrolytes.[26] Although the electrolytes presently used for ECE do not contain corrosion inhibitors, Asaro, et al., demonstrated in a strategic highway research program (SHRP) study that it is possible to inject inhibitors using a similar setup as ECE. [28] During ECE it is important to maintain good contact between the electrolyte and the concrete surface to minimize circuit resistance. This has been accomplished using three different methods: sprayed cellulose fiber, synthetic felt mats, and surface-mounted tanks.[22, 26] For vertical surfaces, sprayed cellulose fiber and surface-mounted tanks are generally used.[20, 22, 26] When treating horizontal surfaces, synthetic felt mats are more common.[22, 26]
Conductivity and Electrochemical Chloride Extraction Work by Christensen, et al., suggested that the binding of ionic species and the increase in alkalinity during the hydration process has a strong influence on the conductivity.[29] During the early stages of hydration in a chloride free cement (≤100hr.), conductivity is dominated by Na +, K+ , Ca 2+, OH-, and SO4 -2 .[29] As the hydration process continues, Christensen, et al., found that only Na +, K+, and OHcontribute significantly to the conductivity in these samples.[29] With equation 7 and using the ionic conductivity values given in table 2, Banfill calculated the transference values for a mixture containing 0.5 mol/liter sodium hydroxide and 0.5 mol/liter sodium chloride, which are given in table 3.[30] Based on these values, it was concluded that the current flow from the reinforcing steel toward the anode was composed of 72% hydroxyl ions and 28% chloride ions during electromigration.[30]
tj =
Ij I total
=
z j c jλ j
∑ z cλ
=
FW j
(7)
35.5 I total t
Where, tj Ij Itotal zj cj
= = = = =
Transference number of species j Current due to species j Total current Charge on species j Concentration of species j
?j F Wj t
5
= = = =
Ionic conductivity of j (infinite dilution) Faraday constant Mass of species j removed Time
Table 2. Ionic conductivity values [30] Positive Ions H+ Na + K+ Ca2+
Conductivity (ohm-1 cm-2 eq-1 ) 349 50.1 73.5 59.5
Negative Ions OHCl½ SO4 2½ CO3 2HCO3 -
Conductivity (ohm-1 cm-2 eq-1 ) 198 75.2 79.8 69.3 44.5
Table 3. Calculated transference values for a solution containing 0.5 mol/l NaCl and 0.5 mol/l NaOH [30] Species tNa+ tOHtCl-
Value 0.27 0.53 0.20
The calculation by Banfill assumed that for every 96,500 coulombs of charge passed, one mole or 35.5 g of chloride ions successfully migrated to the anode.[30] However, after calculating the efficiency of an early SHRP study (6.9-7.8%), Banfill concluded that other negative ions (i.e. OH- , SO4 -2 ) and resistive heat generation must account for the efficiency loss.[30, 31] Tritthart demonstrated that the concentration of hydroxyl ions in concrete increased during ECE, and suggested that during ECE the hydroxyl ion influences the rate of removal of the chloride ion.[32] This is because as hydroxyl ions are being produced at the cathode and migrating towards the anode during ECE, these ions will compete with chloride ions as charge carriers. Therefore, based on the calculations by Banfill and the results from Tritthart, it is not surprising that the efficiency of chloride removal would decrease as the treatment progressed.[30, 32] Chatterji suggested that although free chloride ions can participate in electrolysis, bound chloride ions would first require exchange with hydroxyl ions before being able to contribute to the conductivity.[15] For the exchange between bound chloride ions and hydroxyl ions to occur, Chatterji proposed that the electrolysis would require sufficient time and an elevated hydroxyl ion concentration.[15] The fact that not all of the chlorides are initially free to migrate could reduce the extraction efficiency of the process.[33] In the work by Elsener, et al., indications of a chemical equilibrium between bound and free chlorides were shown.[19] Others have supported this idea and have even included this as a factor in proposed models.[34-36] Ihekwaba, et al., suggested the following chemical equation would exist for a chloroaluminate compound, [37]
CaCl2 + 3CaO·Al2 O3 + 10H2 O ? 3CaO·CaCl2 ·Al2 O3 ·10H2 O
(8)
All these studies have led to the development of some general relationships between the various factors and ECE. Table 4 summarizes these relationships, which were determined either experimentally or through modeling. However, cracks in the concrete are not addressed in this table. This is because it was determined that the effect of small cracks (≤0.5 mm wide) did not significantly affect the current distribution.[31] Bennett, et al., suggested that even though small cracks appeared to fill with a white precipitate during ECE, it is best if damaged concrete is repaired prior to ECE.[31] In addition, Bennett, et al., indicated that variations in the depth of cover did not greatly influence the current distribution during ECE.[31]
6
Table 4. Influences of various factors on ECE Factor Increase quantity of reinforcing steel Increase the applied voltage Higher initial chloride concentrations Reinforcement mats placed directly over each other ** Increasing temperature above 35o C Multiple applications of ECE Initial chloride concentration on final chloride concentration Potentiostatic vs. galvanostatic operation Renewal of anolyte to maintain maximum concentration gradient Carbonated layer in front of chlorides being extracted ** Based on mathematical model
[31, 37-41]
Effect Increases chloride extraction rate Increases chloride extraction rate Increases chloride extraction rate Increases chloride extraction rate Increases chloride extraction rate Increases chloride extraction efficiency No influence No influence No influence Decreases chloride extraction rate
Electrochemical Chloride Extraction Projects Various studies have demonstrated ECE is a promising bridge restoration alternative to CP for chloride-contaminated concrete bridges.[8, 14, 16, 17, 20-23, 26, 42, 43] Table 5 lists the reinforced concrete structures in North America that were treated using ECE. The majority of these structures can be categorized as either bridge piers or decks. In addition, this table includes a summary of the percentage of chlorides removed from selected North American structures using ECE treatment. Unfortunately, many of these results are not reported for the same concrete depths, so a comparison between structures is impossible. However, it is clear that although the amount of chlorides removed from most of these structures was substantial, some of the chlorides remain in the structure following treatment. [3, 19] Half-cell measurements on some of these treated structures following ECE treatment indicate a low probability of corrosion. Table 6 lists the half-cell measurements that were taken on treated and untreated structures. In addition, all of the structures listed in table 6 are also cited in table 5.
7
Table 5. ECE treatment on selected North American structures [17, 21, 31, 42-55]
Location Hwy #192 Bridge Substructure, Council Bluffs, Iowa
Date 2000
Highway 11 Bridge Abutments, North Bay, Ontario
2000
Area Chloride Treated Removed (%) 1209 m2 N/A 646 m2 N/A 2
Current Efficiency (%) N/A N/A
Eastern Avenue Bridge #576 Abutments, Washington DC
2000
220 m N/A
N/A
3rd St. Viaduct, Bridge Substructure, Minot, North Dakota
1999
100 m2 N/A
N/A
St. Adolphe Bridge Deck, St. Adolphe, Manitoba
1999
2
N/A
2
14704 m N/A
S02 of 38061 Substructure, Jackson County, Michigan
1999
109 m N/A
N/A
I-480 Bridge Substructure, Omaha, Nebraska
1999
1400 m2 N/A
N/A
2
Burlington Skyway Substructure, Burlington, Ontario
1999
1533 m N/A
N/A
Hwy #192 Bridge Substructure, Council Bluffs, Iowa
1998
N/A
I-480 Bridge Substructure, Omaha, Nebraska
1998
St. Adolphe Bridge Deck, St. Adolphe, Manitoba
1998
Pembina Highway Overpass Structure, Winnipeg, Manitoba
1998
463 m2 N/A 74 (at 0-25 mm) 1525 m2 63 (at 50-75 mm) 84 (at 0-25 mm) 1115 m2 70 (at 25-51 mm) 220 m2 N/A 2
N/A N/A N/A
Industrial Spur Bridge Substructure, Peoria, Illinois
1998
462 m N/A
N/A
Starbuck Bridge Deck, Winnipeg, Manitoba
1997
270 m2 N/A
N/A
I-395 & Dunwoody Substructure, Minneapolis, Minnesota
1997
Carousel Center Parking Deck, Syracuse, New York
1997
2
N/A
2
N/A
2
225 m N/A 100 m N/A
Islington Ave. Bridge Interceptor Chambers, Toronto, Ontario
1997
180 m N/A
N/A
Burlington Skyway Substructure, Burlington, Ontario
1997
268 m2 N/A
N/A
Tulls Highway Overpass Deck, Seaford, Delaware
1997
Hwy #6 & #11 Overpass Piers, Regina, Saskatchewan
1995
5th Street & I-64 Substructure, Charlottesville, Virginia
1995
Hwy #1 & #6 Overpass Piers, Regina, Saskatchewan
1995
2
N/A
2
N/A
1550 m N/A 180 m Up to 80 27–60 (at 6-19 mm) 488 m2 13–53 (at 25-38 mm) 370 m2 N/A 2
N/A
Hwy #2 Overpass Piers, Morinville, Alberta
1995
34th Street & I-395 Bridge Deck, Arlington, Virginia
1995
Hwy #11 & #16 Overpass Piers, Saskatoon, Saskatchewan
1994
Pier Columns, SHRP, USA
1992
49 m2 N/A
1992
2
17 m N/A
12 to 19
Deck Area, SHRP, USA
1991
2
20
Portage Avenue & Rt. 90 Retaining Wall, Winnipeg, Manitoba
1991
Abutment Area, SHRP, USA
Burlington Skyway Pier, Burlington, Ontario
1989
U.S. Route No. 33 Bridge Deck (ODOT No. UNI-33.1138-R) Marysville, Ohio
1975
N/A = Not Available
8
55 m 62 -96 76–82 (at 6-19 mm) 733 m2 72–32 (at 19-32 mm) 2 150 m 62-88
9 to 12
136 m 60 (25 mm from bars) N/A 20 - 76 27 (East Face) 31 m2 59-60 (West Face) 57 (South Face) 31 in 12 hr (at 0-25 mm) 2 51 in 24 hr (at 0-25 mm) 18 m 59 in 12 hr (at 25-51 mm) 70 in 24 hr (at 25-51 mm)
N/A 11 to 15 N/A 7 to 13
N/A 11 (East) 32-33 (West) 30 (South) N/A
Table 6. Half-cell potentials on treated and untreated North American structures [43, 44, 49] ECE Date Location 1989 Burlington Skyway Pier, Burlington, Ontario
Test Date Untreated
Treated 1991 1995
Portage Avenue & Rt. 90 Underpass Retaining Wall, Winnipeg, Manitoba Hwy #6 & #11 Overpass Piers, Regina, Saskatchewan
Untreated Treated Untreated
Treated 1997
Starbuck Bridge Deck, Traffic Bearing System, Winnipeg, Manitoba
Untreated
Treated
Half Cell, mV (vs. Cu/CuSO4 ) 0% > -200 96% between -200 and -350 4% < -350 96% > -200 4% between -200 and -350 0% < -350 84% < -350 100% > -280 49% > -200 27% between -200 and -350 24% < -350 99% > -200 1% between -200 and -350 0% < -350 6% > -200 75% between -200 and -350 19% < -350 96% > -200 4% between -200 and -350 0% < -350
Effects of Electrochemical Chloride Extraction The beneficial effect of ECE on the reduction of corrosion induced concrete deterioration of a structure after the treatment is important. However, there were concerns about the structural effects of ECE, such as hydrogen evolution at the cathode, bond strength loss between the concrete and reinforcement, and ASR susceptibility around the reinforcement. Many of these issues relate to the high voltage and current densities used during extraction, which changes the chemistry around the reinforcement and redistributes ionic species, thus altering the concrete’s properties.[3, 56, 57] The generation of nascent hydrogen at the cathode is inevitable due to the high voltages used during ECE.[3, 24] If hydrogen is absorbed into the steel, it could lead to hydrogen embrittlement and reduce the fracture toughness of the steel.[15, 24] If hydrogen gas is produced, it can increase the local pressure and eventually promote cracking.[15, 24, 57] Currently, research indicates that hydrogen evolution will not adversely affect the structure, if current density levels are kept at 1 A/m2 or less.[3, 23, 25] In addition, the lower strength steels used for reinforcement are not as susceptible to hydrogen embrittlement as highstrength steel.[3, 23] It is not surprising then that ECE is currently not recommended for high-strength steels used in prestressed concrete.[3, 23] A study by Bennett, et al., suggested that porosity increased in the cement paste adjacent to the reinforcing steel.[31] Using mercury porosimetry, it was determined that a significant increase occurred in the one- to ten-micron pore range following ECE.[31] In addition, the cement adjacent to the top steel mat had undergone softening when compared with concrete extracted from deeper depths.[31] Ihekwaba, et al., noted the softening effect when the concrete was exposed to higher current densities (3 A/m2 ), but the effect was insignificant in samples exp osed to lower current densities (1 A/m2 ).[60] However, Bertolini, et al., did not observed a statistically significant change in microhardness measurements made near the reinforcing steel after exposing samples for twelve weeks to current densities that ranged from 5 mA/m2 to 5 A/m2 .[58] In addition, Bennett, et al., indicated that even at high current densities (20 A/m2 ), ECE was not detrimental to the compressive strength of the concrete.[31]
9
Broomfield discusses research that indicates that corrosion product on the surface of the reinforcing steel improves the bond strength with the concrete.[3, 25] The elimination of expansive corrosion product during ECE seems to reduce this bond strength. [3] Initially, the force required is greater for the corroded sample, but as the ECE treatment time increases, the pull out load decreases to approximately the same value as the control sample.[3] Others have shown that in addition to removing chlorides, ECE physically changes the concrete.[61, 62] However, these effects appear to be minor at the current densities commonly employed during the ECE process. Bertolini, et al., indicated that ASR could result if ECE was applied to concrete containing susceptible aggregate.[58] This was due to accumulation of alkali metal ions and hydroxyl ions near the reinforcing steel during ECE. [3, 23, 58] However, electrolytes containing lithium ions (i.e. lithium borate electrolyte) have demonstrated the ability to suppress ASR.[3, 23, 59]
Purpose Currently, the primary focus of the research has been to study how the electrical parameters of the regions between the anode and the cathode change during ECE. It was expected that this approach would provide insight into the decrease in current flow during the early stage of ECE treatment, with which improvements to the efficiency of chloride removal can be made. In addition, the influence of w/c ratio on ECE was investigated using specimens made of several w/c ratios. It was hoped that this might lead to a correlation between the w/c ratio and the time required for chloride extraction.
10
EXPERIMENTAL METHOD Specimen Design Two types of reinforced concrete specimen designs are being used during this portion of the study. Tables 7 and 8 list the basic design features of each type of specimens. These specimens included variations in the method of introducing chlorides into the concrete, cover thickness, and w/c ratios. Tables 9 and 10 list the mix designs for the Type I and II concrete specimens, respectively. After the specimens had cured, a dam was affixed to the top of each specimen to hold the appropriate solutions. The Types I blocks were kept in a controlled laboratory environment, whereas Type II blocks were exposed outside to further simulate field conditions. As illustrated in figure 4, the Type I specimens were designed with two rows of activated titanium rods embedded in the concrete above the reinforcing steel bar. Each row has four activated titanium rods aligned in a horizontal plane at 1.0 cm below the top concrete surface and 1.0 cm above the rebar. This arrangement allowed for the measurements of the IR drop and voltage differences at selected depths during an ECE experiment. A list of these points is provided in table 11. In addition, these rows of embedded titanium electrodes allowed for measurement of the changes in the concrete resistivity at the two depths, using the four-pin method (ASTM G-57). Each Type II concrete specimen contained a thermocouple, two titanium-mesh ribbon strips, and a corrosion probe embedded in the concrete, as illustrated in figure 5. The thermocouple was located 3.8 cm from the surface and horizontally centered in the sample. Each titanium mesh ribbon was 1.3 cm wide and 5.1 cm long. The two ribbons were 6.35 cm apart and located 1.0 cm below the surface. The corrosion probe was a graphite reference electrode and a 1.3-cm wide titanium counter electrode, all encased in concrete. Before casting the specimens, the probe was attached to the upper reinforcing steel mat. Table 12 lists the various contact points between which measurements can be made during ECE experiments on these specimens. Table 13 lists the differences in some of the physical characteristics of Type I and II concrete specimens being used in this study.
Table 7. Description of Type I concrete test blocks Chloride Exposure Method Admixed and Ponding
Height x Length x Width
Cover Thickness 4.4 cm
W/C 0.40
Number of Block Cast 3
Blocks Tested 3
Admixed and Ponding
9.2 cm x 12.7 cm x 30.5 cm 9.2 cm x 12.7 cm x 30.5 cm
4.4 cm
0.45
3
3
Admixed and Ponding
9.2 cm x 12.7 cm x 30.5 cm
4.4 cm
0.50
3
3
Admixed and Ponding
9.2 cm x 12.7 cm x 30.5 cm
4.4 cm
0.55
3
3
Admixed and Ponding
5.7 cm
0.40
3
2
Admixed and Ponding
10.5 cm x 12.7 cm x 30.5 cm 10.5 cm x 12.7 cm x 30.5 cm
5.7 cm
0.45
3
2
Admixed and Ponding Admixed and Ponding
10.5 cm x 12.7 cm x 30.5 cm 10.5 cm x 12.7 cm x 30.5 cm
5.7 cm 5.7 cm
0.50 0.55
3 3
2 2
Admixed and Ponding
7.0 cm
0.40
3
0
Admixed and Ponding
11.8 cm x 12.7 cm x 30.5 cm 11.8 cm x 12.7 cm x 30.5 cm
7.0 cm
0.45
3
0
Admixed and Ponding
11.8 cm x 12.7 cm x 30.5 cm
7.0 cm
0.50
3
0
Admixed and Ponding
11.8 cm x 12.7 cm x 30.5 cm
7.0 cm
0.55
3
0
11
Table 8. Description of Type II concrete test blocks Chloride Exposure Method Ponding
Cover Thickness 3.8 cm
W/C 0.45
Number of Block Cast 4
Blocks Tested 1
Ponding
Height x Length x Width 17.7 cm x 61.0 cm x 60.8 cm 17.7 cm x 61.0 cm x 60.8 cm
3.8 cm
0.50
4
1
Ponding
17.7 cm x 61.0 cm x 60.8 cm
3.8 cm
0.55
4
1
Ponding
17.7 cm x 61.0 cm x 60.8 cm
3.8 cm
0.60
4
1
Ponding
5.1 cm
0.45
4
0
Ponding
19.0 cm x 61.0 cm x 60.8 cm 19.0 cm x 61.0 cm x 60.8 cm
5.1 cm
0.50
4
0
Ponding Ponding
19.0 cm x 61.0 cm x 60.8 cm 19.0 cm x 61.0 cm x 60.8 cm
5.1 cm 5.1 cm
0.55 0.60
4 4
0 0
Ponding
6.4 cm
0.45
4
2
Ponding
20.3 cm x 61.0 cm x 60.8 cm 20.3 cm x 61.0 cm x 60.8 cm
6.4 cm
0.50
4
2
Ponding
20.3 cm x 61.0 cm x 60.8 cm
6.4 cm
0.55
4
2
Ponding
20.3 cm x 61.0 cm x 60.8 cm
6.4 cm
0.60
4
2
Table 9. Mix design for Type I concrete specimens W/C Cement (Type I/II), kg/m3 Water, kg/m3 Course Aggregate, kg/m3 Fine Aggregate, kg/m3 Cl- Added, kg/m3 Cl-, % by Wt.
0.40 377 151 898 886 5.77 0.25
0.45 377 169 898 886 5.81 0.25
0.50 377 188 898 886 5.87 0.25
0.55 377 208 898 886 5.91 0.25
0.55 301 166 1061 794 0.12 0.56
0.60 276 166 1061 815 0.08 0.52
Table 10. Mix design for Type II concrete specimens W/C Cement (Type I/II), kg/ m3 Water, kg/ m3 Course Aggregate, kg/m3 Fine Aggregate, kg/ m3 Daravair (Air Entrainment), kg/ m3 Daratard (Set Retarder) , kg/ m3
0.45 377 170 1061 719 0.20 0.75
12
0.50 331 166 1061 766 0.14 0.63
Figure 4. Illustration of a Type I Specimen
13
Table 11. Description of contact points used to make measurements in Type I concrete test blocks Region Studied Anode/Anolyte Ti Strip Anode/Upper Ti Rod Anode/Rebar Anolyte Ti Strip /Upper Ti Rod Lower Ti Rod/Rebar Upper/Lower Ti Rod
Description Measurement contact points are the anode mat and the a titanium strip located in the anolyte. Measurement contact points are the anode mat and a titanium rod located in the top row of embedded titanium rods. Measurement contact points are the anode mat and reinforcing steel mat. Measurement contact points are a titanium strip located in the anolyte and a titanium rod located in the top row of embedded titanium rods. Measurement contact points are a titanium rod located in the bottom row of embedded titanium rods and the reinforcing steel mat. Measurement contact points are a titanium rod located in the top row and a titanium rod located directly below it in the bottom row of embedded titanium rods.
Table 12. Description of contact points used to make measurements in Type II concrete test blocks Region Studied Anode/Anolyte Ti Strip Anode/Rebar Anolyte/Concrete Ti Strip Concrete Ti Strip/Rebar
Description Measurement contact points are the anode mat and a titanium strip located in the anolyte. Measurement contact points are the anode mat and reinforcing steel mat. Measurement contact points are a titanium strip located in the anolyte and a titanium strip embedded in the concrete. Measurement contact points are a titanium strip embedded in the concrete and the reinforcing steel mat.
Table 13. ECE comparison between the different specimens Description Treated Concrete Surface Area Rebar Surface Area Number of Reinforcing Mats
Type I 2
Type II
248 cm *
3716 cm2 **
130 cm2 * 1 (single bar)
4865 cm2 ** 2
* Based on the interior dam dimensions (9.5 cm X 26.1 cm) ** Based on the interior dam dimensions (60.96 cm X 60.96 cm)
14
Figure 5. Illustration of a Type II Specimen
15
Electrochemical Chloride Extraction Chlorides were extracted from the concrete specimens following the methods employed in previous ECE projects. The ECE parameters used are listed in table 14. In each experiment, a titaniummesh anode and two pieces of felt were cut to fit the inside dimensions of the dam. A piece of felt was placed on the surface of the concrete inside the dam, which was followed by the titanium-mesh anode, and finally the titanium mesh was covered by a second piece of felt. The sandwiching of the titanium mesh between the felt ensured the complete wetting of the titanium-mesh anode. The anolyte was carefully added until the solution level inside the dam completely covered the upper felt mat. Either a saturated calcium hydroxide solution or a lime and water solution were used as the anolyte during ECE. A DC power supply was set to operate in constant current mode (1 A/m2 ) until it reached the maximum voltage output, at which time it would switch from constant current to constant voltage mode. The maximum voltage setting was dependent on the power supply. For the Type II specimens the maximum voltage was 40 V. A maximum of 40 V was also applied to one Type I specimen from each of the four w/c ratios studied, all of which had a cover thickness of 1.7 cm. For all other Type I specimens, the maximum voltage was between 9 V and 15 V. The positive lead from the power supply was attached to the anode and the negative lead to the reinforcing steel mat. To minimize the evolution of chlorine during ECE, the pH was maintained above 10 by adding either calcium hydroxide or lime to the anolyte. Table 14. ECE parameters Description Anode Material Anode Contact Material
Selection Activated titanium mesh Two layers of felt: one above and one below the mesh anode Saturated calcium hydroxide or lime
Electrolyte Maximum Current Density (based on concrete surface area)
1 A/m2
Current and Voltage Measurements Current and voltage measurements were made using a Tetronix digital multimeter or an IO Tech Logbook data acquisition system. With both instruments, voltage measurements were made directly. The current was calculated using the measured voltage across a resistor of known resistance and Ohm’s law.
IR Drop Measurements The total electrochemical cell voltage is the sum of a series of contributions from individual voltage differences.[63] In simplest terms, these contributions are comprised of a thermodynamic potential difference (Ethermo ), anodic and cathodic overpotentials (ηa and ηc, respectively), and the voltage drop due to current flow through a resistive solution (IRsol ).[63-65] During ECE, the measured voltage difference (Emeas) is represented by equation 9 since the system is being driven.[64, 65] Figure 6 illustrates this relationship graphically.
E Meas = EThermo + ηa + ηc + IRSol
(9)
If the applied current is rapidly interrupted and the change in voltage is quickly recorded, the IRsol component of the total voltage can be determined, as shown in figure 7.[66] In the galvanostatic case, the solution resistance, Rsol , can be easily determined by dividing the measured voltage drop with the current.
16
Figure 6. Illustration of voltage components for a driven system
[64]
Figure 7. Change in voltage after interruption of applied current [66] As with any measurement, care must be taken to minimize errors since this could yield misleading results. Therefore, the data acquisition system used must be capable of capturing events that are as short as a few milliseconds.[66] Thompson and Payer suggested the use of an oscilloscope to capture IR-drop events.[66] Moreover, since the current value is required to calculate the solution resistance, fluctuations in the current can significantly impair calculations of the solution resistance.[66] To guarantee the current interruption were reproducible, a solid-state relay controlled by a timing circuit was used to interrupt the current. Testing confirmed the solid-state relay interrupted the current in less than 6 ns. The timing circuit then maintained the solid-state relay in an open position for 13 ms. To gather the voltage vs. time data, the IO Tech Logbook data acquisition system was used. To ensure the Logbook system would suffice, a HP 150MHz oscilloscope was used to verify that the Logbook acquisition rates were adequate. This was performed on circuits with known resistance values as well as on concrete test specimens. Following a series of successful comparisons between the two instruments, evaluations of Type I specimens began using the Logbook system. The Logbook acquisition system was set to gather data during periodic interruptions of the ECE process. Although the total current interruptions lasted for only 13 ms, data was gathered before, during, and after the interruption. This data was then used to determine changes in the IR-drop during ECE.
17
4-Pin Resistivity Measurements As discussed earlier, the Type I concrete specimens were designed with the intention of making resistivity measurements during ECE. This was performed following ASTM Standard G 57, and using a Nilsson Soil Resistance Meter, Model 400. [67] This type of meter induces an AC signal between two outer pins while the voltage drop is measured between two inner pin, which is illustrated in figure 8.[67] The output from this meter is in units of ohms (resistance), and therefore if the pins are evenly spaced and the inner pin spacing (a) is known, the resistivity (ρ) can be calculated using the following equation.[67, 68]
ρ = 2πaR
(10)
Figure 8. Four pin resistivity test method
Half-Cell Measurements Half-cell measurements were made following the guidelines set forth in ASTM Standard C 876.[69] Since these measurements were made on concrete surfaces, a damp sponge was used to ensure adequate contact between the half-cell and the concrete surface. Connectors were welded to each reinforcing steel mat, so that each piece of rebar was externally connected to each other. This ensured that the entire mat was conductive. In all cases, saturated Cu/CuSO4 electrodes (CSE) were used to make measurements against the internal reinforcing steel mat.
Collection of Concrete Samples To monitor the changes in chloride concentrations in the specimens during ECE, ground concrete samples were collected for chloride analysis from the specimens at different stages of the experiments, in accordance with AASHTO T 260. A sample collection scheme was used on the Type II specimens to minimize any possible interference that the collection of samples during the ECE experiment would impose on the current flow and voltage distribution in the specimen following the collection of concrete samples. Under this scheme, concrete samples were collected by starting on the outer perimeter of a specimen and working inward. An example of the sampling patterns used is shown in figure 9. At each time, three different points were sampled. For the blocks with a cover thickness of 6.4 cm, sampling was performed above a single bar. For the blocks with a cover thickness of 3.8 cm, sampling included the intersection of two bars, above a single bar, and where no bars were present. However, the same approach was not possible for the Type I specimen due to size constraints. In this case, the same technique for sample collection was used, but fewer samples were collected. Samples were collected before and after ECE in all cases. The sample depths were from the surface to 0.6 cm, 0.6 cm to 1.9 cm, 1.9 cm to 3.2 cm, and 3.2 cm to 4.1 cm. All of these depths were above the top reinforcing steel mat.
18
Figure 9. Type II specimen drill pattern for sample collection: Right, for a cover thickness of 6.4 cm; Left, for a cover thickness of 3.8 cm
Potentiometric Titration The acid-soluble chloride concentrations of the collected ground concrete samples were determined following AASHTO T 260. The analysis followed Method II in this standard, which uses the Gran Plot Method to determine the endpoint of the titration. A silver-ion-selective electrode was use during the titration.
X-Ray Diffraction Surface residue that formed during ECE was analyzed using x-ray diffraction (XRD). It was anticipated that XRD would help in identifying any crystalline material in the residue. To accomplish this, residue samples were scraped from the surface and ground into a fine powder for analysis. These samples were then placed into the instrument for analysis. XRD was performed using a Scintag automated diffraction system. During analysis, the applied voltage was 40 KV and the current was 35 mA. A copper target was used for the Ka x-ray source with a nickel filter to reduce undesirable components in the spectrum. The divergence and scatter slits on the source were 2 and 3, respectively. On the detector, the scattering and receiving slits were 1 and 0.5, respectively. The XRD spectrum was evaluated using the program Diffraction Management System Software, version 1.1. Background subtraction was performed using a boxcar curve fit with a filter width of 1.5 degrees. The program’s peak library software was used to compare the unknown sample against known spectra.
X-Ray Photoelectron Spectroscopy To aid in identifying the composition of the residue that formed during ECE, a Perkin Elmer 560 system adapted for x-ray photoelectron spectroscopy (XPS) was used to analyze powder samples. Unlike XRD, which yields information about the bulk material in a sample, XPS provides surface information. The XPS data would be used to provide additional insight into the elements and compounds on the surface of the residue.
19
Charging effects during XPS analysis were adjusted for by setting the adventitious carbon line to 284.8 eV. Preliminary peak comparisons were first made against values cited in the literature. After reducing the possibilities, final identification was made against a sample of reagent grade calcium chloride.
20
RESULTS AND DISCUSSION Currently, this study has involved a number of specimens to obtain the following results. ECE studies have been completed on 20 of the Type I and 12 of the Type II test blocks. These blocks included different cover depths, which ranged from 3.5 cm to 6.4 cm. To evaluate the affect of the w/c ratio on ECE, test blocks with ratios ranging from 0.40 to 0.60 were designed. Descriptions of the block designs are presented in tables 7 through 12 and illustrated in figures 4 and 5.
Changes in the Current and Voltage during ECE During ECE, the current was monitored, while internal and external voltage measurements were made. The designations in the following graphs to the different measurement points that were monitored during ECE for the Type I and Type II test blocks are listed in tables 11 and 12, respectively. Figures 4 and 5 can provide additional insight into the connections used to make measurements. The typical change in voltage during ECE for a set of Type I specimens with different w/c ratios, but the same cover depth is shown in figure 10. The benefit of these specimens was the ability to measure the voltage changes in different layers between the anode and cathode. Under constant voltage conditions, it can be seen that the voltage between the anode and the upper titanium rods increases. At the same time, the voltage between the lower titanium rods and the reinforcing steel is decreasing. In each case, the rate of change of the voltage is greatest initially, i.e., during the first 10 to 15 days, and then the rate of change decreases for the remaining extraction period. All of the specimens evaluated exhibited this type of behavior. Even with larger applied voltages, the voltage difference in the top layer of concrete increased during ECE. A typical example of this is shown for two specimens in figure 11. As the applied voltage to the slab increases under constant current conditions, the voltage across the top layer of concrete increases.
21
Voltage (V)
Voltage (V)
W/C 0.55
10 9 8 7 6 5 4 3 2 1 0 0
10
20
30
40
W/C 0.50
10 9 8 7 6 5 4 3 2 1 0
50
Anode / Rebar Anode / Upper Ti Rod Lower Ti Rod / Rebar
0
W/C 0.45
10 9 8 7 6 5 4 3 2 1 0 0
10
20
30
40
10
20
30
40
50
Elapsed Time (days)
Voltage (V)
Voltage (V)
Elapsed Time (days)
W/C 0.40
10 9 8 7 6 5 4 3 2 1 0
50
0
Elapsed Time (days)
10
20
30
40
50
Elapsed Time (days)
Figure 10. Measured voltage changes during ECE in a set of Type I specimens (Maximum voltage was 9V)
22
40
Constant Current
Anode/Rebar
35
Anolyte/Concrete Ti Strip
Voltage (V)
30 25 20 15 10 5 0 0
10
20 30 Elapsed Time (Days) Constant Current
45
40
50
Constant Voltage
Anode/Rebar
40 Anolyte/Conc rete Ti Strip
Voltage (V)
35 30 25 20 15 10 5 0 0
10
20
30
40
50
Elapsed Time (Days)
Figure 11. Comparison of the voltages measured between (1) the anode and rebar and (2) between the anolyte and the titanium strip in the concrete. Top: for a 0.55-w/c Type II specimen; Bottom: for a 0.50-w/c Type II specimen (Maximum voltage was 40V)
Influence of Concrete Surface on Voltage and Current To better understand the influence of the surface-layer concrete on the voltage and current, one of the Type I specimens was subjected to an extended ECE experiment and analysis. A timeline illustrating the sequence of events that took place in this extended experiment is shown in figure 12. First, the specimen was ECE treated or polarized for 26 days and then depolarized for 38 days. The voltage and current data for this 26-day ECE treatment are shown in figure 13a. Then, the specimen was re-energized for 12 hours. The voltage and current data for this first 12-hr polarization are shown in figure 13b. This was followed by removal and storage of the electrolyte used during the ECE test period. The surface of the concrete was then sandblasted and the stored electrolyte was poured back into the reservoir. After allowing twenty hours for the solution to soak into the concrete, ECE was initiated again for another 12 hours and
23
the same measurements were made (figure 13c). Finally, the sample was depolarize for 36 hours and then re-energized for a final 12-hour duration and a final set of measurements was made (figure 13d). Comparison of figures 13a and 13b would indicate that the voltages and current of the system at the start of the first 12-hour re-polarization were practically the same as where the system was at the end of the 26-day of polarization. Comparison of figures 13b and 13c would reveal the effect of the sandblasting the surface layer concrete on the voltages and current. It is clear that sandblasting the surface of this specimen increased the current density by over 0.3 A/m2 . This current density was even greater than the initial current density value (at the beginning of the 26-day treatment). Following sandblasting, the voltage between the anode and the reinforcing steel also switched from constant-voltage mode to constant-current mode, but then returned to a constant-voltage mode. In addition, sandblasting resulted in voltage changes within the different concrete regions, which are on the order of approximately 2 V. This indicates that the surface of the concrete appears to have a significant influence on the voltage and current during ECE. However, additional testing on other specimens will be required to confirm these observations.
Figure 12. Timeline of concrete surface study Figure 13. Influence of concrete exterior surface on the voltage and current in a 0.45-w/c Type I specimen
24
25
Changes in the Concrete Resistance During ECE The resistance between different points in the concrete was determined using the IR Drop technique, which was discussed in the earlier section “IR Drop Measurements” on page sixteen. During ECE, the resistance was observed to increase in the region between the anode and the upper layer of titanium rods, as shown in figure 14. In contrast, the solution (concrete) resistance decreased in all other regions during ECE. A comparison, based on w/c ratios, of the resistance between the anode and the upper titanium rods did not indicate an obvious relationship. This pattern was consistent in all of the samples studied. W/C 0.55
800
800
700
700
600 500 400 300
Anode/Upper Ti Rod Upper/Lower Ti Rod
600
Lower Ti Rod/Rebar
500 400 300
200
200
100
100 0
0 0
10 20 Time (Days)
0
30
10
20
30
Time (Days)
W/C 0.45
900
W/C 0.40
900
800
800
700
700 Resistance (Ohms)
Resistance (Ohms)
W/C 0.50
900
Resistance (Ohms)
Resistance (Ohms)
900
600 500 400 300 200
600 500 400 300 200 100
100
0
0 0
10
20
30
0
10
20
30
Time (Days)
Time (Days)
Figure 14. Example showing the change in resistances for a single set of Type I specimens during ECE
Resistivity It was apparent that, immediately before ECE, the resistivity of the top layer of concrete, as measured by the upper row of four titanium rods, was less than that of the lower concrete that surrounded the lower set of four titanium rods, as shown in figure 15. This difference was observed in the other specimens prior to ECE. It is also apparent in figure 15 that the resistivity of the lower region of the concrete undergoes only a relatively slight to moderate change during ECE. In contrast, the resistivity of the top layer of concrete increased and exceeded that of the lower concrete and then remained at a level that is greater than that of the lower concrete region. However, a clear relationship between w/c ratio and
26
W/C 0.55
35000
Resistivity (ohm-cm)
Resistivity (ohm-cm)
resistivity for either the upper or lower titanium rod region was not evident. This is shown in figures 16 and 17, respectively.
30000 25000 20000 15000 10000 5000
W/C 0.50
35000
Upper Ti Rod
30000 25000
Lower Ti Rod
20000 15000 10000 5000
0
0 0
10
20
30
0
Elapsed Time (Days)
30
W/C 0.40
35000 Resistivity (ohm-cm)
Resistivity (ohm-cm)
20
Elapsed Time (Days)
W/C 0.45
35000
10
30000 25000 20000 15000 10000 5000
30000 25000 20000 15000 10000
0
5000 0
0
10
20
30
0
Elapsed Time (Days)
10
20
30
Elapsed Time (Days)
Figure 15. Change in Resistivity for Type I specimens of various w/c ratios (cover thickness of 4.4 cm)
Resistivity (ohm-cm)
35000.0
w/c 0.55
30000.0
w/c 0.50
25000.0
w/c 0.45
20000.0
w/c 0.40
15000.0 10000.0 5000.0 0.0 0
5
10
15
20
25
30
Elapsed Time (Days)
Figure 16. Resistivity change in the upper layer of concrete, for Type I Specimens with various w/c ratios (cover thickness of 4.4 cm)
27
35000.0
w/c 0.55
Resistivity (ohm-cm)
30000.0
w/c 0.50
25000.0
w/c 0.45
20000.0
w/c 0.40
15000.0 10000.0 5000.0 0.0 0
5
10
15
20
25
30
Elapsed Time (Days)
Figure 17. Resistivity change in the lower layer of concrete, for Type I Specimens with various w/c ratios (cover thickness of 4.4 cm)
Chloride Concentration in Concrete with ECE The previous data have shown that the concrete specimens studied behaved in a stratified manner during ECE. Generally, the resistivity in the upper layers of concrete increased while that at the lower layers decreased. Upon determining the chloride concentration before and after ECE in Type I specimens, it is evident that a large change in chloride concentration occurs near the surface adjacent to the anode, which is shown in figures 18 and 19. (The negative values in figures 18 and 19 indicate a decrease in chloride concentration; conversely, positive values signify an increase in chloride concentration.) It is apparent that significant removal of chlorides during ECE are occurring in the concrete layer near the anode. In contrast, the treated Type II specimens exhibited a more even removal distribution at deeper depths in the concrete, which is shown in figures 20 and 21. Unlike the Type II specimens, the Type I specimens exhibited a decrease in chloride removal at deeper depths within the concrete and some specimens even display an increase in chloride concentration near the reinforcing steel. This is attributed to two factors: (1) the use of admixed chlorides in the Type I specimens and (2) the difference in the steel surface area in the different specimen types (table 13). It is possible that the admixed chlorides below the bar were drawn upward during ECE. In addition, these results support earlier studies that indicate the importance of available cathode area. The decreased cathode surface area in the Type I specimens appears to decrease the total current flow, which decreased the percentage of chloride removed. In the Type I specimens, 0% - 52% of the chlorides were removed during treatment, whereas 33% - 76% of the chlorides were removed from the Type II specimens. Cover thickness appears to influence the quantity of chloride removed. However, additional samples must be evaluated to provide statistical validity to the observed trend.
28
20.00 Overall Average
10.00
Change in [Cl-] (wt.%)
0.00 Depth: 0.0 to 0.64 cm
-10.00 -20.00
Depth: 0.6 cm to 4.1 cm
-30.00 -40.00
Depth: 4.1 cm to Rebar
-50.00 -60.00 -70.00 w/c 0.40
w/c 0.45
w/c 0.50
w/c 0.55
Figure 18. Average change in chloride concentrations due to ECE in Type I specimens with 4.4 cm of concrete cover over rebar
60.00 Overall Average
Change in [Cl-] (wt.%)
40.00 20.00
Depth: 0.0 to 0.64 cm
0.00 -20.00
Depth: 0.6 cm to 4.1 cm
-40.00 -60.00
Depth: 4.1 cm to Rebar
-80.00 -100.00 w/c 0.40
w/c 0.45
w/c 0.50
w/c 0.55
Figure 19. Average change in chloride concentrations due to ECE in Type I specimens with 5.7 cm of concrete cover over rebar
29
0.00 Overall Average
-10.00
Change in [Cl-] (wt. %)
-20.00 Depth: 0.0 to 0.64 cm
-30.00 -40.00
Depth: 0.6 cm to 4.1 cm
-50.00 -60.00
Depth: 4.1 cm to Rebar
-70.00 -80.00 -90.00 w/c 0.45
w/c 0.50
w/c 0.55
w/c 0.60
Figure 20. Change in chloride concentrations due to ECE in a single set of Type II specimens with 3.8 cm of concrete cover over rebar 20.00 Overall Average
10.00
Change in [Cl-] (wt. %)
0.00 Depth: 0.0 to 0.64 cm
-10.00 -20.00
Depth: 0.6 cm to 4.1 cm
-30.00 -40.00
Depth: 4.1 cm to Rebar
-50.00 -60.00 w/c 0.45
w/c 0.50
w/c 0.55
w/c 0.60
Figure 21. Average change in chloride concentrations due to ECE in Type II specimens with 6.4 cm of concrete cover over rebar
30
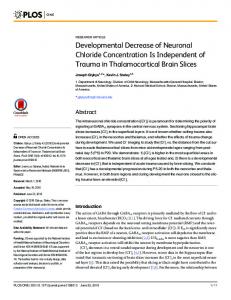
Visual Observations After completing ECE, each specimen’s surface was examined for physical changes. In each case, a tightly adhering substance had formed on the surface. Images of this formation are shown in figure 22. Attempts to remove the unknown material from the surface proved difficult. Upon trying to cleave it, a portion of the concrete was dislodging in addition to the unknown material. This provided a cross section of the interface, which is shown in figure 23. A surface formation following treatment has been found on actual treated bridge decks.[70] As shown in figure 24, the formation parallels the reinforcing steel mat below. It is evident from these photographs that the surface formation creates perpendicular lines that crisscross the older concrete, as well as the recently repaired concrete (areas covered with more white material than their surrounding). Surface formation samples were collected and are currently being analyzed.
Figure 22. Tightly adhering layer of white material formed on the concrete surface during ECE
Figure 23. Various views of surface layer that formed on the concrete during ECE: (Left) top view, (Middle) edge views, (Right) bottom view
Figure 24. Layer of white material formed on the concrete surface directly above the reinforcing steel following ECE on an actual bridge deck [70] The increased current flow because of sandblasting the concrete surface, which removed the residue, was discussed earlier. That particular specimen is shown in figure 25. It is interesting to note that
31
white deposits formed in the exposed pores, which is shown in the bottom photograph in figure 25. As indicated earlier, the study of new samples (shown in figure 27) will add statistical validity to the observed improvement in current flow following sandblasting. It is expected that removal of the tightly adherent surface formation will improve the ECE process.
Figure 25. Type I specimen surface appearance: (Top) after ECE but prior to sandblasting, (Middle) after sandblasting but prior to second application of ECE, (Bottom) following a second application of ECE for 12 hours
32
Surface Deposit Analysis To identify the white material covering the concrete surface following ECE, which is shown in figures 22 and 23, XRD was performed on two different Type II specimens. Calcium carbonate was clearly identified by XRD to be present in both specimens. Figure 26 is an overlay of a calcium carbonate spectrum over the top of the spectrum for one of the unknown samples. It is apparent that all of the peaks locations in the standard match the peaks locations in the unknown sample. However, the intensities differed, which indicates additional crystalline materials are most likely present in minute amounts in the sample. In addition, not all of the peaks in the unknown sample diffraction pattern are accounted for by the calcium carbonate standard. Based on these observations, calcium carbonate appeared to be the major component in the white residue; however, the presence of other components in trace quantities is evident. The XRD spectrum from the other sample analyzed d isplayed the same characteristics as those found in the sample shown in figure 26. Table 15 lists the intensities and peak positions for the two samples examined. XPS was also performed on the white material deposited on one Type I specimen and one Type II specimen. The Type I specimen used calcium hydroxide as the electrolyte, whereas industrial lime was used as the electrolyte for the Type II specimen. The XPS data indicated that calcium chloride was present on the surface of both samples. In addition, XPS detected magnesium in the sample exposed to a solution of industrial lime, but magnesium was not present in the sample that used reagent grade calcium hydroxide as the electrolyte. Work is underway to evaluate the significance of these finding through ongoing analysis on additional samples. Table 16 lists the elements and binding energies for the two samples examined.
Figure 26. Surface deposit XRD pattern from a Type II specimen comparing the unknown materia l to calcium carbonate
33
Table 15. Surface deposit peak data using x-ray diffraction Unknown #1 Surface Deposit 2?, Deg Intensity, CPS 13.080 61.000 13.320 54.000 14.040 56.000 14.340 84.000 14.500 56.000 14.800 59.000 15.120 63.000 15.369 63.467 15.760 56.000 15.880 63.000 16.160 56.000 16.340 54.000 16.760 69.000 17.120 71.000 17.340 48.000 17.660 52.000 18.061 59.950 18.700 56.000 19.520 63.000 20.180 59.000 20.900 60.000 23.119 162.533 29.461 2347.350 29.980 49.000 30.400 53.000 31.500 91.000 31.620 56.000 31.920 74.000 32.160 46.000 32.700 64.000 35.993 266.550 36.300 70.000 39.458 553.950 39.700 79.000 43.201 415.500 47.190 190.050 47.555 498.533 47.900 54.000 48.557 614.350 56.627 126.150 57.446 248.483 60.708 180.717 61.051 132.933 61.412 70.233 64.699 162.000 65.644 77.183 70.320 56.000 72.960 93.000
34
Unknown #2 Surface Deposit 2?, Deg Intensity, CPS 12.380 78.333 12.980 95.000
13.220 13.320 13.580 13.660
88.333 71.667 88.333 131.667
13.849 14.140 14.300 14.460 14.680 15.040 15.240 15.460 15.800 16.160 16.460 16.620 17.120 17.440 17.620 17.820 18.145 18.320 18.740 19.380 19.680 20.280 21.620 23.160 27.440 28.020 29.020 29.393 29.690 30.460 30.620 31.500 31.560 32.520 33.020 33.560 34.040 34.186 34.300 36.051 39.471 43.226 47.228 47.585 48.585 56.624 57.436 60.739 61.480 64.714 65.718
81.167 128.333 103.333 80.000 76.667 80.000 68.333 56.667 116.667 56.667 113.333 76.667 75.000 93.333 61.667 106.667 213.700 126.667 75.000 61.667 75.000 80.000 65.000 188.333 51.667 80.000 60.000 2408.000 95.000 63.333 88.333 83.333 103.333 51.667 86.667 53.333 55.000 81.850 93.333 251.367 405.367 448.333 202.267 467.133 488.733 58.000 178.167 137.117 50.000 120.733 80.733
Table 16. Surface deposit peak data using x-ray photoelectron spectroscopy Unknown #1, Ca(OH)2 electrolyte Element Binding Energy, (Photoelectron Line) eV C (1s) 285.9 Ca (2p 3/2) 348.6 Cl (2p 3/2) 199.1 O (1s) 533.2 Mg (2p 3/2) None Present Si (2p) 102.7
35
Unknown #2, Industrial lime electrolyte Element Binding Energy, (Photoelectron Line) eV C (1s) 286.3 Ca (2p 3/2) 349.0 Cl (2p 3/2) 199.1 O (1s) 533.4 Mg (2p 3/2) 51.0 Si (2p) 102.9
36
CONCLUSIONS AND FUTURE WORK Conclusions •
A clear relationship between w/c ratio and chloride extraction rate was not observed.
•
Sandblasting the concrete surface after applying ECE increases the current density at equivalent operating voltages, thus increasing the efficiency of the ECE p rocess.
•
The decrease in current flow that occurs typically during the early stage of an ECE is attributable to a significant increase in the electrical resistivity of the surface layer of concrete.
•
Preliminary analyses indicate that the resistivity increase is related to the formation of residue on the concrete surface and pores. Analyses of the residue reveal that it contains calcium carbonate, calcium chloride, and other yet unidentified minor components.
Future Work Future research will begin to focus on two regions, (1) the anolyte/concrete interface and (2) the concrete/steel interface. In addition, the effects of sandblasting and various electrolytes on current efficiency will be investigated. Testing will include previously used nondestructive techniques as well as the destructive evaluation of samples. The rational for destructive evaluation is to ascertain a clearer understanding of changes within the concrete and at the concrete/steel interface. Currently, pH, XRD, and XPS measurements, as well as visual inspection are being planned for the interior portions of the concrete. The upcoming testing will be performed on existing specimens as well as on new specimens with a different design. It is anticipated that by combining favorable features from prior specimens, this improved specimen design will provide additional insight into the changes occurring within the concrete during ECE. These specimens will contain the monitoring devices used in the Type I specimens, but the cathode area will be increased. This will be achieved by not only increasing the amount of steel in a single layer, but the number of layers will also be increased. In addition, some of the samples will include embedded pH electrodes to evaluate changes in alkalinity during ECE. An illustration of the proposed Type III specimen is shown in figure 27. Furthermore, to provide a baseline for this study, some of the new specimens will not contain chlorides. Modeling the expected beneficial life of a treated structure will begin during the upcoming research period. This will be done using specimens that were treated during the extraction portion of this study. In addition, the possibility of evaluating previously treated structures is being explored.
37
Figure 27. Proposed Type III specimen
38
REFERENCES 1. 2. 3. 4.
5.
6. 7.
8.
9.
10.
11.
12.
13.
14.
15. 16.
Li, L., Sagues, A. A., Metallurgical Effects on Chloride Ion Corrosion Threshold of Steel in Concrete. 2001, University of Florida: Tampa. p. 119. Hausmann, D.A., Steel Corrosion in Concrete: How Does It Occur. Materials Performance, 1967. 6(19): p. 19-23. Broomfield, J., Corrosion of Steel in Concrete: Understanding, Investigation, and Repair. 1 ed. 1997: E&FN Spon. Daily, S.F., and Kendell, K., Cathodic Protection of New Reinforced Concrete Structures in Aggressive Environments. Materials Performance, 1998. 37(10): p. 19-25. Kaushik, S.K., and Islam, S., Suitability of Sea Water for Mixing Structural Concrete Exposed to a Marine Environment. Cement & Concrete Composites, 1995. 17: p. 177-185. Pettersson, K., Chloride Threshold Value and the Corrosion Rate in Reinforced Concrete. Swedish Cement and Concrete Research Institute, 1992. Page, C.L., Short, N. R., and Holden, W. R., The Influence of Different Cements on Chloride-Induced Corrosion of Reinforcing Steel. Cement and Concrete Research, 1986. 16(1): p. 79-86. Odden, L., The Repassivation Effect of Electro-Chemical Realkalisation and Chloride Extraction. In International conference -- 1994 Jul : Sheffield. 1994. Sheffield: Sheffield Academic Press; 1994. Rasheeduzzafar, H., S. E., and Al-Saadoun, S. S., Effect of Cement Composition on Chloride Binding and Corrosion of Reinforcing Steel in Concrete. Cement and Concrete Research, 1991. 21(5): p. 777-794. Suryavanshi, A.K., Scantlebury, J. D., Lyon, S. B., and Nedwell, P. J., Pore Solution Analysis of Normal Portland Cement and Sulphate Resistant Portland Cement Mortars and Their Influence on Corrosion Behaviour of Embedded Steel. p. 482-490. Diamond, S., Chloride Concentrations in Concrete Pore Solutions Resulting from Calcium and Sodium Chloride Admixtures. Cement, Concrete, and Aggregates, 1986. 8(2): p. 97-102. Andrade, C., and Page, C. L., Pore Solution Chemistry and Corrosion in Hydrated Cement Systems Containing Chloride Salts: A Study of Cation Specific Effects. Br. Corros. J., 1986. 21(1): p. 49-53. Morrison, G.L., Virmani, Y. P., Stratton, F.W., and Gilliiland, W. J., Chloride Removal and Monomer Impregnation of Bridge Deck Concrete. 1976, Kansas Department of Transportation: Topeka. Bennett, J., Thomas, J. S., Evaluation of NORCURE Process for Electrochemical Chloride Removal from Steel-Reinforced Concrete Bridge Components. 1993, National Academy of Sciences: Washington, D.C. Chatterji, S., Simultaneous Chloride Removal and Realkalinization of Old Concrete Structures. Cement and Concrete Research, 1994. 24(6): p. 1051-1054. Elsener, B., and Böhni, H., Electrochemical Chloride Removal Field Test. p. 1451-1462. In International conference -- 1994 Jul : Sheffield. 1994. Sheffield: Sheffield Academic Press; 1994.
39
17.
18. 19.
20. 21.
22.
23.
24.
25. 26. 27. 28.
29.
30.
31.
32.
Clemeña, G.G., and Jackson, D. R. Pilot Applications of Electrochemical Chloride Extraction on Concrete Bridge Decks in Virginia. In Paper submission to the Transportation Research Board, 76th Annual Meeting. 1997. Washington, D.C. Electrolytic Restoration of Concrete, In US Patent & Trademark Office. 2000. Elsener, B., Molina, M., and Böhni, H., The Electrochemical Removal of Chlorides from Reinforcing Concrete. Corrosion Science, 1993. 35(5-8): p. 15631570. Removing Chloride Ions from Reinforced Concrete. Concrete Repair Digest, 1993: p. 11-14. Manning, D.G., Pianca, F., Electrochemical Removal of Chloride Ions from Reinforced Concrete: Initial Evaluation of the Pier S19 Field Trial. 1990, The Research and Development Branch, Ontario Ministry of Transportation: Ontario, Canada. Whitmore, D.W., Electrochemical Treatment of Concrete: A new Approach to Extend the Service Life of Chloride Contaminated, Carbonated, or Alkali Silica Reactive Concrete Structures. 1998. Velivasakis, E.E., Henriksen, S. K., and Whitmore, D. W., Halting Corrosion by Chloride Extraction and Realkalization. Concrete International, 1997. 19(12): p. 39-45. Elsener, B., Zimmermann, L., and Böhni, H. Repair of Reinforced Concrete Structures by Electrochemical Techniques - Field Experience. In International Conference on Corrosion and Rehabilitation of Reinforced Concrete Structures. Hudson, D., Current Development and Related Techniques, In Cathodic Protection of Steel in Concrete. 1998, E & FN Spon: New York, NY. McGovern, M.S., Current' Technologies Curb Rebar Corrosion. Concrete Repair Digest, 1996 (August). Mehta, P.K., Concrete Structure, Properties, and Materials. 1986, Englewood Cliffs, New Jersey: Prentice-Hall. Asaro, M.F., Gaynor, A. T., and Hettiarachchi, S., Electrochemical Chloride Removal and Protection of Concrete Bridge Components (Injection of Synergistic Corrosion Inhibitors). 1990, National Academy of Sciences: Washington, D.C. Christensen, B.J., Jennings, H. M., and Mason, T. O., Influence of Silica Fume on the Early Hydration of Portland Cements Using Impedance Spectroscopy. Journal of the American Ceramic Society, 1992. 72(4): p. 2789-2804. Banfill, P.F. Features of the Mechanism of Re -Alkalisation and Desalination Treatments for Reinforced Concrete. In Proc. Int. Conf. Corrosion and Corrosion Protection of Steel in Concrete. 1994. University of Sheffield, UK. Bennett, J., Schue, T. J., Clear, K. C., Lankard, D. L., Hartt, W. H., and Swiat, W. J., Electrochemical Chloride Removal and Protection of Concrete Bridge Components: Laboratory Studies. 1993, Strategic Highway Research Program, National Research Council: Washington, D.C. Tritthart, J. Electrochemical Chloride Removal - A Case Study and Laboratory Tests. In Fourth International Symposium on Corrosion of Reinforcement in Concrete Construction. 1996. Cambridge, United Kingdom: The Royal Society of Chemistry.
40
33.
34.
35.
36.
37.
38.
39.
40.
41.
42. 43.
44. 45.
46. 47. 48. 49.
Hope, B.B., Ihekwaba, N. M., and Hansson, C. M., Influence of Multiple Rebar Mats on Electrochemical Removal of Chloride from Concrete. Material Science Forum, 1995. 192-194: p. 883-890. Hassanein, A.M., Glass, G. K., and Buenfeld, N. R., A Mathematical Model for Electrochemical Removal of Chloride from Concrete Structures. Corrosion, 1998. 54(4): p. 323-332. Yu, S.W., and Page, C. L., Computer simulation of ionic migration during electrochemical chloride extraction from hardened concrete. British Corrosion Journal, 1996. 31(1): p. 73-75. Hassanein, A.M., Glass, G. K., and Buenfeld, N. R., Chloride Removal by Intermittent Cathodic Protection Applied to Reinforced Concrete in the Tidal Zone. Corrosion, 1999. 55(9): p. 840-850. Ihekwaba, N.M., Hope, B. B., and Hansson, C. M., Structural Shape Effect on Rehabilitation of Vertical Concrete Structures by ECE Technique. Cement and Concrete Research, 1996. 26(1): p. 165-175. Hansson, I.L., and Hanson, C. M., Electrochemical Extraction of Chlorides from Concrete Part 1 - A Qualitative Model of the Process. Cement and Concrete Research, 1993. 23(5): p. 1141-1152. Ihekwaba, N.M., Hope, B. B., and Hansson, C. M., Carbonation and Electrochemical Chloride Extraction from Concrete. Cement and Concrete Research, 1996. 26(7): p. 1095-1107. Arya, C., Sa'id-Shawqi, Q., and Vassie, P. R., Factors Influencing Electrochemical Removal of Chloride from Concrete. Cement and Concrete Research, 1996. 26(6): p. 851-860. Castellote, M., Andrade, C., and Alonso, C., Electrochemical Chloride Extraction: Influence of Testing Conditions and Mathematical Modeling. Advances in Cement Research, 1999. 11(2). Slater, J.E., Lankard, D. R., and Moreland, P. J., Electrochemical Removal of Chlorides from Concrete Bridge Decks. Materials Performance, 1976: p. 21-26. Whitmore, D.W. Electrochemical Chloride Extraction: Extending the Service Life of Chloride Contaminated Concrete Bridges. In International Conference on Corrosion and Rehabilitation of Reinforced Concrete Structures. 1998. Orlando, Florida. Norcure Project Reference List. 2002, Norcure. http:www.norcure.com/refer.htm. Alberta NORCURE Electrochemical Chloride Removal Project Alberta Transportation and Utilities Highway #2 and Grandin Avenue Overpass, Morinville. 2000, Norcure. http:www.norcure.com/alberta.htm. Bridge Deck Chloride Extraction St. Adolphe, Manitoba. 2000, Norcure. http:www.norcure.com/StAdolph.htm. Substructure Chloride Extraction Council Bluffs, Iowa. 2000, Norcure. http:www.norcure.com/CouncilBluffs.htm. Chloride Extraction of Omaha Substructure. 2000, Norcure. http:www.norcure.com/Omaha'98.htm. Chloride Extraction by Traffic Bearing System on Starbuck. 2000, Norcure. http:www.norcure.com/Starbuck97.htm.
41
50. 51.
52.
53.
54.
55.
56.
57. 58.
59. 60.
61.
62.
63. 64. 65.
Chloride Extraction Field Trial on Burlington Skyway. 2000, Norcure. http:www.norcure.com/Burlington89.htm. Saskatchewan NORCURE Electrochemical Chloride Removal Project Saskatchewan Highways and Transportation Bridge Substructure Highways #11 & 16, Saskatoon, SK. 2000, Norcure. http:www.norcure.com/sask.htm. Regina North NORCURE Electrochemical Chloride Removal Project Saskatchewan Highways and Transportation Bridge Substructure Highways #11 & 6, Regina, SK. 2000, Norcure. http:www.norcure.com/regina.htm. Arlington NORCURE Electrochemical Chloride Removal Project Virginia Department of Transportation/Virginia Transportation Research Council 34th Street over I-395 Bridge Deck, Arlington, VA. 2000, Norcure. http:www.norcure.com/arling.htm. Clemeña, G.G., and Jackson, D. R., Trial Application of Electrochemical Chloride Extraction on Concrete Bridge Components in Virginia. 2000, Virginia Transportation Research Council: Charlottesville. Bennett, J.E., Fong, K.F., and Schue, T.J., Electrochemical Chloride Removal and Protection of Concrete Bridge Components. 1993, Strategic Highway Research Program, National Research Council: Washington, D. C. Enevoldsen, J.N., Hansson, C. M., and Hope, B. B., Binding of Chloride in Mortar Containing Admixed or Penetrated Chlorides. Cement and Concrete Research, 1994. 24(8): p. 1523-1533. Whiting, D., In Situ Measurement of the Permeability of Concrete to Chloride Ions. American Concrete Institute, Special Publications, SP 82-25. Bertolini, L., Yu, S. W., and Page, C. L., Effects of Electrochemical Chloride Extraction on Chemical and Mechanical Properties of Hydrated Cement Paste. 1996. 8(31): p. 93-100. Altria, K.D., and Campi, F., Another 10 Ways to Spoil a CE Separation. LC GC, 1999. 17(9): p. 828-832. Ihekwaba, N.M., and Hope, B. B., Mechanical Properties of Anodic and Cathodic Regions of ECE Treated Concrete. Cement and Concrete Research, 1996. 26(5): p. 771-780. Andrade, C., Castellote, M., Sarria, J., Alonso, C., and Menedez, E. Effect of Electrochemical Rehabilitation Techniques in the Porous Microstructure of Concrete. In International Conference on Corrosion and Rehabilitation of Reinforced Concrete Structures. 1998. Marcotte, T.D., Hansson, C. M., and Hope, B. B., The Effect of the Electrochemical Chloride Extraction Treatment on Steel-Reinforced Mortar Part 2: Microstrucural Characterization. Cement and Concrete Research, 1999. 29: p. 1561-1568. Gileadi, E., Electrode Kinetics for Chemists, Engineers, and Materials Scientists. 1993, New York: Wiley-VCH, Inc. Scully, J., Lecture by Prof. John Scully, University of Virginia, Material Science and Engineering 771. 1999: Charlottesville, VA. Jones, D.A., Principles & Prevention of Corrosion. 2 ed. 1996, New Jersey: Prentice Hall.
42
66. 67.
68. 69.
70.
Thompson, N.G., and Payer, J. H., DC Electrochemical Test Methods. 1 ed. 1998, Houston, Texas: NACE International,. Standard Test Method for Field Measurement of Soil Resistivity Using the Wenner Four-Electrode Method: G57-95a, In Annual Book of ASTM Standards Construction, ASTM: Philadelphia, PA. p. 214-218. Bungey, J.H., and Millard, S. G., Testing of Concrete Structures. 3 ed. 1996, New York: Blackie Academic & Professional. Standard Test Method for Half-Cell Potentials of Uncoated Reinforcing Steel in Concrete: C876-91, In Annual Book of ASTM Standards - Construction, ASTM: Philadelphia, PA. p. 9-14. Clemeña, G.G., Virginia Transpotation Research Council. 1996, Unpublished Photographs: Charlottesville, Virginia.
43