Chapter 13
Electrochemical Detection of Mercury Removal from Polluted Bentonite and Quartz using Different Removing Agents I. Robles, Luis A. Godínez, J. Manríquez, F. Rodríguez, A. Rodríguez and E. Bustos Additional information is available at the end of the chapter http://dx.doi.org/10.5772/57446
1. Introduction Heavy metals (also known as the trace metals) are a large group of elements which are industrially and biologically important; in consequence they are defined as the group of elements with an atomic density greater than 6 g cm-3. Some of these heavy metals are toxic to living organisms in high concentrations. Heavy metals of greatest concern in terms of human health, agriculture and ecotoxicology are arsenic (As), cadmium (Cd), mercury (Hg), lead (Pb), tallium (Tl), and uranium (U). However, some other heavy metals, such as cobalt (Co), chrome (Cr), manganese (Mn), and zinc (Zn), are necessary for the healthy growth of plants and / or animals but only in small concentrations. In addition, deficiencies of "essential" trace elements or heavy metals (often called "micronutrients") have limited agricultural productivity in many parts of the world, which include the lack of Zn, Cu and Mn in crops and Co, Mn, Cu and Zn in livestock (Alloway, 1990). Mercury (Hg) has a high surface tension, meaning it easily forms small, compact, spherical drops. Although mercury droplets are stable compared to those of other metals, they can evaporate at high vapor pressures. High mercury concentration in the environment can be dangerous and increases as elemental mercury evaporates and enters the atmosphere. In addition, high concentrations of indoor mercury may pose an inhalation risk. Mercury, which is commonly found in the earth’s crust as salts such as mercuric sulfide, is released into the environment by volcanic eruptions. In addition to volcanic eruptions, erosion of rocks and soils can also release mercury. Anthropogenic sources of mercury include mercury produced as a by-product of the mining and refinement of others metals like copper, gold, lead
© 2014 The Author(s). Licensee InTech. This chapter is distributed under the terms of the Creative Commons Attribution License (http://creativecommons.org/licenses/by/3.0), which permits unrestricted use, distribution, and reproduction in any medium, provided the original work is properly cited.
380
Environmental Risk Assessment of Soil Contamination
and zinc. Mercury can also be released through recycling operations and is sometimes obtained from natural gas or other fossil fuels. Approximately a third of the mercury circulating in the environment is produced naturally, while the remaining two-thirds are from industrial activity or other human activities. Due to the increase in industrial activity, the quantity of mercury circulating in the environment (atmosphere, soils, lakes, streams and oceans) has increased two to fourfold since the beginning of the industrial era. As a result, mercury levels in our environment are dangerously high. Most of the mercury in the environment, released from both natural and anthropogenic sources, is elemental mercury (Hg0), including 99% of total atmospheric mercury. However, biogeochem‐ ical transformations of mercury can create Hg1+ and Hg2+. Most inorganic mercury com‐ pounds (Hg1+) are mildly water soluble and can be found in soils and sediments. In contrast, inorganic Hg2+ compounds vary depending on the local chemical atmosphere. Hg2+ has a short atmospheric lifetime (minutes) and is quickly removed through deposition due to its high surface activity and water solubility. Soil microorganisms oxidize mercury to its 2+ form (Leopold et al, 2010; Godarzi et al, 2012; Slowey et al, 2005; Mikac, 1999, Shi et al, 2005). For the determination of metal in low concentrations a number of techniques can be applied (Table 1), in particular colorimetry and atomic absorption spectrometry. Colorimetric deter‐ minations do not need expensive instrumentation, but there are some disadvantages such as the need for destruction of the organic material and a separation step to avoid metallic interferences. Atomic absorption is very useful for the sensitive detection and quantitative determination of many metals, especially when using the flameless technique, but the instrumental requirements are rather expensive, another disadvantage of this techniques is that they require pretreatment of the sample differs often from metal to metal so that they do not lend themselves for systematic analyses in which it is not known which metal (s) may, or not be presented (Bodle et al, 1980; Bigham, 1990; Sarzaniniet al, 1994). Techniques for total mercury determination include hydride generation atomic absorption (Chapple, 1990) and cold vapor atomic absorption (US-EPA Method 7471). For a general determination of mercury species, high-performance liquid chromatography with inductively coupled plasma mass spectrometry can be used (Fodör, 2000, 2005, 2007; Franke and Zeeuw, 1976). In consequence, there is a need for the relatively simple and rapid analytical procedure capable to carry out systematic screening for heavy metals (Franke and Zeeuw, 1976). Some electrochemical techniques can determine all the different mercury species and oxidation states. Electrochemistry provides analytical techniques characterized by instrumental simplicity, moderate cost and portability. Some as stripping methods use a variety of electrochemical procedures which all share a characteristic initial stage. First, the analyte is deposited on an electrode, usually starting from a stirring solution. After an exact period of time, electrolysis is interrupted, stirring is stopped and the quantity of analyte deposited is measured using voltammetric procedures. During the second stage of the analysis, the analyte is redissolved or liberated from electrode (Woolever et al, 2001).
Electrochemical Detection of Mercury Removal from Polluted Bentonite and Quartz using Different Removing Agents http://dx.doi.org/10.5772/57446
Technique
Hg / ng mL-1
X – rayFluorescense.
10
Neutron Activation.
2
Gold Film.
0.5
Differential Pulse Voltammetry.
0.04
Cold Vapour Atomic Absorption (CVAAS).
0.01
Cold Vapour Atomic Fluorescense (CVAFS).
0.0001
Inductively Coupled Plasma – Mass Spectrometry (ICP – MS).
0.001
Inductively Coupled Plasma – Atomic Emission Spectrometry (ICP – AES).
50
Table 1. Analytical techniques to determine mercury.
In Anodic Stripping Voltammetry (ASV, Figure 1), the electrode behaves as a cathode during deposition and as an anode during redissolution, where it is oxidized by the analyte again and returns to its original form (Skoog, 1997; Dogan-Topal et al, 2010; Pineda et al, 2009; Anguiano et al, 2012; Bustos, 2012). ASV has been used to detection of trace metals ions in solution at ~10-11 M (or sub-ppb) concentrations have been reported (Hubert, 2001). This technique is advantageous to other analytical techniques is its simplicity of use, low cost of instrumentation, and being monodestructive (Wooleveret al, 2001).
Figure 1. Potential sequence used as perturbation in an ASV experiment.
As shown in Figure 1, there are three sequential steps in a typical ASV experiment: deposition or preconcentration, quiet time and linear stripping. During the deposition step, the electro‐
381
382
Environmental Risk Assessment of Soil Contamination
active species are reduced up to their zero-valence form under stirred electrolytic solutions. In this sense, Ef must to be a more negative potential than Ei. Later, the stirring is stopped during the quiet time in order to avoid convection transport of ions through the solutions. Finally, the species previously reduced are selectively oxidized during an anodic linear sweep and the current is recorded as function of the potential applied without stirring of the electro‐ lytic solutions (Scholz, 2002).
Figure 2. Potential wave form used as perturbation in a DSPV (A) and NPV (B) experiment.
Differential Pulse Stripping Voltammetry (DSPV, Figure 2A) is comparable to Normal Pulse Voltammetry (NPV, Figure 2B) in that the potential is also scanned with a series of pulses. However, it differs from NPV because each potential pulse is fixed, of small amplitude (10 to 100 mV), and is superimposed on a slowly changing base potential. Current is measured at two points for each pulse, first point just before the application of the pulse and second one at the end of the pulse (Ari et al, 1990; Brett and Oliveira, 1998).These sampling points are selected to allow for the decay of the nonfaradaic (charging) current. The difference between current measurements at these points for each pulse is determined and plotted against the base potential (Woolever et al, 2001; Franke and Zeeuw, 1976). Square Wave Voltammetric (SWV) technique is among the most sensitive means, for the direct evaluation of concentrations; it can be widely used for the trace analysis. The perturbation consists of a square wave having constant amplitude, superimposed at the same time upon a staircase wave form. The current is measured at the end of each forward half-cycle (If) and at end of each reverse half-cycle (Ir). The difference between both current values (If-Ir) is displayed as a function of the applied potential E as shown in Figure 3. Therefore, the effect of the charging current is notably decreased in SWV since any residual charging current is completely re‐ moved (Bard and Rubinstein, 1999; Ari et al, 1990; Scholz, 2002; Zbigniew et al, 1994; Brett and Oliveira, 1998). SWV has several advantages, has an excellent sensitivity and the rejection of background currents, this speed coupled with computer control and signal averaging allows for experi‐
Electrochemical Detection of Mercury Removal from Polluted Bentonite and Quartz using Different Removing Agents http://dx.doi.org/10.5772/57446
Figure 3. Potential wave form used as perturbation in a SWV experiment.
ments to be performed repetitively and increases the signalto- noise ratio. Applications of SWV include the study of electrode kinetics with regard to preceding, following, or catalytic homogeneous chemical reactions (Franke and Zeeuw, 1976; Dogan – Topal et al, 2010). Using ASV, the concentration of mercury in liquid samples can be determined. For the determination of mercury in soil, ASV is used after an acid digestion which removes mercury from soil samples (Lamble and Hill, 1998). Some alternative methods for the removal of mercury in soil samples also exist, such as the use of removing agents as called in Table 2, in these studies removing agents were used to remove some heavy metals from different samples (Reddy and Camesselle, 2009; Reddy, 2005; Haheb, 2012; Tandy et al, 2004; Rhazi, 2002; Cox, 1996; Robles et al, 2012). In this paper, we compared the efficiency of eight removing agents showed in Table 2 in the ability to remove mercury from polluted bentonite and quartz comparing DSPV, SWV and ASV. Removing agent Ethylenediamine tetraacetic acid (EDTA) Diethylenetriamin pentaaceticacid (DTPA) Potassium iodide (KI) Hydroxypropyl-βcyclodextrine (HPCD) Ethyleneediaminetetraac etic acid + cysteine+ sodium chloride
Concentration
Sample
Removed Metal
0.2 M
0.2 M 0.2 M
η/% 20
Low permeability soil polluted with heavy
Hg
metals
50 80
10%
15
275 mgL-1, 1.25%,
Rawfish
Hg
90
383
384
Environmental Risk Assessment of Soil Contamination
Removing agent (EDTA +Cys+NaCl)
Concentration
Sample
Removed Metal
Respectively (Cu)- EDTA (84),
Ethylenediamine tetraacetic acid (EDTA)
NTA (66)
Ethylenediamine
EDDS (67)
disuccinicacid (EDDS) Iminodisuccinicacid (IDSA)
η/%
0.5 %
0.4 and 4 mM
Polluted soil
Cu, Pb
(Pb)- EDTA (94), NTA (65),
Ácidometilglicindi acetic (MGDA)
EDDS (67)
Nitrilotriacetic acid (NTA) 0.02 mMg-1
Co, Ca, Cr,
Cu (53),
Cu
Co (11)
Hg
99
(Co2+ and Ca2+) Chitosan
1.2 mMg-1 (Cr3+)
Polluted water
2 mMg (Cr ) -1
Potassium iodide (KI)
0.1 M
Potassium iodide (KI)
0.1 M
Ethylenediamine tetraacetic acid (EDTA)
0.1 M
3+
Polluted soil Polluted soil
62 Hg
75
Table 2. Scientific publications about metal extractions facilitated by removing agents.
Table 2 contains references about different removing agents reported to remove different metals. These studies analyzed the removal of metals from different samples, obtaining the highest efficiencies using removing and complexing agents by exchanging charges of cations to remove mercury in the first case, or coordinating cations in the second case (Wypych, 2004; Montuenga, 1979; Přibil, 1982; Buffle, 1990; Spencer et al. 2000; Malone, 1999).
2. Experimental procedure Stripping voltammetric measurements were carried out using the potensiostat / galvanostat Epsilon modular electrochemical analysis system. Three-electrode electrochemical cell (Figure 4) was used with glassy carbon electrode as working electrode, a platinum wire as auxiliary electrode and an Ag/AgCl as reference electrode (Pineda et al, 2009; Anguiano et al, 2012; Bustos, 2012). Glassy carbon electrode was polished in cloth with an alumina suspension of 1, 0.3 and 0.05 μm. Between each polish it was rinsed with deionized water, and then it was sonicated during 5 min in deionized water to eliminate any residual alumina.
Electrochemical Detection of Mercury Removal from Polluted Bentonite and Quartz using Different Removing Agents http://dx.doi.org/10.5772/57446
Figure 4. Scheme of a 3-electrode cell used in voltammetry techniques, where gas inlet is used for bubbling electro‐ lyte solution with an inert gas and with controlled temperature.
2.1. Reagents and solutions Reagents used in this study were: potassium chloride, potassium iodide, potassium hydroxide, sodium hydroxide, etilendiamintetracetic acid, and hydrochloric acid obtained from J. T. Baker; sodium chloride from Sigma Ultra; chitosan from crab shells practical grade, βciclodextrin hydrate, L-cysteine were obtained from Aldrich. For mercury pollution were used mercury chloride (II) from Merk, and mercury oxide (II) obtained from Hach. Calcium bentonite from Lodbent Bentonite, and sand white quartz from Sigma Aldrich. Removing agents tested were 0.1 M potassium iodide (KI), 0.1 M potassium chloride (KCl), 0.1 M potassium hydroxide (KOH), 0.1 M hydrochloric acid (HCl), 0.1 M ethylenediaminetetra‐ acetic acid (EDTA), 10% hydroxypropyl-β-cyclodextrine (HPCD) in deionized water, 0.01 M chitosan and a mixture of 275 mgL-1 EDTA, 1.15% cysteine and 0.5% sodium chloride (NaCl). All of the agents, with the exception of chitosan, had previously been tested for the ability to remove metals in soil samples. Control experiments were carried out with water. Solutions were prepared using water type I, according to ASTM-D1193-99. Chitosan were dissolved in acetic acid. Samples of quartz and calcium bentonite were polluted with mercuric chloride (HgCl2) and mercuric oxide (HgO) at concentrations of 10 and 25 mgL-1. Eight removing agents were tested to find the most effective. The percentage of mercury removed was quantified by ASV after extracting the liquid from the bentonite/quartz samples. 2.2. Techniques and procedures Electrochemical techniques as Anodic Stripping Voltammetry (ASV), Differential Stripping Pulse Voltammetry (DSPV) and Square Wave Stripping Voltammetry (SWSV) were tested to select adequate technique to quantify mercury removal efficiency. After select adequate
385
386
Environmental Risk Assessment of Soil Contamination
technique, calibration curves were created for all different removing agents for the addition of both HgCl2 and HgO. Experimental conditions for ASV were as follows: pre-concentration potential –0.6 V vs. Ag/ AgCl, deposition time 6 min, quiet time 30 s, scan rate 20 mV s-1. An increase in signal due to increasing mercury was monitored and recorded along with the increment in current associ‐ ated with the concentration addition. For SWSV were used an initial potential of -0.2 mV, a deposition potential of -0.6 V for a deposition time of 10 s; a quiet time of 5 s, a SW frequency of 50 Hz, a potential step of 0.005 V. For DSPV were used an initial potential of -0.2 mV, a deposition potential of -0.6 V for a deposition time of 10 s; a quiet time of 5 s, a potential step of 4 mV, a pulse width of 50 ms, a pulse period of 200 ms, pulse amplitude of 50 mV. All experiments were carried out at room temperature (25±1°C) (Anastasiadou et al, 2010). Calibration curves for mercuric quantification were done using electrochemical techniques to select the best.
3. Results and discussion 3.1. Selection of detection technique To select the technique to quantify mercury was realized calibration curves with both mercury compounds by ASV, DSPV and SWSV. Figure 5 shows the comparison of mercury detection using different electrochemical techniques. Mercury chloride was not showed but resembled same behavior. Table 3 shows comparison of electrochemical techniques of both mercury compounds, where it shows that any technique can be used to quantify mercury by its low detection and quantification limits, but the use of ASV shows the best fit with the lowest DL and QL. In consequence, ASV was selected to quantify mercury in solution, which was removed from polluted bentonite and quartz.
Mercury Compound
HgCl2
HgO
m
DL
QL
(µA mM-1)
(pM)
(nM)
0.993
2549.30
112.043
0.373
299.43x - 0.5035
0.978
299.43
422.226
1.407
SWSV
467.50x - 1.3763
0.981
467.50
479.046
1.597
ASV
6793.30x - 5.4037
0.998
6793.30
42.046
14.015
DPSV
1313.70x - 1.0952
0.968
1313.70
96.237
32.079
SWSV
2347.90x - 1.6533
0.971
2347.90
95.385
31.795
Technique
Linear Equation
R2
ASV
2549.30x - 0.0355
DPSV
Table 3. Parameters comparison of stripping voltammetry to quantify mercury.R2 is the correlation coefficient, m represents the slope of linear regression; DL means Detection Limits, QL represents Quantification Limits.
9
Table 3
mM-1
mM-1
9
12
(Figure 7).
(Figure 6).
9
Electrochemical Detection of Mercury Removal from Polluted Bentonite and Quartz using Different Removing Agents http://dx.doi.org/10.5772/57446 Figure 5 Could you please change this figure by the annexed figure please?
387
0.000024 0.000022
ASV
0.000020 0.000018
Current (A)
0.000016 0.000014
SWSV
0.000012 0.000010
DSPV
0.000008 0.000006 0.000004 0.000002 0.000000 0.0
0.1
0.2
0.3
0.4
0.5
Potential (V) Figure 5. ASV-DSPV-SWSV comparison tocomparison select technique to quantify mercuryto removed. Figure 5. ASV-DSPV-SWSV to select technique quantify
mercury removed.
3.2. Electrochemical responses of removing and complexing agents After obtaining encouraging calibration results for mercury detection using ASV with sequential addition on removing agents proposed. Electrochemical answer of removing and complexing agents in the presence of mercury compounds was obtained (Figure 6). Table 4 shows corresponding equations of different removing agents, including fitting (R2), sensibility (obtained from the slope m), detection and quantification limits (DL and QL respectively) for both mercury compounds. DL and QL represent fundamental performance characteristics of measurement processes, where DL or Limit of Detection (LOD) is defined as an indicator of the minimum detectable analyte net signal, amount or concentration. His term is widely understood and quoted by most chemists as a measure of the inherent detection capability. In general, the LOD is taken as the lowest concentration of an analyte in a sample that can be detected, but not necessarily quantified, under the stated conditions of the test. In another hand, QL or Limit of Quantification (LOQ) is the lowest concentration of an analyte in a sample that can be determined with acceptable precision and accuracy under the stated conditions of test. The general equation to determine detection and quantification limit is: LOD LOQ
=
F (SD ) b
Where F is a factor of 33 and 10 for LOD and LOQ, respectively. SD represent the standard deviation of the ordinate intercept, or residual standard deviation of the linear regression; and b the slope of the regression line. For a linear calibration curve, it is assumed that the instrument response y is linearly related to the standard concentration x for a limited range of concentra‐
3
Delete
No.
10
4
Replace with
Figure 8
Figure 7
388 Assessment of Soil Contamination 10 Environmental Could you please change this figure by the annexed figure increasing its size 50 % please? Figure 6 Risk
A
HCl HCl + HgO HCl + HgCl2
350.0µ 300.0µ
250.0µ
250.0µ
200.0µ
200.0µ
Current (uA)
Current (uA)
300.0µ
150.0µ 100.0µ
B
KCl KCl + HgO KCl + HgCl2
300.0µ 250.0µ
150.0µ 100.0µ
100.0µ
0.0
0.0
0.0
-50.0µ
-50.0µ
-50.0µ
350.0µ 300.0µ
-0.4
-0.2
0.0
0.2
0.4
0.6
50.0µ
-0.6
-0.4
-0.2
0.0
0.2
0.4
0.6
-0.6
D
KOH KOH + HgO KOH + HgCl2
350.0µ
E
H2O H2O + HgO H2O + HgCl2
300.0µ
350.0µ
200.0µ
200.0µ
200.0µ
100.0µ
150.0µ 100.0µ
50.0µ
50.0µ
0.0
0.0
-50.0µ
Current (uA)
250.0µ
150.0µ
0.0
0.2
0.4
0.6
300.0µ
G
150.0µ 100.0µ
0.0
-0.4
-0.2
0.0
0.2
0.4
0.6
-0.6
350.0µ
H
HPCD HPCD + HgO HPCD + HgCl2
300.0µ
350.0µ
200.0µ
200.0µ
100.0µ
150.0µ 100.0µ
50.0µ
50.0µ
0.0
0.0
-50.0µ
Current (uA)
200.0µ
Current (uA)
250.0µ
-0.2
0.0
0.2
0.4
0.6
0.0
0.2
0.4
0.6
I
150.0µ 100.0µ 50.0µ 0.0
-50.0µ -0.4
-0.2
(EDTA+Cys+NaCl) (EDTA+Cys+NaCl) + HgO (EDTA+Cys+NaCl) + HgCl2
300.0µ
250.0µ
-0.6
-0.4
Potential (V)
250.0µ
150.0µ
0.6
F A
Potenial (V)
Chitosan Chitosan + HgO Chitosan + HgCl2
0.4
-50.0µ -0.6
Potential (V)
350.0µ
0.2
50.0µ
-50.0µ -0.2
0.0
EDTA EDTA + HgO EDTA + HgCl2
300.0µ
250.0µ
-0.4
-0.2
Potential (V)
250.0µ
-0.6
-0.4
Potential (V)
Current (uA)
Current (uA)
150.0µ
50.0µ
Potential (V)
Current (uA)
200.0µ
50.0µ
-0.6
C
KI KI + HgO KI + HgCl2
350.0µ
Current (uA)
350.0µ
-50.0µ -0.6
-0.4
Potential (V)
-0.2
0.0
0.2
0.4
0.6
-0.6
-0.4
Potential (V)
-0.2
0.0
0.2
0.4
0.6
Potential (V)
Figure 6. Electrochemical behavior of mercury compounds to removing agents: (A) HCl, (B)KCl, (C)KI, (D) KOH, (E) H2O, Figure 6. Electrochemical behavior of mercury compounds to removing agents: (A) HCl, (B) KCl, (C) KI, (D) KOH, (E) (F) EDTA, (G) chitosan, (H) HPCD and (I) EDTA+Cys+NaCl.White the ASV showed before, calibration curves of each of one H2O, (F) EDTA, (G) chitosan, (H) HPCD and (I) EDTA + Cys + NaCl. mercury compounds added to removing agents was obtained as Figure 7 shows with the ASV response for chitosan.
Page No.
0.00012
Figure 7
A
Delete
Replace with
B
0.00011
Could you please change this figure by the annexed figure please? 0.00010 0.00009 0.00008
Current (A)
10
Line No.
0.00007 0.00006 0.00005 0.00004 0.00003 0.00002 0.00001 0.00000 0.0
0.1
0.2
0.3
0.4
0.5
Potential (V)
Figure 7. ASV detection HgO addition to chitosan HCl using vitreous carbon, platinum Figure 7. ASV detection of HgO of addition to chitosan in 0.1 in M0.1 HClMusing vitreous carbon, platinum wirewire andand Ag|AgCl as and linear fit HgO (B). Ag|AgCl asreference work, counter and reference electrode with scan oflinear 70 mVfits-1 work, counter and electrode with a scan speed of 70amV s-1 speed (A), and of(A), HgO addition toof chitosan addition to chitosan (B). Page No.
Line No.
11
32
Figures 9 and 10.
Figures 8 and 9.
11
33
(Figure 11),
(Figure 10),
11
44
(Figure 11B).
(Figure 10B).
11
45
(Figure 11A).
(Figure 10A).
Delete
Replace with
4
Electrochemical Detection of Mercury Removal from Polluted Bentonite and Quartz using Different Removing Agents http://dx.doi.org/10.5772/57446
HgO Removing Agent
m
DL
QL
(mA mg-1)
(μg L-1)
(μg L-1)
0.993
0.0077
0.2000
0.6680
0.999
0.0093
0.0676
0.2250
y=0.0141x+0.1194
0.982
0.014
0.0292
0.0974
KOH
y=0.0035x+0.0280
0.994
0.0035
0.2750
0.9160
EDTA
y=0.0039x+0.0369
0.988
0.0039
1.2400
4.1400
HPCD
y=0.0069x+0.0730
0.982
0.0069
0.1100
0.3660
Cys+EDTA+NaCl
y=0.0083x+0.0162
0.999
0.0083
0.0454
0.1510
Chitosan
y= 0.0054x+0.0401
0.992
0.0054
0.1480
0.4930
Equation
R2
HCl
y=0.0077x+0.0980
KCl
y=0.0093x+0.0421
KI
Complexing Agent
HgCl2
HCl
y=0.009x+0.0576
0.995
0.009
0.1710
0.5710
KCl
y=0.0092x+0.0538
0.993
0.0092
0.0684
0.2280
KI
y=0.0106x+0.1018
0.980
0.0106
0.0386
0.1290
KOH
y=0.0005x+0.0484
0.970
0.0005
1.9200
6.4100
EDTA
y=0.0033x+0.0421
0.975
0.0033
1.4700
4.8900
HPCD
y=0.0056x0.0487
0.995
0.0056
0.1350
0.4510
Cys+EDTA+NaCl
y=0.0163x-0.1353
0.987
0.0163
0.0231
0.0770
Chitosan
y=0.0046x+0.0406
0.986
0.0046
0.1740
0.5790
Table 4. Calibration curves corresponding to each removing agents.
tion. This model is used to compute the sensitivity b and the LOD and LOQ. Therefore, the LOD and LOQ can be expressed as LOD =
3Sa b
; LOD =
10Sa b
Where Sa is the standard deviation of the response and b is the slope of the calibration curve. The standard deviation of the response can be estimated by the standard deviation of either y-residuals, or y-intercepts, of regression lines. This method can be applied in all cases, and it is most applicable when the analysis method does not involve background noise. It uses a range of low values close to zero for calibration curve, and with a more homogeneous distribution will result in a more relevant assessment (Currie 1995, 1999; Guidance 2000). As can be seen in Table 4, we obtained a good QL and DL of mercury compounds in the presence of removing and complexing agents. So ASV is a good technique to determine mercury concentration in presence of removing agent too. In this way, removal efficiencies of mercury were analyzed in the next section.
389
390
Environmental Risk Assessment of Soil Contamination
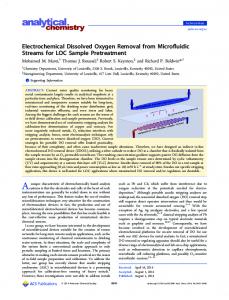
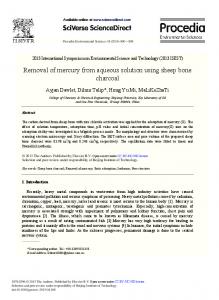
3.3. Mercury removal efficiencies Removal percentages were calculated in base of fitting equations for all the different removing agents, they are show in Figures 8 and 9. Due to structural differences in bentonite and quartz (Figure 10), mercury removal behaved differently for the two.
Figure 8. Removal percentages of mercury (HgCl2 and HgO) in bentonite using different removing agents with 10 mg L-1 (A) and 25 mg L-1 (B) mercury concentration.
Figure 9. Removal percentages of mercury (HgCl2 and HgO) in quartz using different removing agents with 10 mg L-1 (A) and 25 mg L-1 (B) mercury concentration.
Electrochemical Detection of Mercury Removal from Polluted Bentonite and Quartz using Different Removing Agents http://dx.doi.org/10.5772/57446
Figure 10. Representation of the structure of bentonite (A) and quartz (B) (Bruker AXS Advanced X-Ray Solutions Soft‐ ware).
Quartz is ordered as strong matrix of oxygen-silicon bonds, which prevent metal ions from penetrating its structure (Figure 10B). On the other hand, metal ions can easily slip into bentonite, which is formed of stacked layers, due to the gaps between the layers (Figure 10A). Because of the strong organized bonds in quartz, mercury is more easily removed from quartz than bentonite. Moreover, the particle size of bentonite is lower than quartz, and therefore has a bigger surface area and as a synthetic colloid, in addition, it has negative charges which attract positive ions. Once bentonite and quartz samples were contaminated with HgO or HgCl2, removing agents were added. After 24 h the sample was collected and analyzed by ASV. In order of the results obtained, bentonite adsorbed chitosan easily, swelling up dramatically which made it difficult to remove the supernatant. Therefore, the removal of mercury from bentonite using chitosan was inefficient (Figure 8, less than 5 %). This effect was consequence of the affinity of chitosan to the layers of bentonite and it was retained inside of this clay. In contrast, when the chitosan was used to remove Hg2+ from quartz (Figure 9), this got a removal close to 30 % when it was 10 mg L-1, and the double of removal was when quartz had 25 mg L-1 mercury; this increase was proportional to the concentration of mercury ions over quartz, where chitosan took off the pollutant from particle surface to the solution. Anyway, all the different extracting agents used to remove mercury remove metals by electrostatic forces, forming ionic bonds. Thus, magnitude depends on ionic charge. On the other hand, complexing agents act differently with metallic ions. Metals tend to lose electrons during chemical reactions, creating metallic ions. The positive charge of these cations attracts negative ions to form complexes held together by covalent bonds. Donat‐ ing species (ligands) needs to have a lone pair of electrons which can be donated to form a bond. Water, ammonia and halides are common inorganic ligands (Buffle, 1990; Ma‐ lone, 1999; Montuenga, 1979).
391
392
Environmental Risk Assessment of Soil Contamination
Stronger compounds as EDTA and chitosan tend to remove more mercury contamination present in the bentonite and quartz samples, than 0.1 M KI, 0.1 M KCl, 0.1 M KOH, 0.1 M HCl, 0.1 M EDTA, 10 % HPCD, 0.01 M chitosan and a mixture of 275 mg L-1 EDTA, 1.15 % cysteine and 0.5 % NaCl by the different arrangement of mercury ions in these chemical solutions, with less than 10 % removal from bentonite (Figure 8), and less than 20 % from quartz (Figure 9) in both concentrations of Hg2+: 10 and 25 mg L-1. With ASV has been possible study the thermodynamic and kinetic of adsorption of Hg (II) on Ca-Bentonite, detecting the pollutant in solution to confirm that Ca-Bentonite has a good adsorption capacity of Hg2+ adjusting the results to Freundlich isotherm as a mathematical model, with a pseudo second order of reaction. Using the standard potential (E°) obtained after the ASV, we obtained different thermodynamic parameters as equilibrium constant (Keq), free standard energy (ΔG°) and entropy (ΔS°) of Hg2+ – Ca-Bentonite. These results indicate us that the process of adsorption is spontaneous, endothermic and irreversible by a possible inclusion and interchange of Hg2+ with Ca2+ between the Bentonite slides. In addition, we have used the ASV to evaluate the electrorremediation of mercury polluted soil using complexing agents like EDTA removing up to 75 % of metal contaminants in mercury polluted soil samples by wetting them with 0.1M EDTA, placing them in an experimental cell equipped with Ti electrodes, and then applying a 5 V electric field for 6 hours in a batch reactor; Hg2+ was removed around 87 % in a time of 9 hours close to the anode side by the presence this complexing agent (Robles et al, 2012).
4. Conclusions ASV was selected as an electrochemical technique to quantify the percentage of mercury removed in liquid samples, which were derived from bentonite and quartz samples previously polluted with two mercury compounds (HgO and HgCl2). Eight removing agents were analyzed: 0.1 M KI, 0.1 M KCl, 0.1 M KOH, 0.1 M HCl, 0.1 M EDTA, 10 % HPCD, 0.01 M chitosan and a mixture of 275 mg L-1 EDTA, 1.15% cysteine and 0.5 % NaCl, using both extracting (ionic bond complexes) and complexing agents (covalent bond complexes). The best result of the removal of Hg2+ from bentonite and quartz were obtained with com‐ plexing agents: EDTA and chitosan. For bentonite, the most effective removing agent was EDTA which removed 17 % of both Hg compounds. In the case of quartz, chitosan was the best removing agent, removing 62 % of HgO and 53 % of HgCl2. This is the first report of the use of chitosan to remove mercury ion from bentonite and quartz, which is a very good new alternative of complexing agent because it is biodegradable, cheap and easy to obtain (derived from shrimp exoskeleton), with potential application to quantify mercury in polluted soil during some remediation strategy to verify its cleaning without a pretreatment of sample.
Electrochemical Detection of Mercury Removal from Polluted Bentonite and Quartz using Different Removing Agents http://dx.doi.org/10.5772/57446
Acknowledgements The authors would like to thank to Consejo Nacional de Ciencia y Tecnología de los Estados Unidos Mexicanos (CONACyT) with the project CONACYT 193883-UANL, L’Oreal, United Nations Educational, Scientific and Cultural Organization (UNESCO), Academia Mexicana de Ciencias (AMC), and Fundación México – Estados Unidos para la Ciencia (FUMEC) for the funding of this research. I. Robles is grateful to CONACyT for her scholarship.
Author details I. Robles, Luis A. Godínez, J. Manríquez, F. Rodríguez, A. Rodríguez and E. Bustos* *Address all correspondence to:
[email protected] Centro de Investigación y Desarrollo Tecnológico en Electroquímica S. C. Parque Tecnológi‐ co Querétaro Sanfandila, Pedro Escobedo, Mexico
References [1] Alloway, B. J. (1990). Heavy metals in soils, John Wiley and Sons, Inc. New York. [2] Anastasiadou, Z. D., Jannakoudakis, P. D., Girousi, S. T. (2010). Square wave anodic stripping voltammetry determination of eco-toxic metals in samples of biological and environmental importance. Central EuropeanJournal of Chemistry, 8 (5), 999 - 1008. [3] Anguiano, D. I.,García, M. G., Ruíz, C., Torres, J., Alonso – Lemus, I., Alvarez – Con‐ treras, L., Verde – Gómez, Y., Bustos, E. (2012). Electrochemical Detection of Iron in a Lixiviant Solution of Polluted Soil Using a Modified Glassy Carbon Electrode. Inter‐ national Journal of Electrochemistry, 2090 - 3537. [4] Ari, I., Andrzej, L., Rolf, S. (1990). Contemporary Electroanalytical Chemistry. Ple‐ num Press. New York and London, 419 - 429. [5] Bard, A. J., Rubinstein, I. (1999). Electroanalytical Chemistry: A Series of Advances. Marcel Dekker, Inc. USA, Vol. 14. [6] Bigham, M. D. (1990). Field Detection and Implications of Mercury in Natural Gas, SPE Prod. Eng., 120 - 124. [7] Bodle, W. W., Attari, A., Serauskas, R. (1980). Considerations for Mercury in LNG Operations", Inst. of Gas Tech., 6th. Int. Conference on LNG, Kyoto Japan, Paper 1. [8] Brett, Ch. M. A., Oliveira, A. M. (1998). Electroanalysis. Oxford University Press Inc. New York.
393
394
Environmental Risk Assessment of Soil Contamination
[9] Buffle, J. (1990). Complexation Reactions in Aquatic systems, an Analytical Ap‐ proach, Editorial Ellis Horwood, Great Britain. [10] Bustos, E. (2012). Design, Construction and Characterization of an Electrochemical Sensor of Mercury in Soil.Environmental Influences of Mercury Ore Processing: Case Studies Selected at Slovenian, Mexican, Hungarian Group Meeting in Idrija, Editors: Mateja Gosar, Tatjana Dizdarevič, Miloš Miler, UNESCO, Slovenian National Com‐ mittee of the International Geoscience Programme, Idrija, Slovenia. [11] Chapple, G. (1990). The determination of arsenic, selenium and mercury levels in U.S. EPA quality control samples using the GBC HG3000 continuous-flow hydride generator, GBC AA Aplications, N° 17, Australia. [12] Cox, C. D. (1996).Electrokinetic remediation of mercury contaminated soils using io‐ dide / iodine lixiviant. Environmental Science and Technology, 30, 1933 - 1938. [13] Currie, L. A. (1999). Detection and quantification limits: origins and historical over‐ view. Analytica Chimica Acta 391, 127 - 134. [14] Currie, L. A. (1995).Nomenclature in evaluation of analytical methods including de‐ tection and quantification capabilities (IUPAC recommendations). Pure & Applied Chemistry, 67 (10), 1699 - 1723. [15] Fodör, P. (2000). Development of analytical systems for the simultaneous determina‐ tion of the speciation of arsenic and Selenium, Analytical Chimica Acta, 413, 13 – 23. [16] Fodör, P. (2005). Arsenic speciation in farmed hungarian freshwater fish. Journal of Agricultural and Food Chemistry, 53, 9238 - 9243. [17] Fodör, P. (2007). Selenium speciation studies in Se- enriched chives by HPLC-ICPMS. Food Chemistry 101, 1398 – 1406. [18] Franke, J. P., Zeeuw, R. A. (1976). Differential Pulse Anodic Stripping Voltammetry as a Rapid Screening Technique for Heavy Metal Intoxications. Archives of Toxicology, 37, 47 - 55. [19] Godarzi, N. M., Shahbazi, B., Grigoryan, K. (2012). The study of mercury pollution distribution around a chlor-alkali petrochemical complex, Bandar Imam, southern Iran. Environmental Earth Science, 67, 1485 – 1492. [20] Guidance for industry, Analytical Procedures and Methods Validation: Chemistry, Manufacturing, and Controls, Federal Register (2000) 65, 776 - 777. [21] Haheb, P. (2012). Reduction of mercury from mackerel filled using combined solu‐ tion of cysteine, EDTA, and sodium chloride. Journal of Agricultural and Food Chemis‐ try, 60, 6069 - 6076. [22] Hubert H. G. (2001). Electrochimie Physique etAnalytique. Presses Polytechniqueset Universitaires Romandes, 345.
Electrochemical Detection of Mercury Removal from Polluted Bentonite and Quartz using Different Removing Agents http://dx.doi.org/10.5772/57446
[23] Lamble, K., J., Hill S. J. (1998). Microwave digestion procedures for environmental matrices. Analyst, 123, 103R – 133R. [24] Leopold K., Foulkes, M., Worsfold, P. (2010).Methods for the determination and spe‐ ciation of mercury in natural waters- a review. AnalyticaChimicaActa, 663, 127 – 138. [25] Malone, L. J. (1999) Introducción a la química, Segunda Edición, Editorial Limusa, México D. F. [26] Mikac, N. (1999). Speciation of mercury in sediments of the Seine estuary (France). Applied Organometalic Chemistry, 13, 715 – 725. [27] Montuenga, C. (1979). Formación de complejos en química analítica, editorial Alham‐ bra, Madrid. [28] Pineda, K. A., Bustos, E., García, M. G. (2009). Determination of Heavy Metals in Samples with Caolite of Guanajuato by Voltammetry with Anodic Redisolution. ECS Transactions, 20 (1), 21 – 29. [29] Přibil R. (1982). Applied complexometry, Volume 5 of Pergamon series in analytical chemistry. [30] Reddy K. (2005).Electrokinetic remediation of metal-contaminated field soil. Separa‐ tion Science and Technology, 40, 1701-1720. [31] Reddy, K., Camesselle C. (2009).Electrochemical remediation technologies for pollut‐ ed soils, sediments and grounwater, Willey, New Jersey. [32] Rhazi, M. (2002). Influence of the nature of the metal ions on the complexation with chitosan. Aplication to the treatment of liquid waste. European Polimer Journal, 38, 1523 - 1530. [33] Robles, I., García, M. G., Solís, S., Hernández, G., Bandala, Y., Juaristi, E. and Bustos E. (2012). Electroremediation of mercury polluted soil facilitated by complexing agents. International Journal of Electrochemistry Science, 7, 2276 – 2287. [34] Sarzanini, C., Sacchero, G., Aceto, M., Abollino, O., Mestasti, E. (1994). Determination of mercury in naphtha. Analytical Chimica Acta, 284, 661 - 667. [35] Scholz, F. (2002). Electroanalytical Methods: Guide to Experiments and Applications. Springer-Verlag, Berlin, Heidelberg, 191 - 208. [36] Shi, J., Liang, L., Jiang, G., Jin, X. (2005). The speciation and bioavailability of mercu‐ ry in sediments of Haihe River, China. Environment International, 31 (3), 357 – 365. [37] Skoog, D. A. (1997). Fundamentos de química analítica, Editorial Reverté, Barcelona. [38] Slowey, A. J., Rytuba, J. J., Brown, G. E. (2005). Speciation of mercury and mode of transport from placer gold mine tailings. Environmental Science & Technology, 39, 1547-1554.
395
396
Environmental Risk Assessment of Soil Contamination
[39] Spencer, J. N., et al (2000). Química, Estructura y Dinámica, Editorial CECSA, Méxi‐ co. [40] Tandy Tandy, S., Bossart, K., Mueller, R., Ritschel, J., Hauser, L., Schulin, R., Nowack, B. (2004). Extraction of heavy metals from soils using biodegradable chelating agents, Environmental Science and Technoly, 38, 937 - 944. [41] US - EPA, Method 7471 (http://www.epa.gov/osw/hazard/testmethods/sw846/pdfs/ 7471b.pdf). [42] Woolever, C. A., Starkey, D. E., Dewald, H. D. (2001). Differential pulse anodic strip‐ ping voltammetry of barium and lead in gunshot residues. Forensic Science Interna‐ tional, 117, 185 - 190. [43] Wypych, F. (2004). Clay Surfaces: Fundamentals and Applications, Elsevier Academ‐ ic Press. [44] Zbigniew, G., Chalmers, T. A., Bryce, W. A. J. (1994). Fundamentals of Electrochemi‐ cal Analysis. 2nd edition. Polish Scientific Publishers, 136 – 140.