Proceedings of the 29th Annual International Conference of the IEEE EMBS Cité Internationale, Lyon, France August 23-26, 2007.
FrP1A1.22
Electroconvulsive Therapy: A Model for Seizure Detection by a Wavelet Packet Algorithm Ali Shahidi Zandi, Student Member, IEEE, Reza Tafreshi, Member, IEEE, Guy A. Dumont, Fellow, IEEE, Craig R. Ries, Bernard A. MacLeod, Ernie Puil
Abstract—Electroconvulsive therapy (ECT) is an effective treatment for severe depression. In this paper, we have used an algorithm based on wavelet packet (WP) analysis of EEG signals to detect seizures induced by ECT. After determining dominant frequency bands in the ictal period during ECT, the energy ratio of these bands was computed using the corresponding WP coefficients. This ratio was then used as an index to recognize seizure periods. Four different approaches to detect ECT seizures were employed in 41 EEG recordings from nine patients. Sensitivity in ECT seizure detection ranged from 76 to 95% while the false detection rate ranged from 6 to 13.
E
I. INTRODUCTION
LECTROCONVULSIVE therapy (ECT) is used to treat clinical depression that is unresponsive to drugs. During each treatment, a psychiatrist induces a generalized tonicclonic seizure with electricity after an anesthesiologist administers a short-acting general anesthetic. Typically, a course of 12 ECT treatments is provided during an initial four-week period. Detection of a generalized seizure during ECT is typically done with the visual electroencephalogram (EEG) as it is more dependable than monitoring motor activity alone [1], [2]. The EEG is also used to characterize the seizure [2]. For example, seizure duration has been studied extensively, but there is no general agreement on using it as a criterion of ECT effectiveness [2]-[4]. Some results on automatic estimation of this parameter have been
reported [5]. From a long-term perspective, we would like to develop an automatic method to assess seizure quality. However, since our group has developed a wavelet packet algorithm to detect seizure activity in epilepsy [6], we were interested in using the EEG signal during ECT as a model for testing the algorithm. II. WAVELET ANALYSIS AND WAVELET PACKET TRANSFORM As a linear time-frequency transform, wavelet transform (WT) is a suitable analytical tool in pattern recognition and signal processing especially in the analysis of transient and non-stationary phenomena [7]. Wavelet analysis has been utilized widely in biomedical signal processing [8], [9]. In addition to our recent study to detect epileptic seizures using wavelet packet theory [6], our group previously defined an index to estimate hypnotic depth in an anesthetized patient’s EEG signals using wavelet analysis, discriminating between conscious and anesthetized states [10], [11]. In wavelet analysis, a multi-resolution decomposition of a given signal x(t) is obtained using a set of basis functions as represented in (1).
x (t ) = ∑ 2 j0 / 2 c j0 ( k )ϕ ( 2 j0 t − k ) k
∞
+∑ ∑2 k
Manuscript received April 16, 2007. A. Shahidi Zandi is with the Department of Electrical & Computer Engineering at The University of British Columbia (UBC), Vancouver, BC, V6T 1Z4, Canada (corresponding author, phone: 604-827-4059; fax: 604822-8563; e-mail:
[email protected]). R. Tafreshi is with the Department of Mechanical Engineering at Texas A&M University at Qatar, Doha, P.O. Box 23874, Qatar (e-mail:
[email protected]). G. A. Dumont is with the Department of Electrical & Computer Engineering at The University of British Columbia (UBC), Vancouver, BC, V6T 1Z4, Canada (e-mail:
[email protected]). C. R. Ries is with the Department of Anesthesiology, Pharmacology & Therapeutics at The University of British Columbia (UBC), Vancouver, BC, V6T 1Z3, Canada (e-mail:
[email protected]). B. A. MacLeod is with the Department of Anesthesiology, Pharmacology & Therapeutics at The University of British Columbia (UBC), Vancouver, BC, V6T 1Z3, Canada (e-mail:
[email protected]). E. Puil is with the Department of Anesthesiology, Pharmacology & Therapeutics at The University of British Columbia (UBC), Vancouver, BC, V6T 1Z3, Canada (e-mail:
[email protected]).
j = j0
(1)
d j ( k )ψ ( 2 t − k ) j
where functions φ(t) and ψ(t) are respectively the basic scaling and mother wavelet [7]. Index j corresponds with the scale in the multi-resolution structure and j0 refers to the coarsest scale. While the first summation gives an approximation of signal x(t), the details of the signal are added using larger j (finer scales) in the second term. The coefficients of the wavelet decomposition shown in (1), are called the discrete wavelet transform (DWT) of signal x(t). Scaling coefficients cj(k) and wavelet coefficients dj(k) are the projection of signal x(t) in the wavelet domain and describe its characteristics. If the wavelets used in the DWT are orthogonal [7], these coefficients are computed by ∞
c j (k ) = ∫ 2 j / 2 x(t )ϕ (2 j t − k )dt −∞ ∞
d j (k ) = ∫ 2 j / 2 x(t )ψ (2 j t − k )dt −∞
1-4244-0788-5/07/$20.00 ©2007 IEEE
j/2
1916
(2)
µV
(0,0)
(1,0)
(2,3) µV
(2,1) (2,2)
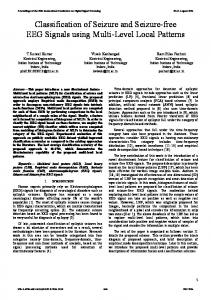
Fig. 1. Decomposition tree in a wavelet packet.
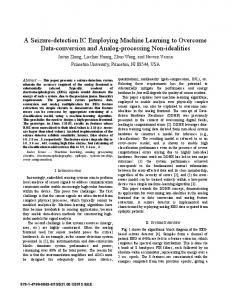
In the DWT, the frequency axis is divided into dyadic intervals toward the lower frequencies while the length of bandwidth decreases exponentially [7]. Wavelet packet (WP) transform is a generalization of the DWT in which the decomposition procedure is done in both lower and upper frequencies. This general decomposition offers a greater range of possibilities in the signal analysis than discrete wavelet decomposition. In the wavelet packet tree, each node is recognized with the decomposition level (scale) l and the frequency band f. That is, node (l, f) is the f th node at level l from the root of the WP tree, for l = 0, 1 ,…, L and f = 0, 1, …, 2l-1 where L = log2 n (n is the signal dimension). Figure 1 shows a typical scheme of wavelet packet tree with two level of decomposition. III. MATERIALS AND METHODS A. ECT Data Following informed written consent, 50 scalp (surface) one-channel EEG traces were recorded from nine patients. Each recording included one ECT seizure episode. Stimulation was done using pulse width of 0.5ms and frequency of 70 Hz. Data were sampled at 128 Hz and filtered using a 60-Hz notch filter. To analyze data, each EEG recording was segmented into 2-second widows with one second overlap. According to the sampling rate, this segmentation is suitable for wavelet analysis of the EEG signals since it leads to epochs whose lengths are power of two [12]. Figure 2 presents an EEG period starting 30s before and ending 60s after the ECT start time. The seizure has been induced from ~24s to 31s after the ECT onset.
µV
(2,0)
(1,1)
EEG signal: -30 sec. to 0 sec. with respect to the ECT start time
500 250 0 -250 -500 -30
500 250 0 -250 -500
-25
-20
-15 Time (Sec.) (a)
-10
-5
0
EEG signal: 0 sec. to 30 sec. with respect to the ECT start time
0
5
10
15 Time (Sec.) (b)
20
25
30
EEG signal: 30 sec. to 60 sec. with respect to the ECT start time
500 250 0 -250 -500 30
35
40
45 Time (Sec.) (c)
50
55
60
Fig. 2. EEG data corresponding to ECT from 30s before the ECT start time to 60s after.
discriminating between seizure and non-seizure periods. These frequency bands lay in the delta (~0.5 to 4 Hz) and theta (~4 to 8 Hz) bands where most EEG spectrum changes occur during ECT [13]. To analyze the EEG signal in these two frequency bands, the WT is a very useful tool especially since EEG signals are non-stationary. In addition, due to the closeness of the two frequency bands selected in this analysis, the WP was employed as it offers a more flexible range of frequency bands. The WP energy ratio (WPER) [6], defined as the ratio of energies of the above two frequency bands (the energy of higher band divided by that of lower one), was chosen as a discriminating feature where the energy of each band was computed by summing the squared corresponding WP coefficients. Changes in the frequency content of the EEG during the seizure cause a significant increase in
B. Methodology The frequency spectrum of the EEG signal during ECT reveals some tangible differences in the lower frequency range (