Jul 4, 2008 - days, quetiapine 50 mg BD and nitrazepam 60 mg nocte. Her pulse was 80 bpm with BP of 130/70. mHg and the baseline electrocardiograph ...
Images in Medicine
www.jpgmonline.com
Electroconvulsive therapy and electrocardiograph changes Narasimhan S
Department of Cardiology, John Hunter Hospital, Newcastle, NSW, Australia Correspondence: Seshasayee Narasimhan E-mail: seshnarasimhan@ yahoo.com.au
Received : 08-02-07 Review completed : 30-06-08 Accepted : 04-07-08 PubMed ID : 18626176 J Postgrad Med 2008;54:228-9
A
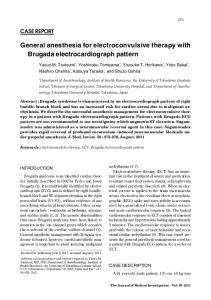
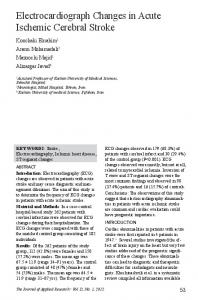
70-year-old woman with a body mass index of 25 kg/m2 and recalcitrant depression on a background of quiescent polycythemia rubra vera and carcinoma breast was scheduled for electroconvulsive therapy (ECT). Her current medications were aspirin 150 mg mane on alternative days, quetiapine 50 mg BD and nitrazepam 60 mg nocte. Her pulse was 80 bpm with BP of 130/70 mHg and the baseline electrocardiograph (ECG) is shown in Figure 1. Under anesthetic supervision, she was administered bifrontal 50% ECT. Immediately following ECT, a 22-sec motor seizure was noted. She developed atrial fibrillation with a ventricular rate of 130 bpm with 4-mm diffuse T-wave inversion. She was treated with 135 mg IV esmolol and IV magnesium sulphate 30 mg and reverted to sinus rhythm. A repeat ECG is shown in Figure 2. She denied chest pain and was hemodynamically stable. A formal neurological examination was unremarkable. Given her past smoking history of 200-pack years and previously reported cases of critical stenosis of the left anterior descending coronary artery with similar ECG changes,[1] she was commenced on IV heparin and admitted to the medical ward where she remained stable. An inpatient dipyridamole stress perfusion scan performed on Day 8 showed a small reversible apical perfusion defect, with the gated single photon emission
computed tomography (SPECT) study showing normal wall motion and contractility with left ventricular ejection fraction of 60%. The patient was transferred back to the psychogeriatric service. Repeat ECG on Day 14 showed persistence of T-wave inversion. Discussion Non-ischemic causes of new diffuse ECG changes are well documented. The ECG changes induced by acute subarachnoid hemorrhage (SAH) probably reflect non-uniform myocardial
repolarization secondary to increased amounts of noradrenalin release from the hypothalamus.[2] However, about 20% of cases of SAH are associated with myocardial ischemia as a result of increased systemic levels of catecholamines.[3] The ECG changes following ECT are not well described in the literature as physician consultations in such patients are relatively few in number.[4] In the presence of negative cardiac testing, the most likely cause for abnormal ECG changes is increased sympathetic activity associated with ECT.[5] This is supported by the decreased T-wave amplitude following
Figure 1: Baseline ECG !
228
J Postgrad Med July 2008 Vol 54 Issue 3
Narasimhan, et al.: Electroconvulsive therapy and ECG changes !
Figure 2: ECG with diffuse T-wave inversions
injection of IV adrenaline.[6] Prospective studies suggest that this phenomenon may be seen in up to 4% of patients treated with ECT.[5] In our patient, the normal ECG a month prior to ECT along with negative cardiac testing is reassuring that the ECG changes do not reflect myocardial ischemia secondary to underlying widespread obstructive coronary disease which may have been induced by psychotropic and/or anesthetic medications. The ECG changes may well be secondary to increased sympathetic activity associated with ECT. Electroconvulsive therapy has a recognized therapeutic role in the management of severe depression resistant to medical treatment[7,8] and has been shown to be a safe procedure, even in older patients with known cardiovascular disease.[9] However, cardiac complications can occur which include arrhythmias, particularly ventricular ectopy, transient ST-segment depression, and transient wall motion abnormalities on echocardiography.[10-14] Not surprisingly, these are seen more often in patients with underlying cardiac disease and related to ECT-associated systemic hypertension and tachycardia which increase myocardial oxygen demand resulting in myocardial ischemia.[10,11] Of interest is a prospective review of 53 patients where ECT was found to lead to transient decrease in left ventricular systolic function in patients without underlying cardiac disease.[14] Multiple ECT sessions did not have a cumulative deleterious effect on left ventricular function which suggests that tolerance to ECT can develop.[14] Though ECG changes can occur following ECT, it is prudent to investigate for coronary artery disease in patients with cardiovascular risk factors. The duration of the ECG changes following ECT is not clearly defined but it was seen to last for three weeks in one report.[5] On current evidence the long-term outcome in patients with such changes remains unknown.
J Postgrad Med July 2008 Vol 54 Issue 3
References 1. 2. 3. 4. 5. 6. 7. 8. 9.
10. 11. 12. 13. 14.
Narasimhan S, Robinson GM. Wellens syndrome: A combined variant. J Postgrad Med 2004;50:73-4. Cropp GJ, Manning GW. Electrocardiographic changes simulating myocardial ischemia and infarction associated with spontaneous intracranial hemorrhage. Circulation 1960;22:25-38. Kazzi AA, Zebian R, Ellis K. Subarachnoid hemorrhage. Available from: http://www.emedicine.com/EMERG/topic559.htm. Cockey GH, Conti CR. Electroconvulsive therapy-induced transient T-wave inversions on ECG. Clin Cardiol 1995;18:418-20. O’Brien KE, Nicholas P, Conti JB. Diffuse T-wave inversions associated with electroconvulsive therapy. Am J Cardiol 2004;93:1573-4. Struthers AD, Reid JL, Whitesmith R, Rodger JC. Effects of intravenous adrenaline on electrocardiogram, blood pressure and serum potassium. Br Heart J 1983;49:90-3. The UK ECT Review Group. Electroconvulsive therapy: Systematic review and meta-analysis of efficacy and safety in depressive disorders. Lancet 2003;361:799-808. Royal College of Psychiatrists. Fact sheet on ECT. London: RCP; 1995. Dec GW Jr, Stern TA, Welch C. The effects of electroconvulsive therapy on serial electrocardiograms and serum cardiac enzyme values: A prospective study of depressed hospitalized patients. JAMA 1985;253:2525-9. Kaos GB, Sung YF, Cooper RC, Staudemire A. Electroconvulsive therapy-induced hemodynamic changes unmask unsuspected coronary artery disease. J Clin Anesth 1990;2:37-40. Messina AG, Paranicas M, Katz B, Markowitz J, Yao FS, Devereux RB. Effect of electroconvulsive therapy on the electrocardiogram and the echocardiogram. Anesth 1992;75: 511-4. Zielinski RJ, Roose SP, Devanand DP, Woodring S, Sackeim HA. Cardiovascular complications of ECT in depressed patients with cardiac disease. Am J Psychiatry 1993;150:904-9. Rice EH, Sombrotto LB, Markowitz JC, Leon AC. Cardiovascular morbidity in high-risk patients during ECT. Am J Psychiatry 1994;151:1637-41. McCully RB, Karon BL, Teresa A, Rummans TA, Black JL, Andreen KM, et al. Frequency of left ventricular dysfunction after electroconvulsive therapy. Am J Cardiol 2003;91:1147-50. Source of Support: Nil, Conflict of Interest: None declared.
229 !