Dec 30, 2003 - information on the density distribution of the electron bunch in ... electron beam [J. S. Fraser, R. L. Sheffield, and E. R. Gray, Nucl. Instrum.
PHYSICAL REVIEW SPECIAL TOPICS - ACCELERATORS AND BEAMS, VOLUME 6, 122801 (2003)
Electron beam phase-space measurement using a high-precision tomography technique V. Yakimenko, M. Babzien, I. Ben-Zvi, R. Malone, and X.-J. Wang National Synchrotron Light Source, Brookhaven National Laboratory, Upton, New York 11973, USA (Received 15 September 2003; published 30 December 2003) We report a measurement of the multidimensional phase-space density distribution of an electron bunch. The measurement combines the techniques of picosecond slice-emittance measurement and high-resolution tomographic measurement of transverse phase space. This technique should have a significant impact on the development of low emittance beams and their many applications, such as short-wavelength free-electron lasers and laser accelerators. A diagnostic that provides detailed information on the density distribution of the electron bunch in multidimensional phase space is an essential tool for obtaining a small emittance at a reasonable charge and for understanding the physics of emittance growth. We previously reported a measurement of the slice emittance of a picosecond electron beam [J. S. Fraser, R. L. Sheffield, and E. R. Gray, Nucl. Instrum. Methods Phys. Res., Sect. A 250, 71 (1986).]. The tomographic reconstruction of the phase space was suggested [X. Qiu, K. Batchelor, I. Ben-Zvi, and X. J. Wang, Phys. Rev. Lett. 76, 3723 (1996).] and implemented [C. B. McKee, P. G. O’Shea, and J. M. J. Madey, Nucl. Instrum. Methods Phys. Res., Sect. A 358, 264 (1995); I. Ben-Zvi, J. X. Qiu, and X. J. Wang, in Proceedings of the Particle Accelerator Conference, Vancouver, 1997 (IEEE, Piscataway, NJ, 1997).] using a single quadrupole scan. In the present work we expand the tomographic reconstruction work and combine it with the slice-emittance method. Our present tomographic work pays special attention to the accuracy of the phase-space reconstruction. We use a transport line with nine focusing magnets, and present an analysis and technique aimed at the control of the optical functions and phases. This high-precision phase-space tomography together with the ability to modify the radial charge distribution of the electron beam presents an opportunity to improve the emittance and apply nonlinear radial emittance corrections. Combining the slice emittance and tomography diagnostics leads to an unprecedented visualization of phase-space distributions in fivedimensional phase space and provides an opportunity to perform high-order emittance corrections. DOI: 10.1103/PhysRevSTAB.6.122801
I. INTRODUCTION High-brightness electron beams are a subject of intense interest in the accelerator community and impact areas of science such as the generation of high-brightness electromagnetic radiation [through free-electron lasers (FELs) and light sources] and high-energy physics (through laser accelerators and linear colliders). The objective of obtaining a high-brightness electron beam with devices such as a laser-photocathode rf electron gun [1] requires advanced electron-beam diagnostics to analyze and understand the detailed behavior of the electron beam. Our team at Brookhaven National Laboratory’s Accelerator Test Facility (ATF) has been engaged in both aspects. In this work we report the measurement of the multidimensional phase-space density distribution of an electron bunch. The measurement combines the techniques of picosecond slice-emittance measurement and high-resolution tomographic measurement of transverse phase space. A diagnostic that provides detailed information on the density distribution of the electron bunch in multidimensional phase space is an essential tool for obtaining a small emittance at a reasonable charge and for understanding the physics of emittance growth. In previous work we demonstrated a measurement of a slice emittance and provided a clear demonstration of the linear longitudinal emittance-compensation scheme [2]. 122801-1
1098-4402=03=6(12)=122801(8)$20.00
PACS numbers: 41.85.–p
Modification of the laser pulse profile of a photocathode rf gun has been suggested as one way to achieve nonlinear emittance compensation [3]. In the present work we combine the slice-emittance technique with a highprecision tomographic technique, leading to an unprecedented visualization of the density distribution in fivedimensional phase space. In the tomographic analysis we emphasize the accuracy of the phase-space reconstruction and present an analysis using a transport line with nine focusing magnets and techniques to control the optical functions and phases. This high-precision phase-space tomography together with the ability to modify the radial charge distribution of the electron beam presents an opportunity to improve the emittance and apply nonlinear radial emittance corrections. Combining the slice emittance and tomography diagnostics provides an opportunity to perform high-order emittance corrections. Some introductory remarks concerning phase-space tomography are in order. Tomography is the technique of reconstructing an object from its projections. This technique is widely used in the sciences. In medical applications it allows the noninvasive observation of the interior of a human body by mathematically processing multiple x-ray images taken from different angles. The theory of reconstruction from projections was developed long before any practical tomographic 2003 The American Physical Society
122801-1
PRST-AB 6
ELECTRON BEAM PHASE-SPACE MEASUREMENT USING . . .
reconstruction. It is generally accepted that the problem was first analyzed by Radon [4]. The first system for reconstructing x-ray medical images originated from Russia [5]. The theory was independently rediscovered in several distinct fields of physics including radio astronomy [6] and electron microscopy [7]. In the physics of beams one can use tomographic techniques to reconstruct a beam density distribution in phase space using its projections in real space. The images of a beam on a phosphorescent screen (taken, for example, by a CCD camera) represent only a two-dimensional projection of the originally six-dimensional phase space of the electron beam. Variation of the betatron phase advance preceding the beam profile monitor is equivalent to beam rotation in phase space. Modifying the beam transport matrix, using variable strength lenses, can produce such a rotation. Projections of the electron beam taken at various phase-advance angles can be used to derive the phasespace density distribution. As will be described later, a number of quadrupole lenses in the beam transport system are used in order to rotate the phase-space distribution. This necessitates precise control of the phase advance in both transverse planes and the magnification at the analyzing device, which is a beam profile monitor. The raw data consist of sets of beam intensity distributions in the two transverse coordinates x and y, where each set is associated with a particular phase advance. The spatial distribution is projected on the x and y axes to produce two independent sets, one extracting the x-x0 phase-space distribution and the other for the y-y0 phasespace distribution. The next step is the reconstruction of the phase-space density distributions. Reconstruction techniques can be largely classified into two groups: convolution and backprojection methods (or the equivalent Fourier techniques) and iterative methods. The ‘‘filtered backprojection’’ or ‘‘convolution’’ reconstruction process uses an extremely simple mathematical algorithm. In fact it takes only two or three formulas [8] or about 15 lines of computer language programming to carry out the reconstruction of phase density from the projection data. In the following, we provide some basic results from that analysis. The desired density in x; x0 phase space ��x; x0 � can be obtained from the measured data �� �x� by the transforms below. �� �x� is obtained from the beam profile monitor data by projecting the x-y distribution onto the x axis for a given phase advance �. To obtain the distribution in y-y0 phase space one projects the beam profile onto the y axis. The phase-space density ��x; x0 � is obtained by the following integral of the ‘‘filtered projection’’: ��x; x0 � �
Z� 0
relationship: �y� �ms� �
1 1 X �� �ms� �� �ms� � 2 : 4s � s n �m � n�2 �m�n�odd
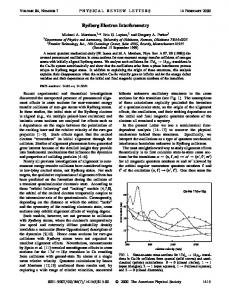
Since the data is discrete, and x � ms where m is an integer and s is the pixel size, this form is suitable for data processing. In order to carry out a practical measurement, we need to know how many projections we should measure, what resolution we can expect, and the accuracy required of the overall measurement process. Section II addresses these issues. The experimental setup and measurement procedure are discussed in Sec. III. II. ERROR ANALYSIS The estimation of errors in the tomographic recovery procedure was done by simulating the recovery process of a known (artificially generated) electron-beam distribution, called a ‘‘phantom.’’ Following recovery, the resultant distribution is compared to the phantom to determine the loss in definition, distortion, and other errors. This is a standard tomography technique. For this purpose we developed a program based on MATHCAD software by Mathsoft, Inc. The goal of this study was to understand the following issues: (i) tolerances for angular and stretching errors in the focusing channel, (ii) required number of measured projections, (iii) the effect of smoothing during recovery, and (iv) the effect of imperfections in the beam profile monitor. A phantom electron-beam distribution possessing fine features was chosen, as shown in Fig. 1. The fine structure details (tails) are on a size scale approximately 1/10 of the core.
�y� � �d�j �x cos��x0 sin� :
�y� � � is called the filtered projection, and can be obtained from the projection data �� �x� by the following simple 122801-2
122801 (2003)
FIG. 1. (Color) The phase-space density distribution of the phantom in the Y-Y 0 plane.
122801-2
PRST-AB 6
V. YAKIMENKO et al.
122801 (2003)
FIG. 2. (Color) Recovered phase-space density distributions of the phantom in the Y-Y 0 plane using various numbers of ‘‘measured" and interpolated projections. (a) 32 projections, (b) 16 projections, (c) 16 projections and 16 interpolations.
The phantom (shown in polar coordinates) was generated by combining a few basic functions: � �Ph ��; �� � exp � �2 �1 � 3sin2 �� �� � cos2 � : 1� 1 � 100 � � cos2 �� � �6 ��2 The phantom distribution is propagated through the accelerator, using a transport matrix, to the location of the beam monitor. At the monitor’s location a projection is generated numerically and saved as a ‘‘measurement.’’ The measured projections are used to reconstruct the original distribution, which is then compared to the phantom to establish the quality of the tomographic reconstruction. We compared results of phantom recovery number using 32 measured projections equally spaced over 180 . The results are presented in Fig. 2. Figure 2(a) represents a recovery using all 32 projections. In Fig. 2(b) the recovery is done with only 16 projections (every other one). It is possible to generate artificial projections by interpolation of measured projections during analysis (spline interpolation in angular coordinate). The recovery using 16 projections plus 16 interpolated projections (32 total) is presented in Fig. 2(c). As expected, interpolation results in a loss of resolution. We reach the qualitative conclusion that to be able to recon-
struct distribution details at a resolution about one-tenth of the core, the number of measured projections should be at least 32 without any interpolations. The same conclusion may be reached by analyzing tomographic reconstruction of the real electron beam, as shown in Fig. 3. A special electron-beam density distribution was generated by applying an annular (‘‘donut’’) laser distribution to the photoinjector. The purpose of this was to generate a phase-space density distribution with distinctive features. The images in Figs. 3(a) –3(c) present the recovered transverse phase-space distribution of the beam from the experimental data. The dark straight lines on the phase-space reconstruction are produced by a fiducial mark on the beam profile screen. This mark can be conveniently used to count the number of the projections that were used in the reconstruction as well as the accuracy of the reconstruction of small details. One may also notice that some spurious features in the recovered phasespace distribution can be removed by using a larger number of projections. Next, we addressed the required accuracy in the control of the phase advance and in the transverse stretching of the phase-space distribution produced by the beam matrix. Figure 4 illustrates the recovery of the phantom distribution using 32 measured projections, with (a) 10% simulated rms error in phases, (b) 10% simulated rms errors in transverse stretching, (c) 10% phase and 10%
FIG. 3. (Color) Recovery of the phase-space density distribution of an actual beam. Different numbers of measured and interpolated projections are used for the Y-Y 0 tomographic recovery. (a) 16 measured /16 interpolated, (b) 32/32, (c) 32/64.
122801-3
122801-3
PRST-AB 6
ELECTRON BEAM PHASE-SPACE MEASUREMENT USING . . .
122801 (2003)
FIG. 4. (Color) Y-Y 0 tomographic recovery of the phantom phase-space distribution using simulated angular and scale errors. (a) 10% phase error, (b) 10% stretch error, (c) combined 10% phase and 10% stretch errors.
stretching. We conclude that the rotation phase error should not exceed 10%. III. THE EXPERIMENTAL SETUP As we indicated earlier, the goal of this work is to analyze the phase space of the electron beam produced by the photocathode rf gun. We were able to get a projection of the six-dimensional phase space on the planes y-y0 , x-x0 as well as measure y-y0 for different longitudinal slices of the beam. We start by explaining the measurement of the y-y0 plane for the whole beam. The schematic layout of the ATF acceleration and transport lines that were used in the tomographic reconstruction in that case are presented in Fig. 5. A 5 MeV electron beam is produced by a laserphotocathode rf gun. A linear emittance-compensation solenoid, located immediately after the rf gun, controls
the phase-space distribution of the electron beam. Two rf linac sections with independent phase control accelerate the beam from 5 MeV to approximately 50 MeV. For the tomographic measurements we used a beam with typical parameters of 0.5 nC charge, 50 MeV beam energy, and 5 ps pulse length. The H straight line with nine quadrupoles was used to generate rotations (phase advance) without a change in the beam size (constant optical functions) at the BPM1 beam monitor. The recovery procedure determines the phase-space distribution at linac exit. The use of a nine quadrupole transport matrix allows us to keep the beam size constant and have a beam waist at the screen. This constant size is important for a dependable measurement. The transport matrix can be expressed using amplitude and phase optical functions at the entrance and exit of the transport channel (�0 ; �0 ; �0 and �; �; �; �� � � � �0 ):
s������� �cos�� � �0 sin��� � M� 1 �0 � � f�� � �0 � cos�� � �1 � ��0 � sin��g Simplifications to the reconstruction math from having a beam waist and a constant beam size at the BPM (beam profile monitor) are obvious. In addition, the constant beam size on the screen minimizes screen response linearity problems and eases the dynamic range and background subtraction problems. Following a study of various screens [9] with respect to sensitivity, saturation level, and resolution, we opted for a
�0 sin�� �0 �
�cos�� � � sin���
� :
phosphor screen and a beam spot size on the order of 1 mm. Gauss meters were installed into each of the nine quadrupoles. Noise in the magnet power supplies was detected and fixed. The next important step was to achieve agreement between calculated and measured transport matrices. We achieved a fitting agreement better then 10% after combining measurements of the beam sizes on four monitors
FIG. 5. (Color) Schematic layout of the ATF accelerator system components used in the tomographic analysis.
122801-4
122801-4
PRST-AB 6
V. YAKIMENKO et al.
in the H line, knowledge of BPM resolution, quadrupole current setting, and Gauss meter data. Beam size measurements on multiple beam-destructive monitors and tomographic scans are multishot measurements. That imposes tough requirements on the stability of components. A phase measurement system was commissioned to track the phases of the laser, rf gun, and LINAC. Shot-to-shot jitter was tracked to the component level and addressed by a combination of better shielding, careful component placement, and cable routing. Long-term drifts were addressed by placing critical components into a thermally stabilized environment with an improved level of control. For instance, the klystrons, modulators, and charging power supplies are enclosed in a typical air-conditioned room but the laser oscillator and low-level rf control modules require a higher level of thermal stability and were placed into separately control stabilization boxes inside an air-conditioned room. All of the above measures allowed us to improve long-term phase stability by approximately a factor of 10. A feedback system allows further compensate for residual phase drifts and during measurements we typically see combined phase jitter in the range of 0:5 –1 . All of these improvements in stability were critical to the success of the multidimensional phase-space density measurement. IV. COMPUTER CONTROL SYSTEM The beam tomography application uses three subsystems of the Accelerator Test Facility’s computer network: (1) the main control system and its peripherals, (2) a PCbased video frame grabber, and (3) an additional PC on which the tomography application code resides. Figure 6 shows a schematic representation of the hardware used in this project. The tomography computer holds and executes all the actual logic needed to carry out a measurement. Like the
122801 (2003)
frame grabber PC, it was first programmed using Visual C�� under Windows NT. Its program, called ‘‘TOMO,’’ orchestrates the step-by-step actions needed to complete a measurement sequence, directing the main control VAX to manage facility hardware on its behalf. In this sense, the main control computer and the frame grabber PC are slave devices to the tomography PC. Once authorized, the tomography application has complete access to the accelerator database. By sending and receiving socket messages, values can be written to or read from the database, in turn signaling detached server processes to implement the desired action. These messages and acknowledgements mimic the actions a human operator would follow in making a measurement: setting and verifying magnet current, inserting and retracting beam profile monitors, switching video cameras to the frame grabber, requesting image statistics and projections, etc. The tomographic measurement can be broken into a few steps. The first step of the tomographic analysis is a measurement of the initial conditions of the electron beam at the linac’s exit. The variation of the beam size as a function of current in the first triplet is used to match the optical functions in two directions. In the first step, the graphics window shows the beam size in the X and Y planes as a function of the triplet current. One can observe the fluctuations of the beam size and get a measure of the stability of the system. In the second step, we calculate tunes for the justmeasured initial conditions of the beam. A simplex method is used to match the required phase advance and keep the electron-beam conditions at the end of the transport line nearly constant. At this stage, the graphical window shows the variation of the optical functions versus position along the transport line for each selected value of the phase advance. The third step is the measurement of the beam projections for the tunes calculated in the previous step. The
FIG. 6. (Color) Schematic representation of the computer hardware used in this project.
122801-5
122801-5
PRST-AB 6
ELECTRON BEAM PHASE-SPACE MEASUREMENT USING . . .
122801 (2003)
FIG. 7. (Color) Gaussian derived directly from the laser output. (a) The laser intensity profile, (b) the electron beam profile at HPOP-UP1 location, (c) the tomographic recovery of the electron beam’s transverse phase space.
graphics output window shows the measured projections in the X and Y planes for a particular tune. In the last step we reconstruct the phase-space distribution from the measured projections. In this step the graphics window presents the recovered distribution in X-X0 and Y-Y 0 phase spaces. The program that carries out these operations required more then one thousand lines of the C�� code. This program was replaced later on by less than three pages of MATHCAD worksheets. That transition became possible after the implementation at the ATF of a Win socket library interface to MATHCAD [10]. Thanks to the highlevel math expression in the MATHCAD language, we can now concentrate on and clearly see the physics rather than programming issues. V. STUDY OF PHASE-SPACE DISTRIBUTION DEPENDENCE ON THE TRANSVERSE CHARGE DENSITY A. Application of phase-space tomography to beam dynamics The laser-photocathode rf gun presents a unique platform to the study and manipulation of the electron-beam distribution in phase space. The laser intensity profile on the cathode controls the electron-beam charge distribution. This technique may lead to nonlinear emittance
corrections and to possible improvements in the brightness of electron guns. Normal beam propagation in laser systems consists of Gaussian or near Gaussian profiles transmitted through optics, amplification, and harmonic conversion processes. While convenient to manipulate, and analytically simple to model, other profiles can be derived from this in a number of ways. Here, we will consider only two: clipping with hard apertures and attenuation with a radially varying intensity filter. In both methods high loss occurs because of the spatially varying removal of energy from the beam, which may be contrasted with techniques involving phase modulation of the beam to achieve the desired profiles. The simplest case will be a Gaussian derived directly from the laser output (Fig. 7). Expanding the Gaussian beam and cutting the tails of the distribution with an iris diaphragm can achieve a more uniform profile. This approach is attractive because of the simplicity of the configuration, since almost all lasers already have adjustable irises in place as alignment fiducials. A trade-off exists between increased flatness of the profile and lower transmission of energy as the size of the aperture decreases (Fig. 8). A final, and only slightly more complex case, is to place a central obstruction in the beam path in combination with the iris to produce the annular profile (Fig. 9).
FIG. 8. (Color) Gaussian with increased flatness. (a) The laser intensity profile, (b) the electron beam profile at HPOP-UP1 location, (c) the tomographic recovery of the electron beam’s transverse phase space.
122801-6
122801-6
PRST-AB 6
V. YAKIMENKO et al.
122801 (2003)
FIG. 9. (Color) ‘‘Donut’’ distribution. (a) The laser intensity profile, (b) the electron beam profile at HPOP-UP1 location, (c) the tomographic recovery of the electron beam’s transverse phase space.
More complex profiles are of course possible using binary elements that either fully transmit or fully block portions of the beam, but no further need was seen for such profiles. These three profiles were used in the electron-beam tomography measurements and they demonstrate the effect of laser intensity profiles on the beam phase space. In the following three figures we present the laser transverse distribution, electron-beam transverse distribution and tomographic recovery of the electronbeam phase space for the three laser intensity distributions described above. The tomographic analysis demonstrates clearly that the Gaussian with increased flatness presents the best beam brightness (the smallest area in transverse phase space) of the three measured distributions. The beam intensity used in these measurements was not so large that significant phase-space distortion would be expected for a nearly flat radial charge distribution. In future experiments we will study higher beam charges and attempt to correct the emittance by modifying the charge distribution— a nonlinear emittance correction.
B. Transverse phase-space tomography with longitudinal slice analysis The tomographic reconstruction of transverse phase space may be combined with the measurement of a longitudinal slice [2], to produce the transverse phase-space distribution of a longitudinal slice. This leads to a measurement of the five-dimensional phase-space density distribution in (X; Px ; Y; Py ; Z). For this purpose we introduce a linear energy chirp by dephasing the second linac section and then select a longitudinal slice of the beam by the slit (HES), located (contrary to the naming convention) in the dispersive F line. Tomographic measurements of a slice was done at GPOP-UP4 in the Y-Y 0 plane in one of the experiment hall beam lines downstream of another dipole (e.g., FD2), and are dispersion free. Three 1.5 ps slices were selected out of 6 and 9 ps well optimized electron beams to analyze their transverse phase-space distribution (see Fig. 10 and Table I). Approximately 100 pC of the charge were measured for the front and end slices and 150 pC for the middle slice.
FIG. 10. (Color) Vertical phase-space density distribution of 1.5 ps slices selected out of 9 ps, 0.8 nC (top sequence) and 6 ps, 0.6 nC (bottom sequence) for carefully optimized electron beams. From left to right: front, middle and tail slices of the beam.
122801-7
122801-7
PRST-AB 6
ELECTRON BEAM PHASE-SPACE MEASUREMENT USING . . .
122801 (2003)
TABLE I. Statistical property of the vertical phase-space density distribution analyzed for the slices shown in Fig. 10. Normalized emittance, " �m Front slice Middle slice End slice Front slice Middle slice End slice
0.8 nC
0.6 nC
The normalized emittance of each slice was measured on the order of 1 �m. The emittance of the whole beam was measured at the level of 1:8 � 0:2 �m for 0.6 nC and 3:3 �m for 0.8 nC beams. The measured phase-space density profiles clearly indicate that the orientation in phase space of the beam’s front and tail slices is closer than that of the middle slice. That suggests that further emittance improvement on the order of 30% can be achieved by improved emittance compensation, possibly by shaping of the longitudinal laser profile. The difference in the emittance between 0.6 and 0.8 nC beams can be explained (based on phase-space pictures of the slices) by different contributions of the tail part. The total emittance is dominated by the particles in the tail of this relatively long 0.8 nC bunch. Of particular significance is the fact that the emittance of the individual slices was on the order of 1:5 �m. It indicates that the emittance is limited not only by the transverse-longitudinal correlations (following imperfect emittance correction), but by other emittance-growth mechanisms. The existence of such effects is well known. One example is the effect of nonuniformity of the transverse electron density distribution, caused by either the laser profile or cathode quantum efficiency distribution. These effects have not been given sufficient attention in the past, in part due to the lack of detailed measurements of the beam distribution in phase space. Shorter slices [11] might prove better, but requirements on the rf stability due to the multishot nature of the tomography technique are not currently achievable at ATF. VI. CONCLUSION We have successfully implemented a high-resolution transverse phase-space tomographic technique and combined it for the first time with the slice-selection technique. The result is unprecedented visualization of the formation of emittance in the rf photoinjector, a device that plays a crucial role in state-of-the-art devices such as x-ray FELs. Important components of this work were error analysis and control-system integration. The latter dramatically speeded up the measurements and allowed confidence in the reconstruction of high-resolution
122801-8
1.5 2.4 2.3 1.3 1.9 1.7
Correlation, 1
hxpi "
0.47 0.48 0.2 0.48 0.51 0.4
phase-space density distributions. This transformed the tomographic phase-space reconstruction from a demonstration experiment into a very useful tool for the understanding and optimization of photoinjectors. We conclude that the source of emittance in photoinjectors is not limited just to transverse-longitudinal correlations (following imperfect emittance correction), but has an important component related to nonuniform quantum efficiency and laser illumination of the photocathode. The effect of the nonuniform illumination is shown clearly in tomographic analysis with nearly uniform, Gaussian and donut laser distributions. ACKNOWLEDGMENTS The measurements done in this study were carried out in the Brookhaven National Laboratory’s Accelerator Test Facility, using a laser-photocathode rf gun followed by a 50 MeV electron linac.
[1] J. S. Fraser, R. L. Sheffield, and E. R. Gray, Nucl. Instrum. Methods Phys. Res., Sect. A 250, 71 (1986). [2] X. Qiu, K. Batchelor, I. Ben-Zvi, and X. J. Wang, Phys. Rev. Lett. 76, 3723 (1996). [3] J. C. Gallardo, BNL Report No. 522246, 1990. [4] J. Radon, Ber. Verh. Saechs. Akad. Wiss. Lepzig, Math.Phys. Kl. 69, 262 –277 (1917). [5] S. I. Tetelbaum, Bull. Kiev Politechnic Inst. 21, 222 (1956). [6] R. N. Bracewell and A. C. Riddle, Astron. J. 150 427– 434 (1967). [7] P. Gilbert, J. Theor. Biol. 36, 105–117 (1972). [8] W. Swindell and S. Webb, in The Physics of Medical Imaging, edited by S. Webb (IOP, London, 1992), pp. 98– 127. [9] A. Murokh et al., in The Physics of High Brightness Beams (World Scientific, Singapore, 2000), p. 564. [10] R. Malone, X. J.Wang, V. Yakimenko, ‘‘Data transfer in MathCAD,’’ Scientific Computing and Instrumentation, April 2001 [www.scimag.com]. [11] W. Graves et al., in Proceedings of the 2001 Particle Accelerator Conference, Chicago, IL (IEEE, Piscataway, NJ, 2001), pp. 1786 –1788.
122801-8