arXiv:cond-mat/0502175v1 [cond-mat.mes-hall] 7 Feb 2005. Electron ... Hall probe magnetometer. ..... [13] W. Wernsdorfer, A. Müller, D. Mailly, and B. Barbara,.
Electron paramagnetic resonance detected via magnetization measurements K. Petukhov1,2 , W. Wernsdorfer1 , A.-L. Barra2 1
arXiv:cond-mat/0502175v1 [cond-mat.mes-hall] 7 Feb 2005
2
Laboratoire Louis N´eel, associ´e ` a l’UJF, CNRS, BP 166, 38042 Grenoble Cedex 9, France Grenoble High Magnetic Field Laboratory, CNRS, BP 166, 38042 Grenoble Cedex 9, France (Dated: February 5, 2005)
Presented are magnetization measurements on a crystal of Fe8 single-molecule magnets using a Hall probe magnetometer. Irradiation with microwaves at frequencies of 92 and 110-120 GHz leads to the observation of electron paramagnetic resonance (EPR) detected via magnetization measurements. A quantitative analysis of the results are introduced by means of the spin temperature. It is shown that pulsed microwave experiments allow a better control over the spin excitation. PACS numbers: 75.50.Xx, 75.60.Jk, 75.75.+a, 76.30.-v
Single-molecule magnets (SMM) are the final point in the series of smaller and smaller units from bulk matter to atoms. Up to now, they have been the most promising candidates for observing quantum phenomena because they have a well-defined structure with wellcharacterized spin ground state and magnetic anisotropy. These molecules can be regularly assembled in large crystals where all molecules often have the same orientation. Hence, macroscopic measurements can give direct access to single molecule properties. High-frequency electron paramagnetic resonance (HFEPR) has been extensively employed to determine the magnetic anisotropy of SMMs [1, 2, 3, 4, 5, 6]. The single-pass HF-EPR method [1, 2] measures resonance peaks corresponding to transitions between different spin quantum levels. A complete set of resonance peaks at different frequencies allows the determination of the spin Hamiltonian parameters. A more sensitive cavity perturbation HF-EPR technique [3] allows in addition line shape analysis [4, 5, 6]. The difficulties of these HFEPR spectroscopy techniques concern the control over the electromagnetic environment of the sample. The use of overmoded cylindrical resonators at high frequencies does not always provide excited modes in compliance with an EPR geometry where the microwave magnetic field is perpendicular to the applied magnetic field. Undesirable instrumental effects like leaks, standing waves, and amplitude-phase mixing [7, 8] can produce unaccounted contributions to the HF-EPR spectrum and its background, complicating consistent and straightforward line shape analysis. Another issue is an inability to control the microwave power exposed to the sample. Hence, the power dependence of line widths and line shapes has not been qualitatively and systematically studied. Another powerful EPR tool for the SMM studies is the frequency-domain magnetic resonance spectroscopy (FDMRS) [9, 10, 11]. In this communication we describe a complementary EPR method which combines high-sensitivity magnetization measurements together with microwave absorption measurements [12, 13, 14, 15, 16]. The magnetization detection can be a Hall-probe magnetometer [12, 14, 15],
a micro-superconducting quantum interference devise (micro-SQUID) [13], a standard SQUID [16] or a vibrating sample magnetometer [17]. The data of this paper were obtained with a Fe8 single crystal placed into a Hall-probe magnetometer with microwave radiation, thus having a simple and affordable possibility for simultaneous magnetization and EPR-like measurements. This approach obviates several experimental difficulties of cavity-employed HF-EPR-spectroscopy mentioned above and controls better the electromagnetic environment of the sample. Based on a Hall-bars magnetometry, our technique exhibits an extraordinary sensitivity being suitable for measurements of single micrometersized crystals. Another advantage is that we can pulse microwave radiation down to nanosecond time scales without dealing with a lifetime of cavity modes at submillimeter wavelength frequencies, where high sensitivity can be achieved only in expense of a high Q-factor. When not limited by the microwave source and waveguide cutoff frequencies, we are able to perform broadband microwave measurements and employ concurrently two different microwave frequencies for pulsed pump-and-probe measurements. Finally, our technique allows us to get easily normalizable spectra and introduce a quantitative analysis of the results by means of the spin temperature. The measurements were performed by using a magnetometer consisting of several 10 × 10 µm2 Hall-bars [12] on top of which a single crystal of Fe8 was placed with an easy axis approximately parallel to the magnetic field B. The sample dimensions were 150 × 100 × 30 µm3 . The Fe8 crystals were synthesized following Weighart’s method [18]. Note that much smaller crystals could be used without loosing much sensitivity. The magnetometer, placed into the commercial 16 T superconducting solenoid, was combined with a microwave circuit consisting of a continuous wave Gunn diode, an isolator, and a calibrated attenuator. Pulsed radiation was achieved by implementing a commercial SPST fast-PIN-diode switch with a switching time of less than 3 ns. The microwave radiation was guided and focused to the sample using an oversized circular waveguide. Having two different Gunnoscillators with output power of 30 mW, we were able
120
-3
-4
-5
-2 -3 t o
-4 t o
-5 t o
-6
-6 t o
100
-7 t o
-7
110 -8 t o
Frequency (GHz)
2
D = -0.297 K E = 0.046 K
90 0
1
2
B (T)
3
4
5
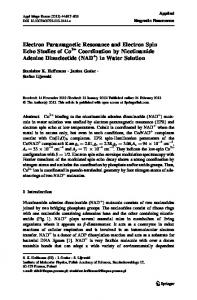
FIG. 2: Field positions of the microwave absorption peaks at several frequencies (dots). Solid lines represent the fit to the experimental data obtained by diagonalizing the effective spin Hamiltonian [1, 2, 19].
FIG. 1: (a) Magnetization of Fe8 as a function of magnetic field at different temperatures. The curves are normalized to the saturation magnetization value Ms . The solid curves represent the data measured from 2 K to 20 K in steps of 1 K. (b) Typical EPR-like absorption spectra at different temperatures at continuous wave frequency fCW = 118 GHz. (c) Spin temperature TS versus applied field B at several cryostat temperatures T , calculated using the mapping procedure described in the text.
to perform measurements at fixed frequency of 92 GHz and at several frequencies in the frequency range of 110120 GHz. The measurements were done in the temperature range from 1.4 to 50 K, with a temperature stability of 0.05 K. Fig. 1a shows the temperature dependence of magne-
tization of Fe8 versus magnetic field at several temperatures from 1.4 to 50 K. When the sample is exposed to continuous microwaves (CW), the magnetization curves show resonant absorption peaks, as depicted in Fig. 1b for the frequency of 118 GHz. Similarly to HF-EPR spectroscopy, absorption of microwave radiation takes place at certain field values at a given frequency, when the microwave frequency matches the energy difference between two energy states with the quantum number mS . The nearly evenly spaced absorption peaks can be attributed easily to the appropriate transitions (see Fig. 1b). At 118 GHz the ground state resonance (transition from mS = −10 to −9) occurs close to zero field (at B = 0.2 T) and is hardly visible on the slope of rapidly increasing magnetization. As magnetic field goes to zero, the magnetization also goes to zero, and hence the sensitivity of detection of absorption peaks goes to zero as well. Therefore, we need to perform a transformation of the magnetization to a physical quantity which does not depend on the magnetic field B. Such a quantity can be obtained when the absorption spectra (Fig. 1b) are mapped on the magnetization curves (Fig. 1a) measured at different temperatures. For each magnetization point of the absorption spectra one finds, at the corresponding field, the temperature TS that gives the same magnetization measured without microwave radiation (Fig. 1a). The temperatures in between the measured once were obtained with an interpolation. A typical result of such a mapping is depicted in Fig. 1c. TS can be called spin temperature because the irradiation time is much longer than the lifetimes of the energy levels of the spin system which were found to be around 10−7 s [20]. The phonon relaxation time Tph from the crystal to the heat bath (cryostat) is much
3
tPW
M0 ∆M MPW 0
10
20
30
40
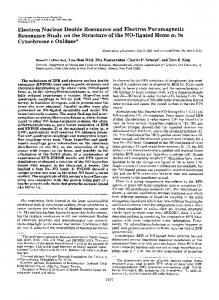
Time (ms) FIG. 3: Typical oscillogram of a pulsed experiment. The magnetization was measured as a function of time for a microwave pulse length of tPW = 10 ms.
longer (typically between milliseconds and seconds [21]). The spin and phonon systems of the crystal are therefore in equilibrium. Fig. 2 shows the field positions of microwave absorption peaks at several frequencies. These data allow the determination of the crystal field parameters D = −0.297 K and E = 0.046 K of the effective spin Hamiltonian of Fe8 [1, 2, 19]. Our result is very close to the values, obtained by HF-EPR, inelastic neutron scattering (INS), and FDMRS techniques [1, 10, 22]. It is important to note that the obtained spin temperatures TS are much larger than the cryostat temperature T . This is associated to a strong heating of the spin system, especially at low T . In order to reduce this heating we need to perform low-power experiments. The simplest way to reduce the power of CW microwaves is to introduce an attenuator to the microwave circuit. This solution reduces however the sensitivity of absorption detection. A more advanced way is to use a pulsed microwave (PW) radiation. In addition, this method might provide information about the spin-lattice T1 and spin-spin T2 relaxation times. The microwave radiation was pulsed with a fast-PIN switch with a switching time of less than 3 ns. The response time of our magnetometer can also be optimized down to nanoseconds. The time evolution of the Hall voltage was detected with a fast digital oscilloscope Tektronix TDS3054 with a 500 MHz bandwidth and 5 GS/s sample rate. The scheme of the pulsed measurements is depicted in Fig. 3. The bottom part of Fig. 3 shows the data collected during such an experiment with a pulse length of tPW = 10 ms. The magnetization before and at the end of the pulse has a value M0 and MPW , respectively. At the first milliseconds of the pulse, the magnetization rapidly decreases and starts to saturate. A complete saturation is observed only for very long pulses of several seconds. After the pulse the magnetization
FIG. 4: (Color online) (a) Magnetization variation ∆M = M0 − MPW at the frequency of 118 GHz and the temperature of 2 K as a function of magnetic field. (b) Spin temperature as a function of magnetic field calculated from ∆M in (a). The pulse lengths in both figures are 10 ms, 5 ms, 2 ms, 1 ms, 500 µs, 200 µs, 100 µs, 50 µs, 20 µs, 10 µs, 5 µs, 2 µs, and 1 µs , from the top to the bottom.
increases back to the initial value M0 . The time constants of activation M0 → MPW and consequent relaxation MPW → M0 are connected to the relaxation times T1 , T2 , and Tph . Precise time-resolved experiments are currently in progress. Figs. 4a and 5a show the difference ∆M = M0 − MPW as a function of magnetic field at temperatures of 2 and 10 K. The pulse length was varied from 1 µs to 20 ms. In contrast to the CW experiments, the PW method can successfully resolve absorption peaks near zero field. Analogous to CW experiments, the PW data can be converted to the spin temperature TS (Figs. 4b and 5b). The spin temperature curves show several interesting features. First of all, the obtained spin temperatures TS are much closer to the cryostat temperature T than for CW experiments. The peak positions of CW and PW are identical. The line widths and shapes are depending on the pulse length. At temperatures above 5 K there are small but clearly pronounced peaks between the main absorption peaks. Similar peaks were observed in HF-EPR spectra of Fe8 and ascribed to the presence
4 the Hall probes. M. Dressel (University of Stuttgart) kindly loaned some of the equipment used for this study.
FIG. 5: (Color online) (a) Magnetization variation ∆M = M0 − MPW at the frequency of 118 GHz and the temperature of 10 K as a function of magnetic field. (b) Spin temperature as a function of magnetic field calculated from ∆M in (a). The pulse lengths in both figures are 20 ms, 10 ms, 5 ms, 1 ms, 200 µs, 100 µs, 20 µs, 5 µs, and 1 µs from the top to the bottom.
of the S = 9 excited state which is about 24 K above the S = 10 ground state [23]. The spin temperature curves show also a non-resonant background absorption that was also seen by standard EPR methods [4, 5, 6]. Our method might allow a quantitative investigation of this background. One possible explanation of this phenomenon implies low-lying spin states admixed with the spin ground state, called S-mixing [24]. These low-lying states can be thermally excited and thus they can contribute to the observed background. In conclusion, we describe a complementary EPR method which combines high-sensitivity magnetization measurements together with microwave absorption measurements. This configuration allows a quantitative analysis of the results by means of the spin temperature. This work was supported by the EC-TMR Network QuEMolNa (MRTN-CT-2003-504880), CNRS and Rhone-Alpe funding. A. Cornia (University of Modena) is acknowledged for providing us with Fe8 crystals, V. Mosser (Schlumberger, Utilities Technology Group) and M. Konczykowski (Ecole Polytechnique) for fabricating
[1] A.-L. Barra, P. Debrunner, D. Gatteschi, Ch. E. Schulz, and R. Sessoli, EuroPhys. Lett. 35, 133 (1996). [2] A.L. Barra, D. Gatteschi, and R. Sessoli, Phys. Rev. B 56, 8192 (1997). [3] S. Hill, J.A.A.J. Perenboom, N.S. Dalal, T. Hathaway, T. Stalcup, and J.S. Brooks, Phys. Rev. Lett. 80, 2453 (1998). [4] K. Park, M. A. Novotny, N. S. Dalal, S. Hill, and P. A. Rikvold, Phys. Rev. B 65, 014426 (2002). [5] S. Hill, S. Maccagnano, Kyungwha Park, R. M. Achey, J. M. North, and N. S. Dalal, Phys. Rev. B 65, 224410 (2002). [6] Kyungwha Park, M. A. Novotny, N. S. Dalal, S. Hill, and P. A. Rikvold, Phys. Rev. B 66, 144409 (2002). [7] M. Mola, S. Hill, P. Goy, , and M. Gross, Rev. Sci. Inst. 71, 186 (2000). [8] R. S. Edwards, S. Hill, P. Goy, R. Weylde, and S. Takahashi, Physica B 346-347, 211 (2004). [9] A. A. Mukhin, V. D. Travkin, A. K. Zvezdin, S. P. Lebedev, A. Caneschi, and D. Gatteschi, EuroPhys. Lett. 44, 778 (1998). [10] A. Mukhin, B. Gorshunov, M. Dressel, C. Sangregorio, and D. Gatteschi, Phys. Rev. B 63, 214411 (2001). [11] J. van Slageren, S. Vongtragool, B. Gorshunov, A. A. Mukhin, N. Karl, J. Krzystek, J. Telser, A. M¨ uller, C. Sangregorio, D. Gatteschi, and M.Dressel, Phys. Chem. Chem. Phys 5, 3837 (2003). [12] L. Sorace, W. Wernsdorfer, C. Thirion, A.-L. Barra, M. Pacchioni, D. Mailly, and B. Barbara, Phys. Rev. B 68, 220407(R) (2003). [13] W. Wernsdorfer, A. M¨ uller, D. Mailly, and B. Barbara, EuroPhys. Lett. 66, 861 (2004). [14] M. Bal, J. R. Friedman, Y. Suzuki, K. Mertes, E. M. Rumberger, D. N. Hendrickson, Y. Myasoedov, H. Shtrikman, N. Avraham, and E. Zeldov, Phys. Rev. B 70, 100408 (2004). [15] E. del Barco, A. D. Kent, E. C. Yang, and D. N. Hendrickson, Phys. Rev. Lett. 93, 157202 (2004). [16] B. Cage, S. E. Russek, D. Zipse, J. M. North, and N. Dalal, unpublished (2005). [17] G. A. Candela, J. Chem. Phys. 42, 113 (1965). [18] K. Weighart, K. Pohl, I. Jibril, and G.Huttner, Angew. Chem. Int. Ed. Engl. 23, 77 (1984). [19] A. Abragam and B. Bleaney, Electron paramagnetic resonance of transition ions (Clarendon Press, Oxford, 1970). [20] W. Wernsdorfer, A. Caneschi, R. Sessoli, D. Gatteschi, A. Cornia, V. Villar, and C. Paulsen, EuroPhys. Lett. 50, 552 (2000). [21] I. Chiorescu, W. Wernsdorfer, A. M¨ uller, H. B¨ ogge, and B. Barbara, Phys. Rev. Lett. 84, 3454 (2000). [22] R. Caciuffo, G. Amoretti, A. Murani, R. Sessoli, A. Caneschi, and D. Gatteschi, Phys. Rev. Lett. 81, 4744 (1998). [23] D. Zipse, J. M. North, N. S. Dalal, S. Hill, , and R. S. Edwards, Phys. Rev. B 68, 184408 (2003). [24] S. Carretta, E. Liviotti, N. Magnani, P. Santini, and G. Amoretti, Phys. Rev. Lett. 92, 207205 (2004).