Jan 24, 2012 - The electronic structure of the ternary RPtIn (R = La, Ce) compounds, which crystallize in the hexagonal. ZrNiAl-type structure, was studied by ...
Vol.
122
ACTA PHYSICA POLONICA A
(2012)
No. 1
Electronic Structure of CePtIn and LaPtIn Compounds a
b
A. Jezierski , B. Penc , A. Szytuªa a
b
c
and A. Winiarski
Institute of Molecular Physics, Polish Academy of Sciences, M. Smoluchowskiego 17, 60-179 Pozna«, Poland b
M. Smoluchowski Institute of Physics, Jagiellonian University, W.S. Reymonta 4, 30-059 Kraków, Poland c A. Cheªkowski Institute of Physics, University of Silesia, Uniwersytecka 4, 40-007 Katowice, Poland
(Received January 24, 2012; in �nal form April 17, 2012) The electronic structure of the ternary RPtIn (R = La, Ce) compounds, which crystallize in the hexagonal ZrNiAl-type structure, was studied by X-ray photoelectron spectroscopy measurements and calculation using the ab initio methods (linear mu�n-tin orbital in the atomic sphere approximation, full potential linear mu�n-tin orbital, full potential linear orbital). The results showed that the valence band in these compounds is formed by the Pt 5d and In 5s and 5p states. The band calculations with spin�orbit coupling have shown that the Ce 4f peaks consist of two peaks above the Fermi level that correspond to the Ce 4f7/2 and 4f5/2 doublet and wide peaks corresponding to the La 4f states. The analysis of Ce 3d spectra on the basis of the Gunnarsson�Schönhammer model gives hybridization of 4f orbitals with the conduction electron band equal to 170 meV. PACS: 71.20.�b, 71.20.Lp, 71.27.+a, 79.60.�i
1. Introduction
The equiatomic ternary compounds CePtIn and LaPtIn crystallize in the hexagonal ZrNiAl structure (space group P ¯ 62m) [1]. CePtIn is classi�ed as dense Kondo material [2]. Heat capacity (Cp ) measurements of CePtIn yield Cp /T ≈ 1 J/(K2 mol) at 60 mK that indicates heavy fermion properties. The speci�c heat and electrical resistivity studies indicate the absence of magnetic order up to 50 mK [3]. Temperature dependence of the electrical resistivity of LaPtIn indicates the metallic character and results for (Ce1−x Lax )PtIn system indicate its change of the properties with increasing La content [4]. In the CeTIn compounds with increase in the unit cell volume the magnetic properties change from the Pauli paramagnet for CeNiIn to antiferromagnetical order found in CePdIn (TN = 1.8 K) and CeAuIn (TN = 5.7 K). Simultaneously, a decrease in the Kondo temperature from TK = 94 K for CeNiIn to 3.3 K for CePdIn was reported [5]. The CePtIn compound with TK = 11 K and no magnetic order lie between those two border regions. Determination of the parameters of the electronic structure of this compound is interesting for explanation of the described changes in physical properties. The photoemission method (PES) is considered to be the most successful way to study the nature of the Ce 4f states [6]. The main aim of our investigations was to �nd correlations between the data on the electronic structure of the investigated compounds and hybridization of the 4f level in the photoemission spectra of the valence band (VB). In practice, the small cross-section of the 4f
states comparing to the d ones makes the analyses very di�cult when using classical photoemission. More reliable information about the 4f states can be achieved using resonant photoemission. Also the Ce 3d core-level photoemission lines have been widely used to diagnose hybridization strength of the 4f levels in the Ce-based systems [6]. In this work we present the data concerning the electronic structure of RPtIn (R = La, Ce) compounds supported by ab initio calculations and PES results. 2. Experimental details
Polycrystalline samples of RPtIn (R = La, Ce) compounds were obtained by arc melting of stoichiometric amounts of the elements (Merck AG: Ce and La of 99.9% purity, Pd and In of 99.99% purity) under a high-purity argon atmosphere on a water-cooled copper hearth, using a titanium-zirconium alloy as a getter. In order to ensure good homogeneity the buttons were turned over and remelted several times. The �nal weight losses were lower than 0.1%. Subsequently the samples were annealed in evacuated quartz tubes at 800 ◦C for one week. The quality of the products was checked by X-ray powder di�raction using Philips PE-3710 apparatus (Cu Kα radiation) at room temperature. All of the re�ections were indexed within the hexagonal structure of ZrNiAl-type. For processing the collected data the Rietveld-type program Fullprof was used [7]. The determined structure parameters for RPtIn (R = La, Ce) compounds are in good agreement with the previous data [1].
(212)
Electronic Structure of CePtIn and LaPtIn Compounds The X-ray photoelectron spectra (XPS) were obtained at room temperature using a Multipurpose Electron Spectrometer PHI5700/660 with monochromatised radiation Al Kα (hν = 1486.6 eV) radiation source and the overall resolution of 0.3 eV. Binding energies were referred to the Fermi level (EF = 0). The spectrometer was calibrated using the Cu 2p3/2 (932.5 eV), Ag 3d5/2 (368.1 eV) and Au 4f7/2 (84.0 eV) core-level photoemission spectra. Surface of the samples was mechanically cleaned by scraping with a diamond �le in a preparation chamber under high vacuum conditions (10−9 mbar). The Shirley method was used to subtract background; the experimental spectra obtained in this manner were numerically re�ned using the 80% Gaussian and 20% Lorentzian peak shape [8].
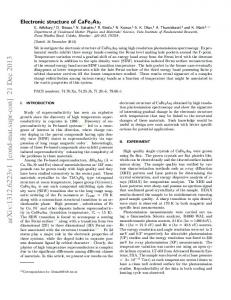
Fig. 1.
213
Band structure of CePtIn.
TABLE I Structural parameters of CePtIn and LaPtIn at room temperature. Compound a [Å] c [Å] a/c V [Å3 ] R 3g (x, 0, 1/2) In 3f (x, 0, 0) Pt1 1b (0, 0, 1/2) Pt2 2c (1/3, 2/3, 0)
LaPtIn 7.823(1) 4.165(1) 1.878(1) 220.74(11) 0.586(1) 0.249(1)
CePtIn 7.706(1) 4.097(1) 1.881(1) 210.69(10) 0.0.588(1) 0.251(1)
The electronic density of states (DOS) of RPtIn (R = La, Ce) has been calculated by the spin-polarized self-consistent tight binding linear mu�n-tin orbital (TB LMTO) method in the atomic sphere approximation (ASA) [9, 10] using the structural parameters from Table I. The scalar relativistic approximation for band electrons and the full relativistic treatment of frozen core electrons were applied. The exchange correlation potential was assumed in the form of von Barth and Hedin [11] and gradient corrections were also included [12]. 3. Results
The calculated band structure of CePtIn is shown in Fig. 1. Above the Fermi level (0�0.5 eV) the Ce 4f state is observed. In the region of 3�4 eV the Pt 5d states is detected. On the basis of this data the density of states was calculated. The contribution from Ce or La, Pt and In and the total density of states for CePtIn and LaPtIn calculated by scalar relativistic method are shown in Fig. 2. Both methods of calculation give nearly similar DOS. Above the Fermi level (EF = 0 eV) the doublet corresponding to the Ce 4f3/2 and Ce 4f5/2 is observed. In the 3�4.5 eV regions the states of Pt 5d are detected. At 6 eV the peaks of In 5s are observed whereas In 5p states form a band between 0 and 4.5 eV. Similar DOS is observed for LaPtIn however the La 4f states form the wide peak at 2.5 eV above the Fermi level.
Fig. 2. Total density of states and the contribution from Ce or La, Pt and In to the total density of states for CePtIn (a) and LaPtIn (b) calculated in the scalar-relativistic approximation.
TABLE II Atomic concentration in RPtIn (R = La, Ce) compounds. Compound CePtIn LaPtIn
R 3d5/2 30.70 34.03
Pt 4f7/2 33.4 32.12
In 3d5/2 35.90 33.85
A. Jezierski et al.
214
The calculated values of the density of states at the Fermi level N (EF ) for both methods of calculation are shown in Table II. TABLE III Density of states at the Fermi level N (EF ) for both methods of calculations. LaPtIn CePtIn
Scalar realistic 169.9 313.2
Full relativistic 157.8 states 350.1 states
These results indicate that the increase in N (EF ) for CePtIn is caused by the Ce 4f states. The calculated occupation of the Ce 4f level is equal to 0.97. Figure 3 shows the XPS spectra of CePtIn and LaPtIn collected in a wide 0�1400 eV binding energy range, the binding energies are related to the Fermi level (EF = 0 eV). The results of the analysis of the intensity of the selected peaks corresponding to R 3d5/2 , Pt 4f7/2 and In 3d5/2 states are given in Table III. The obtained results indicate that in both compounds the ratio 1:1:1 is retained. In general, the most important data for CePtIn were obtained from three regions: VB (binding energy 0�10 eV), Ce 4d states (100�120 eV) and Ce 3d states (880�930 eV). The XPS VB for both compounds is presented in Fig. 4. These spectra present mainly the dominant contribution of the Pt states. For CePtIn this corresponds to two peaks: at 3.2 and 4.5 K. Similar two peaks at 3.2 and 4.4 eV are observed in LaPtIn. The adequate values of spin�orbit splitting are equal to 2.5 and 1.2 eV.
Fig. 3. XPS Al Kα spectra of LaPtIn and CePtIn collected at room temperature within 0�1400 eV binding energy range (Al Kα radiation).
A broad peak at 6.1 eV for CePtIn and at 6.6 eV for LaPtIn corresponds to In 5s states. Near the Fermi level two peaks at 0.5 and 2.1 eV for CePtIn and one at 0.5 and 1.9 eV for LaPtIn were observed. The peaks at 0.5 eV are connected to the 5d6s2 state where the peak at 1.9 eV for LaPtIn is connected with the In 5p state. For CePtIn the peak at 2.1 eV is probably connected with the Ce 4f and In 5p state. At about 110 eV a broad peak of the Ce 4f states can be noticed (see Fig. 5). The Ce 4d5/2 lines is decomposed into four peaks with the binding energies equal to
Fig. 4. Deconvoluted photoemission valence band spectra for LaPtIn and CePtIn.
Fig. 5. Deconvoluted Ce 4d spectrum in CePtIn and La 4d spectrum in LaPtIn.
107.9, 110.0, 112.2, and 115.0 eV. Unfortunately analysis of the structure of this peak is possible. In LaPtIn in this region two peaks corresponding to the La 4d5/2 and La 4d3/2 are observed at 102.55 and 105.85 eV and the spin�orbit splitting is equal to ∆ = 3.3 eV. These data are in good agreement with the data for the pure elements 102.5, 105.3, and 2.8 eV [13]. Figure 6 illustrates the Ce 3d XPS spectrum of the CePtIn compound. Two lines corresponding to the spin�
Electronic Structure of CePtIn and LaPtIn Compounds orbit splitting equal to 18.4 eV (3d3/2 and 3d5/2 doublets) are observed. Additionally, each line consists of two sublines corresponding to the 3d9 4f 1 and 3d8 4f 2 states. The analysis of these components was based on the Doniach� unji¢ theory [14]. Within this approach the intensity ratio r1 = I(f 2 )/[I(f 2 ) + I(f 1 )] can be calculated (I(f n ) is the integral intensity of relevant components). From r1 value it is possible to determine the coupling parameter ∆ basing on the calculations of the intensity ratio r1 as a function of ∆ previously published [6]. The coupling parameter ∆ is de�ned as πV 2 ρmax , where V is the hybridization and ρmax is the maximum of the density of conduction electron states. The value of the intensity ratio r1 is equal to 0.33 which corresponds to the ∆ parameter of 170 eV.
215
In the next step the positions of the In 4d1/2 and 4d3/2 and 3d5/2 and 3d3/2 and Pt 4f7/2 and 4f5/2 and 4d5/2 and 4d3/2 core levels were analyzed. It was shown that the values of the energy and spin�orbit splitting ∆S−O are similar for both compounds and do not change in comparison with the table values in Ref. [13] (see Table IV). 4. Summary
In this work we investigated the electronic structure of CePtIn and LaPtIn. The small di�erence in the valence band of these compounds was observed. From the 3d spectrum the hybridization parameter equal to 170 eV was determined which is close to these value reported for the isostructural CePdIn (130 eV) [5], in spite that these compounds have di�erent properties. The presented data do not give explanation of anomalous properties of CePtIn. The Ce 3d and Ce 4d spectra do not give any evidence of intermediate valence of Ce3+ in CePtIn. Acknowledgments
This work was partially supported by Ministry of Science and Higher Education in Poland under Grant no. N N202 2010 39. References
Fig. 6. Deconvoluted X-ray photoelectron spectra of Ce 3d5/2 and Ce 3d3/2 electron states in CePtIn. TABLE IV The binding energies and the spin�orbit splitting ∆S−O (in eV) in RPtIn (R = La, Ce) compounds, compared with the data for pure element.
In 4d5/2 4d3/2 ∆S−O Pt 4f7/2 4f5/2 ∆S−O Pt 4d5/2 4d3/2 ∆S−O In 3d5/2 3d3/2 ∆S−O
LaPtIn
CePtIn
16.8 17.7 0.9 71.6 74.9 3.3 314.8 331.6 16.8 443.7 451.3 7.6
16.85 17.81 1.0 71.6 74.9 3.3 314.8 331.6 16.8 443.8 451.3 7.5
Pure element [13] 16.6 17.4 0.8 71.1 74.7 3.6 314.6 331.6 17.0 443.9 451.4 7.5
The evidence of the intermediate valence of Ce ion is not clear because the Ce 3d9 4f 0 peak at 916.2 eV and the Ce 4d one connected with the f 0 �nal state near 122.5 eV are broad.
[1] R. Ferro, R. Marazza, G. Rambaldi, Z. Metallkd. 65, 40 (1974). [2] K. Satoh, T. Fujita, Y. Maeno, Y. Uwatoko, H. Fujii, J. Phys. Soc. Jpn. 56, 692 (1990). [3] Y. Maeno, M. Takahashi, T. Fujita, Y. Maeno, Y. Uwakoto, H. Fujii, T. Okamoto, Jpn. J. Appl. Phys. 26 (suppl. 3), 545 (1987). [4] F.C. Ragel, P de V. du Plessis, A.M. Strydom, J. Phys., Condens. Matter 21, 046008 (2009). [5] A. Szytuªa, B. Penc, . Gondek, Acta Phys. Pol. A 111, 475 (2007) and references therein. [6] J.C. Fuggel, F.U. Hillebrecht, Z. oªnierek, R. Lässer, Ch. Frieburg, O. Gunnersson, K. Schönhammer, Phys. Rev. B 27, 7330 (1983). [7] J. Rodriguez-Carvajal, Physica B 192, 55 (1993). [8] D.A. Shirley, Phys. Rev. B 5, 4709 (1975). [9] O.K. Andersen, O. Jepsen, M. Sob, in: Electronic Structure and Its Applications, Ed. M. Yussan�, Springer-Verlag, Berlin 1987, p. 2. [10] O.K. Andersen, O. Jepsen, Phys. Rev. Lett. 53, 2571 (1984). [11] U. von Barth, L. Hedin, J. Phys. C 5, 1629 (1972). [12] D. Hu, D.C. Langreth, Phys. Scr. 32, 91 (1985). [13] S. Hüfner, in: Photoemission Spectroscopy, Springer-Verlag, Berlin 1994, p. 453. [14] S. Doniach, M. unji¢, J. Phys. C 3, 285 (1970).