Jun 23, 2003 - ABSTRACT. The number of hot pixels on the Wide Field Channel of the Advanced Camera for Surveys will increase over the next few years as ...
Instrument Science Report ACS 2003-004
Elevated Temperature measurements of Hot Pixels Colin Cox, Max Mutchler and Doug van Orsow. June 23, 2003
ABSTRACT The number of hot pixels on the Wide Field Channel of the Advanced Camera for Surveys will increase over the next few years as radiation damage accrues. A considerable reduction in dark rate and hence hot pixel counts should result from lowering the detector temperature. When the Aft Shroud Cooling System is installed in Servicing Mission 4, temperatures as low as -85C or -90C might be available. At present we cannot significantly lower the detector temperature. We have therefore investigated the temperature response of dark rates and hot pixel counts by raising the temperature, which we did in two steps. We find that the predominant effect of a change in temperature is a simple scaling of the dark rate in each pixel. There is a 20% increase in dark rate for every degree of temperature elevation. The number of hot pixels (with more than 0.08 electrons per second) more than triples between -77C and -71.5C.
Introduction The hot pixels on the Wide Field Channel (WFC) of the Advanced Camera for Surveys (ACS) are more resistant to annealing than those on the High Resolution Channel (HRC) or those on other CCDs on HST. As described in Instrument Science Report ACS 2002-09 by Adam Riess, the number of hot pixels on WFC after several years of operation is expected to be comparable to the number affected by cosmic rays in a 1000 second exposure. The count rate, both in normal and hot pixels, is very sensitive to the temperature at which the CCD operates. Ground measurements of dark counts had shown a doubling of count rate for every 5 degree increase in temperature. Operating at the lowest available tempera-
Copyright© 1999 The Association of Universities for Research in Astronomy, Inc. All Rights Reserved.
Instrument Science Report ACS 2003-004 ture clearly has advantages. Servicing Mission 4 is intended to include the installation of an Aft Shroud Cooling System (ASCS) which includes extra radiators and Capillary Pumped Loop coolers which will enhance the cooling of the instruments. There may be the possibility of running the WFC at -85°C or even -90°C. This is subject to how well the cooling system performs and the competing heat loads of WFC3 and COS. The ACS team was therefore interested in seeing how well the WFC would perform at temperatures lower than its current operating value of -77°C. Unfortunately the current system is not capable of reducing this temperature by more than a degree or so. To investigate the temperature sensitivity of the count rate, we therefore decided to take measurements at slightly higher temperatures and then extrapolate backwards to estimate the low temperature conditions.
Method Proposal 9707 was written with special commanding to change the set point temperatures of the thermo-electric coolers in contact with the WFC CCDs. The three temperature settings were the normal -77°C and the elevated values -71.5°C and -66.7°C. At each of these temperatures two bias images straddling three 1000 second dark frames were taken. (Images to characterize charge transfer efficiency were also taken and will be the subject of a separate report.) To analyze the dark images, the usual bias subtractions and cosmic ray filtering operations were performed. Conclusions were derived from the image histograms and extracted count rates.
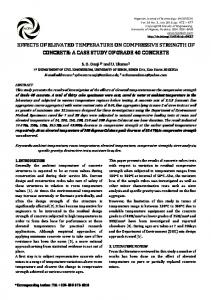
Results Figures 1 and 2 show the temperature history and the timing of the observations. A ten minute settling time was allowed following each temperature change before beginning any observations. Histograms of the count rates per pixel are shown in Figure 3. With increasing temperature there is an increase in the hot pixel tail as well as an increase in the mode of the dark count distribution. Table 1 lists the main results illustrated by these plots. The mean rate is calculated iteratively and excludes pixels differing from the mean value by more than three standard deviations. In this way we predominantly sample the normal pixels. The hot pixel count rate values all use the hot pixels defined by the -77°C threshold; the rate is measured for the same set of pixels in each case. The hot pixel number for the -66.7°C case had to be modified to allow for the fact that 5% of pixels were dropped by the on-board compression. A small irregularity may be seen in the peak of the histogram for the hottest case. This reflects the fact that the missing pixels are detected and replaced by a values equal to the local median. The factor of two compression works with no loss for the normal case and showed a negligible loss in the 71.5°C case. Any future measurements at elevated temperatures should be done without image compression, or at least should not attempt to compress by as much as a factor of two.
2
Instrument Science Report ACS 2003-004 Table 1: Hot pixel temperature dependence Mean rate
Hot Pixels >0.08 electrons/sec.
Hot pixel count rate electrons/sec.
WFC1: 2.91 × 10⁻³ WFC2: 2.80 × 10⁻³
31062 (0.4%) 31925 (0.4%)
0.69 0.64
-71.5°C
WFC1: 6.65 × 10⁻³ WFC2: 6.33 × 10⁻³
102063 (1.2%) 103184 (1.2%)
1.29 1.22
-66.7°C
WFC1: 1.50 × 10⁻² WFC2: 1.41 × 10⁻²
203400 (2.4%) 203900 (2.4%)
2.14 2.03
Temperature
electrons per sec. per pixel
-77.0°C
Analysis The temperature dependence of dark rate in CCD detectors follow the form given in Janesick, 2001, D ( T ) = C ⋅ T
1.5
⋅ exp ( – E g ⁄ ( 2kT ) ) , where T is the absolute temperature in
degrees Kelvin, k is Boltzmann’s constant, and Eg is the silicon band-gap energy given by E g = 1.1557 – 7.021 × 10
–4
2
⋅ T ⁄ ( 1108 + T ) . The three data points have been scaled to
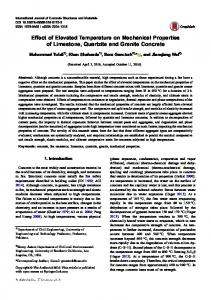
match this function. Although this is a very small sample, the fit looks very reasonable, (see Figure 4), and gives a good indication of the behavior we can expect at lower temperatures. Also shown are the results of ground measurements made on detectors belonging to earlier batches of the same design as the flown CCDs. All sets of data match the theoretical shape fairly well although the -70° and −75°C points in the ground data are suspected of being contaminated by a light leak. The total number of hot pixels is probably a more complex function of temperature since it would depend on the intensity profile and the chosen threshold, although to the extent that all pixels have the same temperature dependence we can expect similar behavior. We have analyzed the hot pixel count in the same way and shown them on the same diagram. Even though these results are approximate, it is clear that lowering the detector temperature even by a few degrees has a large impact on the dark count rate and hot pixel count. In the plausible operating temperature range, the theoretical function falls by more than 20% for every degree of temperature reduction. As a further check that we understand the temperature dependence of hot pixels we took the standard -77°C dark image and multiplied the intensity of every point by the ratio of the average intensities in the -71.5°C image to that in the -77°C image. Overlaying the histogram of this scaled image with that from the -71.5°C image, as we have done in Figure 5 shows that the hot pixel distribution is the same for each.
3
Instrument Science Report ACS 2003-004 Another way of studying the relation between the normal and elevated temperature darks is to plot the level of corresponding pixels in two images against each other. Figure 6 shows the results of this procedure. The top image compares the -71.5°C and -77°C intensities while the lower plot shows -66.7°C against -77°C. In each case the predominant effect is a simple scaling of dark rate in each pixel with temperature (i.e., there is no significant population of pixels that make a sharp transition from being relatively normal at cold temperatures to being very hot at higher temperatures; such pixels would have shown up in the top left of the panels in Figure 6).
Conclusions The temperature dependence of hot pixels is as would have been expected from theory and ground based measurements. The dark current and number of hot pixels is a very sensitive function of temperature, varying by more than 20% per degree. It will be important to consider the influence of temperature on the performance of the ACS following the installation of the ASCS. There is a limit to how much heat can be dissipated by the new radiators and it will be necessary to balance the cooling requirements of the new instruments against that of the ACS. Both because of cooling and power requirements, a campaign strategy of turning one instrument off to allow the others to operate at full efficiency may be worth considering.
Acknowledgments Thanks are due to Alan Welty for advice and commanding instructions to allow the special temperature setting. We also thank George Chapman and Alison Vick for proposal preparation and solving difficult scheduling problems in connection with these observations.
References The Projected Growth of Hot Pixels on ACS WFC, Instrument Science Report ACS 2002-03, Adam Riess, December 2002. Scientific charge-coupled devices, James R Janesick, SPIE Press Monograph Vol PM83, 2001 Status of the WFC build-4 CCDs. Marco Sirianni and Mark Clampin, August 2000, JHU/ACS Internal Report available at http://adcam.pha.jhu.edu/instrument/detectors/WFC/builds/4/Statuswfc4.pdf
4
Instrument Science Report ACS 2003-004 Day 065 Exposures Day 065 Exposures Day 065 Exposures
-60 -60
-62
-60 -62
-64
-62 -64 -64 -66
Detector Detector temperature temperature
Detector temperature
-66
-68
-70
-72
-74
Bias
-66 -68
Bias Bias
Dark
Bias
Dark Dark
CTE
Bias Bias
Bias Bias
CTE CTE
Bias
-68 -70 -70 -72 -72 -74 -74 -76 -76
-76
-78 -78
-78
-80 -809:00
10:00
11:00
12:00
13:00
14:00
9:00
10:00
11:00
12:00 Time of day 12:00 Time of day
13:00
14:00
-80 9:00
10:00
11:00
Ti
13:00
14:00
fd
Figure 1: Day 065 detector temperature profile and observation times. Day 066 Exposures Day 066 Exposures -60 -60
-62 -62
-64 -64
Detector temperature
Detector temperature
-66
-66
BiasBias
-68
-68
-70
-70
-72
-72
-74
Dark Dark
Bias Bias
Bias DarkDark Bias
CTE CTE
Bias Bias
-74
-76
-76 -78
-78 -80 12:00 -80 12:00
13:00
13:00
14:00
14:00
15:00
16:00
15:00Time of day 16:00
17:00
17:00
18:00
18:00
Time of day
Figure 2: Day 066 detector temperature profile and observation times.
5
19:00
19:00
Instrument Science Report ACS 2003-004
Figure 3: Histograms of pixel count rates at three temperatures. A threshold of 0.08 electrons per pixel per second is chosen to define hot pixels. ACS/WFC DARK COUNTS AT THREE TEMPERATURES 1000000
100000
Values > 0.08 designated as hot pixels
Counts
10000
1000 -66.7C -71.5C 100 -77C
10
1 -0.1
0
0.1
0.2
0.3
0.4
0.5
electrons per pixel per second
Figure 4: Dark rates and hot pixel counts compared with theoretical dark rate behavior. TEMPERATURE DEPENDENCE OF DARK RATES 9 7 5 4 3 2
Counts per pixel per hour
1,0009 7 5 4 3 2
100 7 5 4 3
In flight Hot pixels Ground 1 Ground 2
2
10 7 5 4 3 2
1 -85
-80
-75
-70
-65
TEMPERATURE Degrees C
6
-60
-55
-50
Instrument Science Report ACS 2003-004
COMPARISON OF SCALED PULSE HEIGHTS WITH HIGHER TEMPERATURE 1000000
100000 -77C Scaled
Counts
10000
-71.5C
Values > 0.08 designated as hot pixels
1000
100
10
1 -0.1
0
0.1
0.2
0.3
0.4
0.5
electrons per pixel per second
Figure 5: Histograms of the scaled -77°C image and the observed -71.5°C image
Figure 6: Scatter plot of count rates in corresponding pixels in pairs of images obtained at different temperatures.
7