The EMBO Journal Vol.17 No.1 pp.27–36, 1998
Solution structure of cytochrome c6 from the thermophilic cyanobacterium Synechococcus elongatus
Martina Beißinger, Heinrich Sticht, Martin Sutter1, Andrzej Ejchart, Wolfgang Haehnel1 and Paul Ro¨sch2 Lehrstuhl fu¨r Biopolymere, Universita¨t Bayreuth, D-95440 Bayreuth and 1Lehrstuhl fu¨r Biochemie der Pflanzen, Albert-LudwigsUniversita¨t, D-79104 Freiburg, Germany 2Corresponding author e_mail:
[email protected]
Cytochrome c6 is a small, soluble electron carrier between the two membrane-bound complexes cytochrome b6 f and photosystem I (PSI) in oxygenic photosynthesis. We determined the solution structure of cytochrome c6 from the thermophilic cyanobacterium Synechococcus elongatus by NMR spectroscopy and molecular dynamics calculations based on 1586 interresidual distance and 28 dihedral angle restraints. The overall fold exhibits four α-helices and a small antiparallel β-sheet in the vicinity of Met58, one of the axial heme ligands. The flat hydrophobic area in this cytochrome c6 is conserved in other c6 cytochromes and even in plastocyanin of higher plants. This docking region includes the site of electron transfer to PSI and possibly to the cytochrome b6 f complex. The binding of cytochrome c6 to PSI in green algae involves interaction of a negative patch with a positive domain of PSI. This positive domain has not been inserted at the evolutionary level of cyanobacteria, but the negatively charged surface region is already present in S.elongatus cytochrome c6 and may thus have been optimized during evolution to improve the interaction with the positively charged cytochrome f. As the structure of PSI is known in S.elongatus, the reported cytochrome c6 structure can provide a basis for mutagenesis studies to delineate the mechanism of electron transfer between both. Keywords: cytochrome c6/electron transport/ photosynthesis/protein conformation/Synechococcus elongatus
Introduction Cytochrome c6 belongs to subgroup Ic of the large family of c cytochromes which carry the heme prosthetic group covalently bound to a CXXCH-consensus motif. The histidine from this sequence and a methionine closer to the C-terminus coordinate the iron atom of the porphyrin ring. Synechococcus elongatus is a unicellular thermophilic cyanobacterium living in hot springs. Photosynthetic activity is observed with a temperature optimum of 57°C (Yamaoka et al., 1979), and cytochrome c6 on the lumenal side of the thylakoid membrane catalyzes the electron transport from the membrane-bound cytochrome b6 f © Oxford University Press
complex to photosystem I (PSI) and possibly also to the cytochrome oxidase (Pescheck, 1996). Although cytochrome c6 is the sole electron carrier in some cyanobacteria, plastocyanin is more common in green algae and completely substitutes for cytochrome c6 in the chloroplasts of higher plants (Ho and Krogmann, 1984). In cyanobacteria and green algae, where both proteins are encoded, the alternative expression of the homologous proteins is regulated by the availability of copper (Sandmann et al., 1983). Being structurally and sequentially very different, plastocyanin serves as a functional homolog of about the same size. Whereas plastocyanin is a β-sheet protein with copper as the central ion, c6 cytochromes are highly α_helical heme-containing proteins. Cytochrome c6 was shown to be the only electron carrier in S.elongatus (Sutter et al., 1995) and represents a primordial form in the evolutionary line of proteins, serving as a soluble electron carrier from cytochrome b6 f to PSI. As the structure of PSI from the same organism is known at high resolution (Krauß et al., 1996), S.elongatus appears very well suited to investigate photosynthetic electron transfer in detail, and the structure of cytochome c6 would provide the basis for mutagenesis studies similar to those carried out with plastocyanin (Haehnel et al., 1994). This will also help to understand the different interaction in cyanobacteria and plants resulting from the insertion of a positive domain in PSI in an evolutionary event (Hippler et al., 1996). The solution structure of the 2Fe2S-ferredoxin serving as soluble electron carrier from PSI to ferredoxin-NADP-oxidoreductase on the stromal side of the thylakoid membrane has already been solved by NMR methods (Baumann et al., 1996) so that the highresolution structure of cytochrome c6 presented here adds another piece to the knowledge of the structure of the photosynthetic machinery of S.elongatus. Two high-resolution X-ray structures of green algal c6 cytochromes, from Chlamydomonas reinhardtii and Monoraphidium braunii (Frazaˆo et al., 1995; Kerfeld et al., 1995), and the NMR structure of the protein from M.braunii (Banci et al., 1996) were reported, but so far no three-dimensional structure of a non-chloroplast cytochrome c6 has been described, which reacts with an essentially different mechanism at PSI (Hippler et al., 1996).
Results and discussion Sequential assignment Homonuclear two-dimensional (2D) NMR spectra of cytochrome c6 show good dispersion with amide proton and Cα proton resonances occurring between 6.11 and 9.90 p.p.m., and 1.16 and 5.58 p.p.m., respectively. Due to severe resonance overlap in some regions of the spectrum, however, it was not possible to assign the resonances completely from homonuclear 2D NMR spec-
27
M.Beißinger et al.
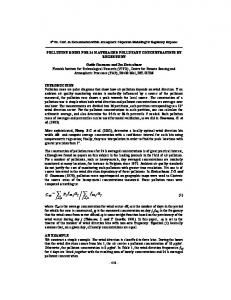
Fig. 1. Schematic representation of the experimental data indicative of secondary structural elements. 3JHN–HA coupling constants ,6.5 Hz or .9 Hz are marked by (d) or (j), respectively. In D2O, slowly exchanging amide protons (u) and proton chemical shift indices (CSI) for HA, together with 13C chemical shift indices for CA and C9, characteristic for α_helical regions, are represented by ( ). Sequential and selected medium-range NOEs are represented by bars between the coupled residues. The thickness of the bars is a measure of the NOE intensity.
tra so that isotope labeling was necessary. A combined assignment strategy was employed, relying on 3D tripleresonance through-bond correlation experiments (Kay et al., 1990) and standard homonuclear techniques (Wu¨thrich, 1986). Backbone 15N, 1H and 13C resonances were assigned with the help of HNCA, HNCOCA and HNCO experiments. Spin patterns were identified from the analysis of TOCSY and COSY spectra in H2O and D2O. The backbone assignments were cross-validated independently, and ambiguities due to overlap were resolved through complete sequential assignments obtained from the analysis of two- and three-dimensional NOESY and TOCSY experiments. All residues except Pro59 were connected by at least one of the sequential connectivites between HNi–HNi11, HAi–HNi11 or HBi– HNi11 (Figure 1). An almost complete resonance assignment including all of the heme protons was performed, except for the Hε protons of Met19, Met26, Met41, Gln38 and Gln50, the Hζ protons of Lys29, Lys33 and Lys55 and the Hδ protons of Ile48. The aromatic residues Phe10 and Tyr76 which proved to be highly solvent inaccessible exhibited restricted rotation of the rings indicated by a splitting of the respective proton resonances. There are also some quite unusual chemical shifts, especially for residues in proximity to the heme which causes large ring current effects. The complete proton, 15N and 13C backbone assignments are available as supplementary material. Information on secondary structure Four aspects of the NMR data, summarized in Figure 1, were useful in delineating information on the secondary structure of cytochrome c6: patterns of medium-range NOEs, analysis of HA, CA and C9 chemical shifts, 3J coupling constants and proton–deuterium HN–HA exchange experiments. Medium-range HN–HN(i,i12),
28
HA–HN(i,i13), HA–HN(i,i14) and HA–HB(i,i13) NOEs indicative of α-helices (Wu¨thrich, 1986) are observed for residues 2–21, 32–39, 43–52 and 67–85. Backbone HA– HN(i,i12) NOEs characteristic of 310-helical structure are also observed in the same regions, especially at the ends of the helical segments, suggesting distortion of regular α-helices. Chemical shift indexes were determined (Wishart et al., 1992; Wishart and Sykes, 1994) from differences of HA, CA and C9 chemical shifts with respect to random coil proton and 13C shifts (Wishart et al., 1995). They provide supportive evidence for the strong helical tendency in four regions of the protein, amino acids 3–11, 33–38, 44–53 and 66–82. All but two (Arg64, Trp85) 3JHN–HA coupling constants ,6.5 Hz that are typical for helical backbone geometry are also observed in these four regions. In addition, 3JHN–HA coupling constants .9 Hz are found for Phe39 and Met58, suggesting an extended conformation around these residues. Twenty four slowly exchanging amide protons were identified from the D2O sample, and most of them are found in the two C-terminal helices. Thus, all four probes of secondary structure suggest four helical regions in cytochrome c6 from S.elongatus, which is in agreement with homologous structures, but all four methods report the helix around Ala35 to be less stable than the others. Structure determination Summarizing the NOE data used in the final round of the structure calculation (Table I), .26 NOEs per residue could be assigned on average. However, the medium- and long-range NOEs that mainly determine the fold of the protein are not equally distributed along the peptide chain (Figure 2). An outstandingly large number of structuredetermining NOEs were observed for the hydrophobic
S.elongatus cytochrome c6 solution structure
Table I. Structure calculation Experimental restraints for the final structure Total no. of interresidual NOEs sequential NOEs |i–j| 5 1 medium-range NOEs |i–j| 5 2,3,4,5 long-range NOEs |i–j| .5 Total no. of intraresidual NOEs |i–j| 5 0 Dihedral angle restraints Hydrogen bonds
calculation 1586 (172 for heme) 480 551 555 (172 for heme) 714 (42 for heme) 28 24
Molecular dynamics statistics Average energy (kJ/mol) Etot Ebond Eangle Erepel ENOE Ecdih
2218.25 (684.36) 162.64 (6 9.99) 702.55 (626.40) 311.04 (638.17) 878.88 (648.43) 0.53 (6 0.30)
R.m.s.d. from ideal distances (nm) NOE Bond length
0.0042 0.0005
R.m.s.d. of ideal angles (°) Bond angles Improper angles
0.67 1.42
R.m.s.d. of 20 calculated structures (nm) Backbone (1–87) Heavy atoms (1–87) Backbone (3–85) Heavy atoms (3–85) Heavy atoms (heme)
0.077 0.106 0.061 0.097 0.074
residues Phe10, Leu31, Ile47, Val51, Phe61, Val73, Tyr76 and Trp85, suggesting the formation of a hydrophobic core with a dense packing in the interior of the protein. A large number of NOEs between amino acids and the heme group are found for the axial heme ligands His18 and Met58, as well as for the two cysteines, 14 and 17, which are covalently linked to the heme group. The proximity of Leu31 to the heme group is in agreement with the results for other cytochrome structures and is mirrored in the characteristic high field shifts of the amino acid side chain protons (Figure 1). The total number of 172 NOEs observed between protein and heme indicates that the surroundings of the heme are well defined by the NMR data. None of the 20 structures that were selected after the molecular dynamics calculations showed single distance violations of .0.05 nm or systematic distance violations of .0.025 nm. The average root mean square deviations (r.m.s.d.) for the backbone atoms and all heavy atoms of the 20 structures were 0.077 and 0.106 nm, respectively (Table I). Exclusion of the two N- and C-terminal residues reduces the r.m.s.d. to 0.061 and 0.097 nm, respectively. The structure (Figure 3) is well defined overall, with backbone r.m.s.d. values of ,0.07 nm for most parts of the peptide chain (Figures 4 and 5). Higher backbone r.m.s.d. values are found for Ala27, the sequence regions Lys33–Tyr42 and Phe61–Thr66, and for the N- and C-termini. This behavior correlates with the lower number of non-sequential NOEs (Figure 2) and the high solvent accessibility for most of the corresponding residues. The r.m.s.d. for all heavy atoms is ,0.15 nm for all residues
Fig. 2. Distribution of medium- (i–j ø5) and long- (i–j .5) range NOEs over the sequence. The height of the bars indicates the number of medium-range (black) or long-range (hatched) NOEs per residue. Open bars represent NOEs between amino acids and the heme group.
except Ala1, Asp2, Met26, Glu37, Gln38, Gly40, Met41, Arg64 and Gly87, which are solvent exposed and located in regions which also exhibit high backbone deviations. It is interesting that the side chains of the three non-hemecoordinating methionines 19, 26 and 41 are not fixed and are relatively solvent accessible despite their hydrophobic character. These residues are only weakly conserved in different c6 cytochromes (see also Figure 6) and may act as endogeneous antioxidants as suggested for other proteins (Levine et al., 1996). This hypothesis seems especially appropriate for a protein from a thermophilic organism such as S.elongatus. The heme geometry is well defined (Figure 4) and consistent with the parameter set used. The experimental data available proved to be sufficient to establish the orientation of the axial ligands unambiguously, relative to the heme plane. Deviating from the structure calculation performed with cytochrome c6 from M.braunii (Banci et al., 1996), the heme axial ligands were not fixed with ‘special covalent bonds’, but their position resulted from experimental restrictions for the residues surrounding the heme. The distances between Met58 sulfur and His18 Nε2 to the iron turned out to be 0.292 6 0.021 and 0.222 6 0.02 nm, respectively. The heme orientation and the small deviation from planarity of the porphyrin ring is in agreement with that found in crystal structures of other cytochromes (Frazaˆo et al., 1995; Kerfeld et al., 1995). Description of the structure The overall fold of S.elongatus cytochrome c6 resembles the topology of class I c cytochromes. Four α-helices are observed as elements of regular secondary structure with the typical arrangement of the α-helices at the N- and C-termini enclosing an angle of ~90° (Figure 3B). The second and third helix, which are not observed in all members of the family, are located on different sides of the heme. Analysis of the family of 20 structures defines α-helices for the following regions of the protein: Leu3– Phe10, Leu36–Phe39, Glu44–Val51 and Asp67–Gln80. Whereas the two C-terminal and the N-terminal helices are well defined, the second helix is extended at its N-terminus in some structures or replaced by a sequence of type I turns from Glu34 to Gly40. The location of the
29
M.Beißinger et al.
Fig. 3. (A) SYBYL (Tripos Ass.) stereo drawing of the backbone trace of cytochrome c6 (left) with every tenth residue numbered. (B) MOLSCRIPT/Raster3D (Kraulis, 1991; Merritt and Murphy, 1994) ribbon drawing indicating the elements of regular secondary structure. The heme and its axial ligands Met58 and His18 are represented in stick mode (view rotated 180° about the vertical axis compared with the stereo picture).
α-helices closely matches the secondary structure indicated by the NOE pattern, coupling constants, chemical shift indexes and hydrogen exchange data (Figure 1). In addition to α-helices, two 310-helical turns are observed at the 30
C-termini of the first and last α_helix, namely Ala15– Cys17, which is the region between the two heme-binding cysteines 14 and 17, and Ala81–Lys83, which is very close to the C-terminus. Another element of regular
S.elongatus cytochrome c6 solution structure
Fig. 5. R.m.s.d. values per residue for the family of 20 accepted structures for the backbone (d) and all heavy atoms (m).
Fig. 4. Backbone overlay of a family of 20 cytochrome c6 structures including the heme group. The structures were accepted by the criterion of the best energy function after the restrained molecular dynamics calculation.
secondary structure observed is a short antiparallel β-sheet in the vicinity of the axial heme ligand Met58, which until now had only been found in cytochrome c6 from C.reinhardtii (Kerfeld et al., 1995) and cytochrome c5 from Azotobacter vinelandii (Carter et al., 1985). A hairpin structure is built in this region, His53–Ala60, from a short β-sheet involving Gly54–Lys55 and Met58–Pro59, and a classical γ-turn in between with a hydrogen bond formed between Lys55 (i) and Ala57 (i12). Lys55 at the end of the first strand is a bulge residue and confers some irregularity to the β-sheet as it forms hydrogen bonds to Met58 as well as to Ala57. Asn56, the i11 residue in the γ-turn, is the only non-glycine and non-proline residue found in a disallowed region in the Ramachandran plot with a positive φ angle of ~60° and a ψ angle close to –90°. Interestingly, glycines substitute for Asn56 in the two c6 cytochromes for which a high-resolution structure is known (Figure 6; Frazaˆo et al., 1995; Kerfeld et al., 1995), and the homologous residue in c5 from A.vinelandii (Carter et al., 1985) is also an asparagine. As asparagine is the only type of amino acid besides glycine for which a left handed conformation is significantly populated (Richardson and Richardson, 1989), this ‘outlier’ in the Ramachandran plot may be rationalized in terms of the special geometric requirements in this well-defined backbone stretch. Indeed, the φ and ψ angles of residues homologous to Asn56 in the S.elongatus protein are very similar in the known cytochrome c6 structures (M.braunii Gly59: φ 5 63°, ψ 5 –122°; C.reinhardti: Gly58: φ 5 56°, ψ 5 –123°) and the structure of cytochrome c5 of A.vinelandii (Asn61: φ 5 62°, ψ 5 –83°). All other backbone torsion angles in S.elongatus cytochrome c6 are
found in energetically most favored (61%) or other allowed (38%) regions of the Ramachandran plot. In addition to extensive main chain hydrogen bonding observed in α-helical regions between (i, i14) and (i, i13) residues, two glutamine side chains are involved in hydrogen bonds in the C-terminal helix, Gln69(Hε2)– Glu68(O) and Gln71(Hε2)–Asp67(O). In addition, some main chain and side chain hydrogen bonds stabilize the loop regions that form the heme pocket, particularly the regions between the first and second α-helix, Ser11– Ala35, including the cysteine and histidine heme ligands, and the region between the third and fourth α-helix, Gln52–Thr66, which involves the methionine heme ligand located in a hairpin structure (Table II). The indole Hε1 of Trp85 that is very close to the C-terminus forms a hydrogen bond to the carbonyl of Leu31 positioned in the center of the hydrophobic core. Comparison with structures of homologous c6 cytochromes Up to now, two high-resolution structures from c6 cytochromes from green algal chloroplasts are available. The structure from the C.reinhardtii cytochrome was resolved at 0.19 nm resolution (Kerfeld et al., 1995), and the protein from M.braunii by ab initio phase determination down to 0.12 nm (Frazaˆo et al., 1995). Recently, the solution structure of the latter cytochrome c6 was also determined by NMR (Banci et al., 1996). Cytochrome c6 from S.elongatus exhibits 62 and 59% sequence identity to the C.reinhardtii and M.braunii proteins, which is mirrored in backbone r.m.s.d. values of 0.126 and 0.128 nm, respectively. Despite the high overall similarity of the structures (Figure 7), subtle differences exist. The largest deviation is observed in the loop region around residue 40, where the green algal proteins have a small insertion of two amino acids compared with the blue algal cytochrome c6. This part of the protein shows high r.m.s.d. values in the solution structures, is not very well defined in the electron density in the X-ray structures and exhibits the largest deviation between the two observed crystal forms of the C.reinhardtii cytochrome c6. Therefore, this loop of the protein is likely to accommodate mutations that do not disturb its function. A different region exhibit-
31
M.Beißinger et al.
Fig. 6. Sequence alignment between the three c6 cytochromes, for which high-resolution structures are available. Strictly conserved residues are marked with (*) and positions with conservative substitutions are indicated by (–). The heme ligands are underlined and the residues forming the ‘acidic patch’ are labeled in italics.
ing high flexibility, the loop preceding the C-terminal helix, Gly63–Asp67, also deviates in S.elongatus cytochrome c6 from the position in homologous structures and appears more oriented towards the core of the protein (Figure 7). The helices, in particular the N-terminal α-helix and the less stable 310-helix, are somewhat shorter in the cyanobacterial cytochrome c6 than they are in the respective green algal proteins. The C-terminal α-helix is extended by a 310-helical turn in S.elongatus cytochrome c6, and another 310-helical turn is observed from Ala15 to Cys17 which is not described in the chloroplast c6 cytochromes. The small antiparallel β-sheet around the methionine heme ligand was also observed in the C.reinhardtii cytochrome c6, but not in the M.braunii structure. An Ω-loop is closed in all three structures between the second glycine in the conserved patch of glycines around residue 20 and a conserved leucine at position 31 or 32. This loop is stabilized by a salt bridge between Arg22 and Asp32 in one of the crystal forms of C.reinhardtii cytochrome c6 (Kerfeld et al., 1995), but neither residue is conserved in c6 cytochromes of M.braunii and S.elongatus. As already observed in the other two high-resolution structures, the number of salt bridges is small in cytochrome c6. The only other salt bridge reported was between Lys81 and Asp85 in the C-terminus of C.reinhardtii cytochrome c6, and this was postulated from sequence comparisons to also occur in cyanobacterial c6 cytochromes (Kerfeld et al., 1995). The respective salt bridge exhibiting the reverse order of amino acids between Asp79 and Lys83 in S.elongatus cytochrome c6 was found in 25% of the calculated structures. Phe10, Tyr76 and Trp85 form a triangular aromatic stack on the histidine side of the heme that is also observed for the corresponding aromatic residues in other c6 cytochromes (Frazaˆo et al., 1995; Kerfeld et al., 1995; Banci et al., 1996). Accordingly, as fixation in the hydrophobic cluster restricts ring flipping, all ring protons of Phe10 and Tyr76 could be observed individually. Surprisingly, this was not the case in the NMR spectra of M.braunii cytochrome c6 (Banci et al., 1996). The other two aromatic residues, Phe61 and Phe39, are located close to the thioether linkage at pyrrole ring B and near propionate O1A at the surface, respectively. Met58 and His18 coordinate the heme iron via their Sδ and Nε2 atoms, respectively, involving average distances of 0.292 and 0.222 nm. The Hδ1 proton at the Nδ1 nitrogen of the same histidine forms a hydrogen bond to the carbonyl oxygen of Cys17. It is therefore very slowly exchanging with solvent protons and has a remarkable chemical shift of 8.83 p.p.m. In the green algal c6 32
Table II. Hydrogen bonds not involved in α-helices Region 9–35
52–66
80–87
Main chain–main chain
Side chain–main chain
9O···12HN 10O···15HN 14O···17HN 15O···18HN 52O···62HN 55O···58HN 58O···55HN 61O···64HN 80O···83HN 84O···87HN
13HD2···9O 18HD1···17O 23HD2···29O 23OD1···26HN 52HE2···48O
85HE1···31O
Fig. 7. MOLSCRIPT/Raster3D (Kraulis, 1991; Merritt and Murphy, 1994) backbone overlay of S.elongatus (red), C.reinhardtii (blue) and M.braunii (green) cytochrome c6 in tube representation.
cytochromes, however, histidine Hδ1 is hydrogen bonded to the carbonyl oxygen of Gly23 (M.braunii) or Arg22 (C.reinhardtii), but the Cys17 backbone oxygen is also within hydrogen bonding distance (Kerfeld et al., 1995). A proline around residue 30, which was conserved as a hydrogen bond acceptor of the heme-ligating histidine in eukaryotic c cytochromes (Mathews, 1985), did not fulfill this function in the green algal cytochromes c6 and was replaced by an alanine in the cytochrome c6 of S.elongatus and most other cyanobacteria. The δ propionate group is within hydrogen bonding distance to Lys29(Hζ), Gln50(Hε2) and Asn56(Hδ2) in 30, 45 and 65%, respectively, of the calculated structures.
S.elongatus cytochrome c6 solution structure
Fig. 8. Solvent-exposed hydrophobic surface area in the vicinity of heme. There are three clusters of hydrophobic amino acids, each of them mainly formed by four residues (shown in yellow). The solventexposed parts of the heme and the two semi-conserved basic residues are shown in red and blue, respectively.
The solvent-accessible surface area of the heme was 6.3% on average. This exactly matches the values reported for the green algal c6 cytochromes. The exposed parts are again the methyl groups at the edge of pyrrole ring C (CBC and CMC) and the propionate at ring D (O1D, O2D and CGD) (Figures 8 and 9). These groups are candidates for a direct electron transfer from the heme to potential electron transfer partners. When oriented with the molecular dipole pointing in the same direction, the region around the exposed heme propionic group corresponds to the hydrophobic ‘North pole’ of plastocyanin, corroborating short-range electron transfer to PSI involving His87 (Frazaˆo et al., 1995), in agreement with the kinetic results found with site-directed mutations at the hydrophobic region in spinach plastocyanin (Haehnel et al., 1994). The same region was mapped to the part of cytochrome c6 with the highest electron transfer coupling value (Frazaˆo et al., 1995). The negative charge of the propionate is counterbalanced by two semi-conserved basic residues flanking the heme crevice in all three high-resolution structures of c6 cytochromes, i.e. Lys29 and Lys55 in S.elongatus, His30 and Lys58 in M.braunii and Lys29 and Lys57 in C.reinhardtii (Figure 9). A metal site surrounded by a hydrophobic surface patch including positive charges (Figure 8) was reported to be a preferred docking site for its redox partners, especially for electron shuttle proteins like cytochrome c6 (Williams et al., 1995). Interestingly, the heme crevice is flanked by the two only weakly conserved methionines 26 and 41. Levine et al. (1996) suggested a role for methionines as endogeneous antioxidants especially when they are arranged to guard the entrance to an active site. This hypothesis would correlate well with the array observed here to prohibit cytochrome c6 from oxidation. A different electron transfer pathway that involves a negative surface area around Tyr83 for cytochrome f
Fig. 9. Electrostatic properties and regions supposed to be involved in electron transfer. Electrostatic surface potential (left) of the c6 cytochromes from S.elongatus (a), C.reinhardtii (b) and M.braunii (c). Red zones correspond to negative potentials and blue zones to positive. Residues discussed for importance in electron transfer pathways are shown on the right. Surface-exposed regions of the heme (red), conserved positively charged residues near the heme propionates (blue) and ‘acidic patch’ around amino acid 70 (pink) are shown.
interaction has been proposed for plastocyanin (He et al., 1991). Whereas the green algal and eukaryotic c6 cytochromes exhibit very low isoelectric points around 3.5, excess acidic residues are not generally observed in prokaryotic c6 cytochromes with isoelectric points in the range 3.8–9.3 (Ho and Krogmann, 1984). A high local concentration of acidic amino acids around residue 70 of cytochrome c6 involves residues 69–72 in M.braunii, residues 69–71 in C.reinhardtii and residues 67 and 68 in S.elongatus (Figures 6 and 9). This is remarkable because the negative patch contributes to the binding of cytochrome c6 at PSI by electrostatic attraction to the positive domain of the PsaF subunit with six lysine residues in plants and algae, but causes repulsion in cyanobacteria (Hippler et al., 1996). The conservation of the negative patch before introduction of the positive domain in an evolutionary event suggests an important function in a different reaction, such as that with positively charged cytochrome f. The reduction of the patch to only two negatively charged residues in the S.elongatus cytochrome c6 may be under33
M.Beißinger et al.
stood as the result of a balance between the unfavorable repulsion by PSI and the favorable attraction by cytochrome f. Conclusions The small (10 kDa) monoheme protein cytochrome c6 serves as a soluble electron shuttle protein in oxygenevolving photosynthesis. Like the copper protein plastocyanin, it transports electrons from the membrane-bound cytochrome b6f complex to PSI on the lumenal side of the photosynthetic membrane. Being sequentially and structurally very different, plastocyanin and cytochrome c6 confer, regulated by the availability of copper, the same function in some green algae and cyanobacteria. Whereas some cyanobacteria use only cytochrome c6, plastocyanin is found in higher plants exclusively. The plastocyanin structure has been known for several years (Guss and Freeman, 1983), and many mutants were investigated to obtain information about electron transfer pathways. Only recently, however, the high-resolution structures of two green algal cytochrome c6 counterparts were solved by X-ray crystallography and one by NMR. In contrast to these proteins, the solution structure of S.elongatus cytochrome c6 reported here is the only available structure of a cytochrome c6 from a prokaryotic organism, namely a primordial thermophilic cyanobacterium which has no corresponding plastocyanin. As c cytochromes are intrinsically thermostable in contrast to ferredoxin electron carriers, this protein is, however, not very well suited to study the principles of thermostability. Cytochrome c6 from S.elongatus exhibits the overall topology of class I c cytochromes, with four characteristic α-helices, the heme fixed to two cysteines near the N_terminus via thioether linkages and a histidine and a methionine as axial heme ligands. Similarly to cytochrome c6 from C.reinhardtii, there is a small antiparallel β-sheet around the methionine heme ligand. Despite high overall similarity to the green algal c6 cytochromes, there are subtle differences especially in loop regions of the protein and hydrogen bonding patterns. A negatively charged surface region which was proposed to play a role in electron transfer in analogy to plastocyanin involves only two residues in cytochrome c6 from S.elongatus as compared with three or four in the green algal cytochromes. The function of the charged residues has changed due to the insertion of a positive domain in PSI during evolution. The surfaceexposed region of the heme edge of ring C, however, is very similar and likely to be the region involved in electron transfer not only to PSI but also to the cytochrome b6f complex. It is tempting to extrapolate this conclusion also to the surface-exposed His87 of plastocyanin. The charge of the redox center including the ligands and the neighboring amino acids is 0 and 11 in the reduced and oxidized states, respectively, in cytochrome c6 as well as in plastocyanin. The flat hydrophobic docking surface at PSI should also be similar in cyanobacteria and plants. An essential contribution to this surface area by the two horizontal helices l and l9 at the lumenal side of the highly conserved subunits PsaA and PsaB is suggested by the spatial structure (Krauß et al., 1996). Therefore, the rate of electron transfer in the complex between cytochrome c6 and PSI should be in the same range as that between plastocyanin and PSI. The electron transfer to PSI, how-
34
ever, is limited in S.elongatus by the docking at PSI and the formation of the complex is strongly inhibited by repulsion of the negatively charged reaction partners. As the structure of PSI from S.elongatus became available at a resolution of 0.4 nm very recently, the solution structure of cytochrome c6 from the same organism should be very helpful to study electron transfer pathways by mutational analysis.
Materials and methods Sample preparation Cytochrome c6 from S.elongatus was prepared, purified and sequenced as reported previously (Sutter et al., 1995). The sample for homo- and heteronuclear NMR spectroscopy contained 5 mM unlabeled or 2 mM 15N- and 13C-double-labeled cytochrome c in 50 mM sodium phosphate 6 buffer (pH 6.5), respectively. Ten percent per volume of D2O was added to provide a lock signal. Measurements in D2O were performed after dissolving the lyophilized protein in 0.5 ml of D2O (99.994 atom %, Sigma, Deisenhofen, Germany). The pH was adjusted by addition of small volumes of 1 M NaOH (no correction was made for deuterium isotope effects). NMR samples were prepared under an argon atmosphere to avoid air oxidation of the protein, and the reduction was performed adding a 4-fold molar excess of sodium dithionite over protein. NMR spectroscopy All NMR experiments were performed at 298 K on a Bruker AMX600 spectrometer equipped with a Bruker VT2000 temperature control unit. The following homonuclear 2D experiments were measured in H2O/ D2O (9:1) and in pure D2O: double-quantum filtered correlated spectrum (COSY; Rance et al., 1983); total correlation spectrum with suppression of NOESY-type cross peaks (clean-TOCSY, mixing time 80 ms; Griesinger et al., 1988); and nuclear Overhauser enhancement spectra (NOESY, 80 and 200 ms mixing times; Jeener et al., 1979). All spectra were recorded with a sweep width of 10 869.57 Hz and contained 4096 and 512 data points in the F2 and F1 dimensions, respectively. After zero-filling to 4k31k frequency domain data points, a squared sinebell filter with a phase shift of π/4 was used prior to Fourier transformation. To delineate 3JHN–HA coupling constants, a COSY spectrum with a spectral sweep width of 7446.38 Hz using 16 384 data points in F2 (equivalent to a resolution of 0.45 Hz/point) and 1024 data points in F1 was recorded. After zero-filling to 2k data points in the indirect dimension, coupling constants were obtained from a fit of Lorentzian lines to the antiphase doublets with the NDee program (Software Symbiose Inc., Bayreuth, Germany) without using an apodization function prior to Fourier transformation. A 2D 1H–15N HMQC spectrum (Mu¨ller, 1979; Bax et al., 1983) was collected with spectral widths of 10 869.57 Hz in the proton and 2432.4 Hz in the nitrogen dimension. One hundred and forty two data points in the indirect and 4096 data points in the direct dimension were acquired and zero-filled to a data matrix of 25634096 frequency domain data points. 3D 15N-edited TOCSY (Marion et al., 1989) and NOESY-HMQC (Zuiderweg and Fesik, 1989) spectra with mixing times of 75 and 120 ms, respectively, were recorded with spectral widths of 10869.57 Hz in F1 (1H) and F3 (1H), and 1824.30 Hz in F2 (15N), collecting 25032048385 data points, respectively. HNCA (Ikura et al., 1990; Grzesiek and Bax, 1992), HNCOCA (Bax and Ikura, 1991) and HNCO (Kay et al., 1990) spectra were recorded with spectral widths of 10869.57 Hz in F3 (1H), 5131.62 Hz and 2414.88 Hz in F2 (13C) for HNCA, HNCOCA and HNCO, respectively, and 1824.3 Hz in F1 (15N). The F3–F2–F1 data matrices were 4096380388, 4096390390 and 4096385390 data points for the HNCA, HNCOCA and HNCO spectra, respectively. For all heteronuclear spectra, a squared sinebell window function with a phase shift of π/2 was used in all dimensions. Phase-sensitive detection for the indirect dimensions was achieved using the time-proportional phase incrementation technique (Marion and Wu¨thrich, 1983). The solvent signal was suppressed by pre-saturation and by coherent irradiation during the mixing time. After Fourier transformation, a seventh-order base line correction with sine and cosine functions was applied for the direct dimensions (F2 in 2D and F3 in 3D spectra; Gu¨ntert and Wu¨thrich, 1992). Data processing was performed using the NDEE program package (Herrmann, 1995). 1H and 13C chemical shift values are reported in p.p.m. from 2,2-dimethyl-2-silapentanesulfonate. 15N chemical shifts were indirectly referenced relative to liquid NH3 (Wishart et al., 1995).
S.elongatus cytochrome c6 solution structure Distance information was obtained from the 200 ms 2D NOESY spectrum in aqueous solution. NOESY cross-peak intensities were grouped into three distance categories according to their relative intensities in the contour plots: strong, 0.18–0.27 nm; medium, 0.18–0.40 nm; weak, 0.18– 0.55 nm. The respective distance categories were increased by 0.05 nm to correct for the apparent higher intensity of non-stereospecifically assigned atoms (Wu¨thrich et al., 1983; Wagner et al., 1987).
Definition of the heme group for the MD calculations For the MD calculations, the heme group parameters that were supplied with the CHARMM 22 force field were used, with some modifications, as described below. In order to obtain correct local geometry during the high temperature phase of the simulated annealing, all force constants were increased, matching the values of the ‘parallhdg.pro’ force field of X-PLOR (Kbond 5 1000 kcal/mol/Å2, Kangl 5 Kimpr 5 500 kcal/mol/ Å2; Bru¨nger, 1993). The heme group was covalently linked to the protein by two S–C bonds using the ‘patch’ option of X-PLOR. The equilibrium values for bond lengths and angles of these additional bonds were taken from the crystal structure of a homologous cytochrome c6 (Frazaˆo et al., 1995). In order to allow free orientation of the heme plane relative to the apoprotein, the orientation of the two axial ligands was not fixed by additional restraints. Experimental restraints for the structure calculations A total of 2300 NOEs was obtained from the analysis of the two- and three-dimensional NOESY spectra. Initial structures were calculated using 1587 unambiguous inter- and intraresidual NOE restraints. Additional ambiguous restraints were added in several rounds of structure calculation after evaluation of the NOE list analyzing the consecutively better defined structures (Kraulis et al., 1989; Qi et al., 1994). In the final rounds of the structure calculation, dihedral angle and hydrogen bond restraints were added. For residues with 3JHN–HA ,6.5 Hz or .9.0 Hz, φ angle restraints were derived using the Karplus equation (Pardi et al., 1984). Deviations of 630° from the measured angles were allowed without penalty in the calculation. Hydrogen bond restraints were introduced into the structure calculations if three criteria were met: slow exchange of the corresponding amide proton, an N-H···O distance of ,0.26 nm, and an O···H-N angle of .120° in at least 50% of the unrestrained structures. For each hydrogen bond, two distance restraints were introduced into the calculation: dHN–O 5 0.17–0.23 nm and dN–O 5 0.24–0.33 nm (Kraulis et al., 1989). The total number of restraints used for the final structure calculation are summarized in Table I. Structure calculations All structures were calculated using a modified ab initio simulated annealing protocol (M.Nilges, unpublished) with an extended version of X-PLOR 3.1 (Bru¨nger, 1993). The calculation strategy is similar to those published previously (Kharrat et al., 1995; Kemmink et al., 1996), including floating assignment of prochiral groups (Holak et al., 1989) and a reduced presentation for non-bonded interactions for part of the calculation (Nilges, 1993) to increase efficiency. A more detailed description of the protocol is given elsewhere (Kharrat et al., 1995). In each round of the structure calculation, 50 or 60 structures were calculated starting from templates with random backbone torsion angles. During all stages of the simulation, the temperature was maintained by coupling to a heat bath (Berendsen et al., 1984) with a coupling constant of 10/ps. Floating chirality assignment was performed for all prochiral groups. In the conformational search phase, 60 ps of MD were simulated at 2000 K, using a timestep of 2 fs. In this stage of the calculation, the non-bonded interactions were only computed between Cα atoms and one carbon atom of each side chain, using van der Waal’s radii of 0.225 nm (Nilges, 1993; Kharrat et al., 1995). The refinement comprised a twophase cooling procedure treating the non-bonded interactions between all atoms explicitly. In the first stage, the system was cooled from 2000 to 1000 K within 60 ps, using a 1 fs timestep. In this stage of the calculation, the force constants for the non-bonded interactions and the angle energy constant for the stereospecifically unassigned groups were gradually increased to their final values. In the next stage of the calculation, the system was cooled from 1000 to 100 K within 20 ps (1 fs timestep), applying the high force constants obtained at the end of the previous cooling stage. In order to detect the energy minimum, 200 steps of energy minimization were performed using the Powell algorithm (Powell, 1977). Of the 60 structures resulting from the final round of structure calculation, those 20 structures that showed the lowest energy were selected for further characterization. All calculations were carried out on HP9000/735 and Sun SparcUltra workstations requiring an average amount of 140 h c.p.u. time per round of structure calculation. The
coordinates have been deposited in the Protein Data Bank, Brookhaven National Laboratory, Upton, NY, accession code 1C6S.
Structure analysis Geometry of the structures, structural parameters and elements of secondary structure were analyzed using the programs PROCHECK (Laskowski et al., 1993) and PROMOTIF (Hutchinson and Thornton, 1996). Hydrogen bonds were analyzed with the program X-PLOR (Bru¨nger, 1993) using a distance criterion of ,0.26 nm for the respective proton to oxygen distance, an angle criterion of .120° for the O···H-N angle, and an occurrence frequency of at least 50%. Salt bridges were accepted for a distance ,0.4 nm between the two charged groups. For the graphical presentation of the structures, the programs SYBYL 6.0 (Tripos Ass.), Molscript (Kraulis, 1991) and Raster3D (Merritt and Murphy, 1994) were used. Molecular surfaces showing the electrostatic potential of the proteins as a colored map were generated with the GRASP program (Nicholls, 1993).
Acknowledgements The authors thank C.A.Kerfeld and G.M.Sheldrick for early access to the coordinates deposited in the Brookhaven Protein Data Bank. W.H. acknowledges support by the Deutsche Forschungsgemeinschaft SFB 388/A1. M.B. acknowledges a post-doctoral fellowship of the Fonds der Chemischen Industrie.
References Banci,L., Bertini,I., Quacquarini,G., Walter,O., Diaz,A., Herva´s,M. and De la Rosa,M.A. (1996) The solution structure of cytochrome c6 from the green alga M.braunii. J. Biol. Inorg. Chem. 1, 330–340. Baumann,B., Sticht,H., Scha¨rpf,M., Sutter,M., Haehnel,W. and Ro¨sch,P. (1996) Structure of Synechococcus elongatus [Fe2S2] ferredoxin in solution. Biochemistry, 35, 12831–12841. Bax,A. and Ikura,I. (1991) An efficient 3D NMR technique for correlating the proton and 15N backbone amide resonances with the α-carbon of the preceding residue in uniformly 15N/13C enriched proteins. J. Biomol. NMR, 1, 99–104. Bax,A., Griffey,R.H. and Hawkins,B.L. (1983) Correlation of proton and nitrogen-15 chemical shifts by multiple quantum NMR. J. Magn. Resonance, 55, 301–312. Berendsen,H.J.C., Postma,J.P.M., van Gunsteren,W.F., DiNiola,A. and Haak,J.R. (1984) Molecular dynamics with coupling to an external bath. J. Chem. Phys., 81, 3684–3690. Bru¨nger,A.T. (1993) X-PLOR Version 3.1. Howard Hughes Medical Institute and Yale University, New Haven, CT. Carter,D.C., Melis,K.A., O’Donnell,S.E., Burgess,B.K., Furey,W.F.,Jr, Wang,B.-C. and Stout,C.D. (1985) Crystal structure of Azotobacter cytochrome c5 at 2.5 Å resolution. J. Mol. Biol., 184, 279–295. Frazaˆo,C. et al. (1995) Ab initio determination of the crystal structure of cytochrome c6 and comparison with plastocyanin. Structure, 3, 1159–1169. Griesinger,C., Otting,G., Wu¨thrich,K. and Ernst,R.R. (1988) Clean TOCSY for 1H spin system identification in macromolecules, J. Am. Chem. Soc., 110, 7870–7872. Grzesiek,S. and Bax,A. (1992) Improved 3D triple-resonance NMR techniques applied to a 31 kDa protein. J. Magn. Resonance, 96, 432–440. Gu¨ntert,P. and Wu¨thrich,K. (1992) FLATT—a new procedure for highquality baseline correction of multidimensional NMR spectra. J. Magn. Resonance, 96, 403–407. Guss,J.M. and Freeman,H.C. (1983) Structure of oxidized poplar plastocyanin at 1.6 Å resolution. J. Mol. Biol., 169, 521–563. Haehnel,W., Jansen,T., Gause,K., Klo¨sgen,R.B., Stahl,B., Michl,D., Huvermann,B., Karas,M. and Herrmann,R.G. (1994) Electron transfer from plastocyanin to photosystem I. EMBO J., 13, 1028–1038. He,S., Modi,S., Bendall,D.S. and Gray,J.C. (1991) The surface-exposed tyrosine residue Tyr83 of pea plastocyanin is involved in both binding and electron transfer reactions with cytochrome f. EMBO J., 10, 4011–4016. Hippler,M., Reichert,J., Sutter,M., Zak,E., Altschmied,L., Schiltz,E., Herrmann,R.G. and Haehnel,W. (1996) The plastocyanin binding domain of plants. EMBO J., 15, 6374–6384. Ho,K.K. and Krogmann,D.W. (1984) Electron donors to P700 in cyanobacteria and algae. An instance of unusual genetic variability. Biochim. Biophys. Acta, 766, 310–316.
35
M.Beißinger et al. Holak,T.A., Nilges,M. and Oschkinat,H. (1989) Improved strategies for the determination of protein structures from NMR data: the solution structure of acyl carrier protein. FEBS Lett., 242, 649–654. Hutchinson,E.G. and Thornton,J.M. (1996) PROMOTIF—a program to identify and analyze structural motifs in proteins. Protein Sci., 5, 212–220. Ikura,M., Kay,L.E. and Bax,A. (1990) A novel approach for sequential assignments of 1H, 13C, and 15N spectra of larger proteins: heteronuclear triple-resonance three-dimensional NMR spectroscopy. Application to calmodulin. Biochemistry, 29, 4659–4667. Jeener,J., Meier,B.H., Bachmann,P. and Ernst,R.R. (1979) Investigation of exchange processes by two-dimensional NMR spectroscopy. J. Chem. Phys., 71, 4546–4553. Kay,L.E., Ikura,M., Tschudin,R. and Bax,A. (1990) Three-dimensional triple-resonance NMR spectroscopy of isotopically enriched proteins. J. Magn. Resonance, 89, 496–514. Kemmink,J., Darby,N.J., Dijkstra,K., Nilges,M. and Creighton,T.E. (1996) Structure determination of the NH2-terminal thioredoxinlike domain of protein disulfide isomerase using multidimensional heteronuclear 13C/15N NMR spectroscopy. Biochemistry, 35, 7684– 7691. Kerfeld,C.A., Haroon,P.A., Interrante,R., Merchant,S. and Yeates,T.O. (1995) The structure of chloroplast cytochrome c6 at 1.9 Å resolution: evidence for functional oligomerization. J. Mol. Biol., 250, 627–647. Kharrat,A., Macias,M.J., Gibson,T.J., Nilges,M. and Pastore,A. (1995) Structure of the dsRNA binding domain of E.coli RNase III. EMBO J., 14, 3572–3584. Kraulis,P. (1991) Molscript: a program to produce both detailed and schematic plots of protein structures. J. Appl. Crytallogr., 24, 946–950. Kraulis,P., Clore,G.M., Nilges,M., Jones,T.A., Petterson,G., Knowles,J. and Gronenborn,A.M. (1989) Determination of the three-dimensional solution structure of the C-terminal domain of cellobiohydrolase I from Trichoderma reesei. A study using nuclear magnetic resonance and hybrid distance geometry–dynamical simulated annealing. Biochemistry, 28, 7241–7257. Krauß,N., Schubert,W.D., Klukas,O., Fromme,P., Witt,H.T. and Saenger,W. (1996) Photosystem I at 4 Å resolution represents the first structural model of a joint photosynthetic reaction centre and core antenna system. Nature Struct. Biol., 3, 965–973. Laskowski,R.A., MacArthur,M.W., Moss,D.S. and Thornton,J.M. (1993) PROCHECK: a program to check the stereochemical quality of protein structures. J. Appl. Crystallogr., 26, 283–291. Levine,R.L., Mosoni,L., Berlett,B.S. and Stadtman,E.R. (1996) Methionine residues as endogeneous antioxidants in proteins. Proc. Natl Acad. Sci. USA, 93, 15036–15040. Marion,D. and Wu¨thrich,K. (1983) Application of phase sensitive twodimensional correlated spectroscopy (COSY) for measurements of 1H–1H spin–spin coupling constants in proteins. Biochem. Biophys. Res. Commun., 113, 967–974. Marion,D., Driscoll,P.C., Kay,L.E., Wingfield,P.T., Bax,A., Gronenborn, A.M. and Clore,G.M. (1989) Overcoming of overlap problem in the assignment of 1H–15N Hartmann–Hahn-multiple quantum coherence and nuclear Overhauser-multiple quantum coherence spectroscopy: application to interleukin 1β. Biochemistry, 28, 6150–6156. Mathews,F.S. (1985) The structure, function and evolution of cytochromes. Prog. Biophys. Mol. Biol., 45, 1–56. Merritt,E.A. and Murphy,M.E.P. (1994) Raster3D version 2.0—a program for photorealistic molecular graphics. Act. Crystallogr., D50, 869–873. Mu¨ller,L. (1979) Sensitivity enhanced detection of weak nuclei using heteronuclear multiple quantum coherence. J. Am. Chem. Soc., 101, 4481–4484. Nicholls,A. (1993) GRASP: Graphical Representation and Analysis of Surface Properties. Columbia University, New York. Nilges,M. (1993) A calculation strategy for the structure determination of symmetric dimers by 1H NMR. Proteins, 17, 297–309. Pardi,A., Billeter,M. and Wu¨thrich,K. (1984) Calibration of the angular dependance of the amide proton-Cα proton coupling constants, 3JHNα, in a globular protein. J. Mol. Biol., 180, 741–751. Pescheck,G.A. (1996) Cytochrome oxidase and the cta operon of cyanobacteria. Biochim. Biophys. Acta, 1275, 27–32. Powell,M.J.D. (1977) Restart procedures for the conjugate gradient method. Mathemat. Progr., 12, 241–254. Qi,P.X., Di-Stefano,D.L. and Wand,A.J. (1994) Solution structure of horse heart ferrocytochrome c determined by high-resolution NMR and restrained simulated annealing. Biochemistry, 33, 6408–6417. Rance,M., Sørensen,O.W., Bodenhausen,G., Wagner,G., Ernst,R.R. and Wu¨thrich,K. (1983) Improved spectral resolution in cosy 1H NMR
36
spectra of proteins via double quantum filtering. Biochem. Biophys. Res. Commun., 117, 479–485. Richardson,J.S. and Richardson,D.C. (1989) Prediction of Protein Structure and the Principles of Protein Conformation. Plenum Press, New York. Sandmann,G., Reck,H., Kessler,E. and Bo¨ger,P. (1983) Distribution of plastocyanin and soluble plastidic cytochrome c in various classes of algae. Arch. Microbiol., 134, 23–27. Sutter,M., Sticht,H., Schmid,R., Ho¨rth,P., Ro¨sch,P. and Haehnel,W. (1995) Cytochrome c6 from the thermophilic Synechococcus elongatus. In Mathis,P. (ed.), Photosynthesis: From Light to Biosphere. Kluwer Academic Publishers, The Netherlands, Vol. II, pp. 563–566. Wagner,G., Braun,W., Havel,T.F., Schaumann,T., Go,N. and Wu¨thrich,K. (1987) Protein structures in solution by nuclear magnetic resonance and distance geometry. The polypeptide fold of the basic pancreatic trypsin inhibitor determined using time different algorithms, DISGEO and DISMAN. J. Mol. Biol., 196, 611–639. Williams,P.A., Fu¨lo¨p,V., Leung,Y.-C., Chan,C., Moir,J.W.B., Howlett,G., Ferguson,S.J., Radford,S.E. and Hajdu,J. (1995) Pseudospecific docking surfaces on electron transfer proteins as illustrated by pseudoazurin, cytochome c550 and cytochrome cd1 nitrite reductase. Nature Struct. Biol., 2, 975–982. Wishart,D.S. and Sykes,B.D. (1994) The 13C chemical-shift index: a simple method for the identification of protein secondary structure using 13C chemical-shift data. J. Biomol. NMR, 4, 171–180. Wishart,D.S., Sykes,B.D. and Richards,F.M. (1992) The chemical shift index: a fast and simple method for the assignment of protein secondary structure through NMR spectroscopy. Biochemistry, 31, 1647–1651. Wishart,D.S., Bigam,C.G., Holm,A., Hodges,R.S. and Sykes,B.D. (1995) 1H, 13C and 15N random coil NMR chemical shifts of the common amino acids. I. Investigations of nearest-neighbor effects. J. Biomol. NMR, 5, 67–81. Wu¨thrich,K. (1986) NMR of Proteins and Nucleic Acids. John Wiley and Sons, New York. Wu¨thrich,K., Billeter,M. and Braun,W. (1983) Pseudo-structures for the 20 common amino acids for use in studies of protein conformations by measurements of intramolecular proton–proton distance constraints with nuclear magnetic resonance. J. Mol. Biol., 169, 949–961. Yamaoka,T., Satoh,K. and Katoh,S. (1979) Photosynthetic activities of a thermophilic blue–green alga. Plant Cell Physiol., 19, 943–954. Zuiderweg,E.R.P. and Fesik,S.W. (1989) Heteronuclear threedimensional NMR spectroscopy of the inflammatory protein C5a. Biochemistry, 28, 2387–2391. Received July 31, 1997; revised October 23, 1997; accepted October 24, 1997