EM SCOTT**, T C AITCHISON*, D D HARKNESS**, M S BAXTERt and. G T COOKt. ABSTRACT. We report in this paper on a preliminary analysis of Stages 1 ...
[RADIOCARBON, VOL 31,
No. 3, 1989, P 414-421]
AN INTERIM PROGRESS REPORT ON STAGES
1
AND 2 OF THE
INTERNATIONAL COLLABORATIVE PROGRAM
EM SCOTT**, T C AITCHISON*, D D HARKNESS**, M S BAXTERt and G T COOKt ABSTRACT. We report in this paper on a preliminary analysis of Stages 1 and 2 of the International Collaborative program. We have chosen to concentrate on the internal and external consistencies of the participating laboratories. The two stages so far completed have dealt only with the processes of sample synthesis and counting, and results indicate that the major component of variability lies in the counting process. Outlying laboratories are observed at each stage. A third stage is in progress which will allow an assessment of any further variability due to sample pretreatment. With the inclusion of duplicate samples in each stage, we are able to report that laboratories are remarkably consistent internally, ie, the differences between duplicates generally agree with the laboratory's claimed precision.
INTRODUCTION
The 14C dating community has acknowledged the importance of interlaboratory checks through its willingness to participate in a number of collaborative studies (Otlet et a1,1980; ISG, 1982, 1983). Currently, a third and considerably more ambitious project (Scott et al, 1986) has been initiated and is being supported by over 5014C laboratories. We report here on the progress of this third study. Overall Aims
The study has been undertaken with the aims of 1) gaining insight into the contribution of the various dating processes to the overall dating error, 2) providing experimental verification of the diverse laboratory techniques used in dating, and 3) quantifying uncertainties on routine results obtained by the modern generation of 14C laboratories.
Organization and Design of the Study Full details of the study organization are given in Scott et al (1986). The study has three sequential stages, each introducing a further laboratory process into the study. Stage 1, primarily involving the counting process, was completed and reported on in September 1987 (Scott et a1, 1987). Stage 2, which introduced sample synthesis, was completed in April 1988 and we report our preliminary findings here. Stage 3, which introduces sample pretreatment, is currently underway and will not be completed before January 1989.
*
**
t
Dept of Statistics, University of Glasgow, Glasgow G12 80W, Scotland NERC'4C Laboratory, NEL, East Kilbride, Glasgow, G75 OQU, Scotland Scottish Universities Research and Reactor Centre, East Kilbride, Glasgow, G75 OQU, Scotland
414
The International Collaborative Program
415
STUDY SAMPLES
The hierarchical sample structure is an important element of the study design. Table 1 illustrates the sample types offered in stages throughout the program. Duplicate samples were included at each stage as well as four known-age samples in Stages 2 and 3. In total, each laboratory participating in all three stages will complete a minimum of 16 14C dates. A full description of the sample preparations is given by Harkness et al (1989). Eighty laboratories were invited to participate, of which 58 full participants were registered. A total of 52 laboratories returned results for Stage 1 and then received Stage 2 samples. Of these, 37 have, thus far, returned results for Stage 2 and received Stage 3 samples. Table 2 shows the number of laboratories involved and the composition of the study group at various stages, in terms of counting technique and medium.
TABLE
1
Sample types Stage 1- Calcium carbonate or benzene Stage 2 - Humic acid, cellulose, algal lithothamnion Stage 3 - Shell, peat and wood
TABLE 2
Breakdown of laboratory participation LSC
Gas counting
Stage
AMS
CO2
C2H2
CH4
1
19
1
4
8
2
13
1
4
5
STAGE
1
RESULTS
We presented an analysis of the results from Stage 1 in Groningen (Scott et al, 1987) and, therefore, we only summarize our findings here. The main aim of Stage 1 was to quantify variability in results due to the counting process and, to this end, samples in Stage 1 were either benzene or calcium carbonate. Within each sample type, two distinct `14C ages' were provided and each laboratory received two duplicate samples of each age. The laboratory did not know the identity of each sample. Table 3 shows the summary statistics of the results for the four distinct samples.
E M Scott et al
416
TABLE 3
Summary statistics for Stage
sample
`
Carbonate 1
Carbonate 2
32 -66 500 -110-0
32 3600 850
n
Average Range Quartile
1
2
1
Range
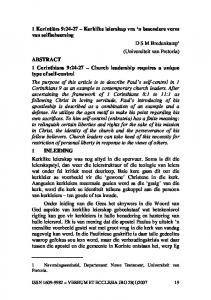
From the four results from each laboratory, the average of, and the disparity between, each duplicate pair was calculated. Disparity is defined as the difference between duplicate pairs (ignoring sign), divided by the square root of the sum of the errors squared. The disparity is a measure of how much the laboratory quoted errors relate to the observed difference between the duplicate results. Values of the disparity exceeding two would indicate that a laboratory was unable to detect the presence of duplicates within the limits of their claimed precision.
CARE 2
NIIIMMN
BARB 2 CARB
1
CARE
1
BENZ 2 BENZ 2
MI.. N BENZ
M
1
BENZ 0
1
2
3
4
-12001000B00-600-400-200 0
5
Fig 1. Disparities for all sample types in Stage
1
1
200 400 600 800 1000
Fig 2. Average of duplicates for each sample in Stage 1 relative to the overall sample average for
each sample type
Figure 1 shows the disparities for the four samples of Stage 1. Outlying laboratories (a disparity exceeding two) are shown clearly in this figure and are more pronounced for the first benzene sample, which was ca 1000 yr BP. Seven out of 20 liquid scintillation laboratories had disparities, on 1 or other of the samples, which exceeded 2. This effect is particularly pronounced on the younger sample. Only 4 out of 32 gas counting and accelerator laboratories had disparities exceeding 2 and there was no evidence that accelerator laboratories are separable, in this aspect of quality, from the gas counting laboratories.
The International Collaborative Program
417
Figure 2 shows the variability in the average results for each Stage 1 sample. Here, the overall average for the sample has been subtracted from each individual laboratory average. Again, there is some evidence that the data from the liquid scintillation laboratories are more widely scattered than those from the gas counting and accelerator laboratories (the range of results for the liquid scintillation laboratories is almost twice that of the gas counting and accelerator results). Such a difference, however, results from one or more extreme outliers in the liquid scintillation data set. Considering the relationship between the averages of the duplicate pairs gave a highly significant correlation coefficient of r = 0.78, for those laboratories that assayed benzene. Such a high degree of linear dependence is evidence for systematic biases. For those laboratories that analyzed the carbonate samples, the correlation was much lower at r = 0.37, indicating a less clear linear dependence between the results. Again, the influence of outlier laboratories was indicated. Currently, to help assess the experimental causes of the observed distribution of results, additional information is being sought from participating laboratories, in particular, concerning reference standards. STAGE 2 RESULTS
Stage 2 introduced the further process of sample synthesis into the study. Bulked homogenized samples of cellulose, humic acid and algal lithothamnion were prepared and distributed. Laboratories selected 2 of the 3 sample materials and received 2 duplicate samples of each. Table 4 summarizes results received thus far from 37 laboratories. It is clear that the ranges of results for both the cellulose and algal samples are considerably larger than that for the humic acid sample but that the mid TABLE 4
Summary statistics for Stage 2 Sample n
Average
Range Quartile
Humic acid 17
3390 550 3920-3450
Cellulose
lithothamnion
36 2250 1900
Range
50% ranges (the difference between the quartiles) for each sample type are roughly equivalent at 200 yr. These statistics again indicate one or more extreme laboratories in the group. Evidence of lack of homogeneity was found in the natural algal sample by the accelerator laboratories but was not detected by the conventional laboratories. Also, we analyzed various sample type combinations. The three possible sample type combinations are humic acid/algal, humic acid/cellulose
and cellulose/algal. Four, 16 and 23 laboratories respectively opted for these possible combinations. An assessment of the dependence between the
418
E M Scott et al
average results for each sample type combination again showed high degrees of linear dependence (typically correlations of 0.8 or higher). This again provides evidence of systematic biases. Analysis of the average of and disparity for each duplicate pair showed that most laboratories have disparities