Office of Population Research Princeton University WORKING PAPER SERIES
EMPLOYMENT AND WAGE CONSEQUENCES OF YOUNG WOMEN'S LABOR FORCE AND JOB TRANSITIONS Sigal Alon Marta Tienda Office of Population Research Working Paper No. 2000-1 May 2000
Papers published in the OPR Working Paper Series reflect the views of individual authors. They may be cited in other publications, but are intended to be work-in-progress. Comments are welcome. Additional copies are available by writing to the Office of Population Research Working Paper Series, Princeton University, 21 Prospect Avenue, Princeton, NJ 08544. Fax: (609) 258-1039. Or on the web, http://opr.princeton.edu.
EMPLOYMENT AND WAGE CONSEQUENCES OF YOUNG WOMEN'S LABOR FORCE AND JOB TRANSITIONS Sigal Alon Marta Tienda Office of Population Research Working Paper No. 2000-1 May 2000
Acknowledgements: This research was supported by grants from the National Science Foundation (SBR-9601995) and the W.T. Grant Foundation to Princeton University. We gratefully acknowledge the Office of Population Research and the Department of Sociology for generous institutional support. We thank Zahid Hafeez for assistance in data preparation. Please direct all correspondence to Sigal Alon, Princeton University, Princeton, NJ, 08544, or email
[email protected].
Employment and Wage Consequences of Young Women’s Labor Force and Job Transitions Sigal Alon and Marta Tienda
Abstract By age 30 white women are more likely to be employed, either full or part-time, and to earn more compared to Hispanic and black women. We trace these employment and wage inequalities to young women’s early work experiences, in particular work-related transitions. Using the NLSY79 (Work History File) we examine two facets of women’s labor market dynamics between ages 16-30, namely transitions between employment and nonemployment, and transitions among employers. Neither labor force instability or job turnover influence women’s employment status at age 30, but both aspects of early market dynamism influence wages. We find that a moderate amount of job turnover during young adulthood is an essential component of the career shaping process which enhances women’s economic mobility. However, excessive turnover, particularly among young adult women, is economically counterproductive. Young black women experience fewer transitions over the early life course, but our results indicate that they benefit more from both types of transitions compared to white and Hispanic women.
Introduction Despite the substantial reduction in the gender wage gap over the past 25 years, wage inequality among women has been increasing since at least 1979 (Blau 1998; Bowler, 1999). There are two widely accepted explanations for this trend. One, dubbed the “skill explanation,” links women’s increased wage inequality to the rising returns to education; the “family structure hypothesis” links higher inequality among women to motherhood because childless women earn more than mothers (Waldfogel 1998). In this paper we examine a third hypothesis, namely the “employment instability hypothesis” to illustrate how early labor force experiences contribute to women’s wage inequality at age 30. Specifically, we consider the influence on wages of both job turnover and labor force transitions. We argue that the employment and wage consequences of market transitions depend on their timing, frequency and nature, that is, whether they imply instability or mobility. Most empirical studies consider either turnover or labor force transitions in assessing intermediate and long-term impacts of early work careers on adult employment outcomes. However, this distinction ignores that workers typically experience both types of transitions over their life course. The practice of excluding some choices from the full set of options distorts our understanding of the nature and consequences of labor market dynamism on women’s future employment and wage prospects. Using the National Longitudinal Survey of Youth (WorkHistory file) and an inclusive definition of work careers that simultaneously considers transitions among employers and between the labor force states of employment and nonemployment we assess how the timing and frequency of job turnover and labor force instability on these adult outcomes influences women’s employment status and wages at age 30.
1
The dynamism of women’s work careers peaks before age 25, and stabilizes thereafter. Racial and ethnic comparisons show that white women experience more work-related transitions than minority women, particularly employer transitions. Neither early labor force instability transitions or job turnover influence women’s employment status at age 30, yet both aspects of early market dynamism influence wages. Both the timing and number of transitions experienced over the early life course generate these effects. As for men, job changing during the early career is a critical component of women’s career development and produces wage gains. However, job turnover and labor force instability between ages 26 and 29 incurs significant wage penalties at age 30. The following section reviews relevant studies about labor force dynamics and turnover as a backdrop for developing an integrated approach to evaluate the consequences of labor force instability and job turnover on race and ethnic variation in adult women’s wages.
Background and Analytic Framework Labor Force Transitions One of the most striking social changes of the last century is the dramatic rise in women’s labor force participation, especially among married women and mothers of children. Concommitantly, the length of work spells and the proportion of women’s lifetime work experience rose (Hill and O'Neill 1992; Rexroat 1992). Despite considerable evidence of women’s rising commitment to market activity, intermittency remains a defining feature of female employment behavior, even among young cohorts. Several recent studies show that women experience greater labor force instability than men (Clogg et al. 1990; Light and Ureta 1985; Hseuh and Tienda 1996). For example, only 20-30 percent of women worked more than 90 percent of the time between ages 24 to 30, as compared to two-thirds of men (Light and Ureta 1995). 2
Interruption of work careers – whether resulting from childbearing/rearing, unemployment, re-enrollment in school, disability or other reasons – can incur significant wage penalties, depending on their timing and the duration of market withdrawal. Most studies show that higher intermittency and longer jobless spells incur wage losses (England 1982; Felmlee 1984; Felmlee 1995; Keith and McWilliams 1997; Abbott and Beach 1994; Light and Ureta 1995). Repeated labor force departures preclude the accumulation of job-specific tenure, which is positively related to lifetime earnings, and thus produce wage dispersion among adults (Devine and Keifer, 1993; Anderson and Meyer, 1994; Tienda and Stier, 1996). Furthermore, if frequent episodes of joblessness result in discouragement and protracted episodes of nonparticipation (Clark and Summers, 1979), the timing and frequency of labor force transitions during early work careers may have lasting effects on adult women’s future employment prospects. This implies that the frequency of jobless spells during adolescence and young adulthood will adversely influence earnings of mature women (England 1982). Light and Ureta (1995) traced 12 percent of the aggregate gender wage gap to differences in the frequency, duration, and timing of nonemployment episodes over women’s work careers. Race and ethnic differences in labor force instability also have complications for women’s wage dispersion (Clogg et al. 1990; Alon et al. 2000; Hsueh and Tienda 1996; Eliason et al, 1999). Clogg et al. (1990) report that Hispanic women are most likely to be out of the labor force on a protracted basis, and, conversely, the least likely to be stably employed at any point in time. Donahoe and Tienda (2000) document race and ethnic differences in pathways from school to work that produce larger work experience gaps among adult women compared to adult men. Therefore, we expect that race and ethnic disparities in mature women’s employment
3
and wages derive partly from the dynamics of their early employment experiences (Tienda et al. 1999; Ahituv et al. 2000).
Job Turnover Job changing during the early career is a critical component of men’s movement toward stable employment which is typically associated with wage gains (Borjas and Rosen 1980; Topel and Ward 1992). From the perspective of job search theory, turnover permits workers to learn about their comparative market advantages by sampling a variety of jobs. Search theory suggests that average turnover rates will decline as workers mature because most “learning” takes place in the initial matches, and because the benefits of subsequent job changes diminish as workers age. Both Topel and Ward (1992) and Klerman and Karoly (1994) provide confirming empirical evidence. Based on an analysis of job mobility of young white men, Topel and Ward concluded that during the first 10 years in the labor market a typical worker will hold seven jobs – twothirds of his career total. Similarly, Klerman and Karoly argued that by age 22 or 23, rates of turnover slow, as over half of all high school graduates will have held a job that lasts more than three years. Although a solid body of research established that early job changing is highly beneficial (for men) because it yields greater wage gains than remaining with one employer (for example, Borjas and Rosen 1980; Topel and Ward 1992), recent evidence questions the merits of this generalization for younger cohorts. In their extensive research on work and opportunity for young white men, Bernhardt and associates (1998) claim that recent cohorts failed to capture significant wage growth from job changing precisely when it is most critical—early in the job search process. They also report a drop in the returns to job changing at later ages, notably
4
during the mid-30s. In other words, not all turnover productive in improving the worker-job match, and excessive turnover, particularly among older workers, may be counterproductive. By contrast to men, very little is known about turnover experiences of women, including race and ethnic differences because relatively few studies examine the patterns and consequences of turnover for women. Several authors find that childbearing decisions go a long way toward explaining women’s job turnover (Felmlee 1995; Glass 1988; Keith and McWilliams 1997). Yet, Keith and McWilliams (1997) show that wage gains associated with quits were similar for men and women. Abbott and Beach (1994) find that Canadian women who change jobs realize a short-term wage gain of 8 to 9 percent, on the average. While shedding light on some aspects of women’s job changing, research on female turnover leaves other aspects unexplored. In particular, there is relatively little evidence about how job turnover influences women’s labor force attachment or its future wage consequences.
Timing and Intensity of Employment Dynamics Labor force and employment transitions can produce either positive or negative consequences, depending on timing and frequency. Because transitions among employers are one mechanism to optimize wages and the worker-job match, turnover is conducive to economic mobility. Mobility refers to the employment dynamics that undergird the process of career development, and assumes wage and occupational status gains. From this perspective, job turnover is the “building block” of career formation and should enhance adult labor market outcomes. However, job turnover does not always shape careers or optimize wages, and excessive turnover (i.e., churning) probably reflects poor employment prospects, especially among mature workers. Likewise, labor force transitions may facilitate or undermine market
5
attachment, depending on their frequency and the reasons for departures (i.e., for more schooling, family formation, relocation, or job changes). Like churning, excessive labor force transitions can undermine adult labor force attachment independently on its timing over the life cycle (Alon et al. 2000; Gottschalk and Moffitt, 1994; Hsueh and Tienda, 1995). To distinguish mobility from churning in job turnover, and weak from strong attachment in labor force instability, it is necessary to consider both the timing and frequency of transitions made during the early life course. We hypothesize that job turnover and labor force transitions will not have uniform effects on employment outcomes, and that their consequences depend on the timing and intensity of both. Frequent job turnover among adults may reflect weak labor force attachment because “shopping and thrashing” is considered normative only for young workers. Therefore, we expect that moderate frequency of labor force instability during adolescence is inconsequential for adult outcomes, but frequent labor force transitions, especially at mature ages, undermine adult women’s labor force attachment and wage prospects. Accordingly, we depict the complex nature of women’s labor force activity from a life course perspective, and evaluate the consequences of early experiences for employment and wages at age 30. We first portray the distribution of young women’s monthly transitions by destination employment statuses. From these histories we create cumulative measures that characterize how job turnover (employer to employer transitions) and labor force transitions (employment to non-employment and vice versa) shape work careers over the early life course. We subsequently examine the impact of transition profiles on the employment and wages of black, white and Hispanic women at age 30.
6
Data We analyze the National Longitudinal Survey of Youth (NLSY), a national probability sample of 12,686 individuals ages 14-21 as of January 1, 1979, who were re-interviewed annually until 1994. We restricted our sample to women (dropping 6403 men). The original NLSY sample also contained an oversample of youth who were enlisted in the military as of 1979. This sample was followed until 1984 and then dropped from the study. Because this military sample is not randomly drawn, we exclude the 1,357 observations of this oversample from our analysis. We also limit the analysis to women who were ages 13-16 as of 1978 in order to minimize problems caused by left censoring of labor market participation (dropping 2,346 women). Because many respondents ages 18-21 at the first interview already had held one or more jobs, their inclusion in the sample would bias analyses of adolescent work experience. Oversamples of black and Hispanic youth provided by the NLSY are included to maximize sample sizes for tabular comparisons with white youth, but also because these samples are randomly drawn.1 Missing data in 741 work histories further reduced the sample to 1,780 young women, including 847 whites, 568 blacks, and 365 Hispanics, whose work careers are observed for 15 years. We use the NLSY Work History file containing weekly employment status for each respondent to construct a monthly history of primary employment status based on the job in which respondents worked the most hours per month. That respondents average 200 person-
1
We excluded the oversample of economically disadvantaged white youth (n=59) because our extensive diagnostic analyses revealed significant differences between the white random and nonrandom samples, which was not the case for the Hispanic and Black samples. The inclusion of minority oversamples does not distort statistical inferences because they are statistically similar to the random sample.
7
months in their work history records enables us to track more precisely all employment transitions from ages 16 to 30.
Descriptive Results Employment status The descriptive analysis characterizes young women’s labor force status from age 16 to 30 and identifies the periods when most employment transitions occur. Initially, we construct a three-category monthly labor force experience variable for every month between the ages 16 and 30. This variable is based on the employment status in the beginning of each month. We classify women in full-time employment (FT) if they were employed 35 hours or more at the beginning of the month; in part-time employment (PT) if they were employed 34 hours or less; or in nonemployment (NP) if they were unemployed or out of the labor force. Figure 1, which presents age-specific employment states, shows that the share of women in full-time employment rises with age and plateaus around 57 percent at age 25. Concomitantly, the shares of women working part-time or not at all decline with age and also stabilize around age 25, at 12 percent for parttime employment, and 31 percent for non-employment. These results reinforce many prior studies that designate age 25 as the marker for young adulthood. Figure 2 depicts the employment profiles of black, white and Hispanic women employed full-time. Race and ethnic disparities emerge among adolescent women, but converge for blacks and Hispanics after age 22. Prior to age 25, white and Hispanic women are more likely than black women to be employed full-time. From age 22 to 25 white women increase their participation in full-time employment, thus creating a gap between them and minority women. However, after age 26, this gap starts to diminish as white women lower their share in full-time employment and minority women increase their full-time activity. By age 30 there is little 8
differentiation in employment status as 55 percent of both Hispanic and black women are employed full-time compared to 57 percent of white women. This indicates that race/ethnic employment inequities evident early in the life course do not persist into mature adulthood. (Figures 1-4 about here) Figures 3 and 4 depict racial/ethnic differences in part-time employment and nonparticipation. Although the shares of women employed part-time decline for all groups, the levels vary among blacks, whites, and Hispanics. White women are more likely to be employed part-time compared to minority women between ages 16 to 21, and also between 25 to 30 – age ranges that capture two different developmental stages. At younger ages, part-time employment occurs in conjunction with school enrollment (Donahoe and Tienda, 2000), while at the older ages it permits women to remain attached to the market while they raise their families. The profiles of full- and part-time employment reported in Figures 1-3, imply that at any age white women are less likely than minority women to be out of the labor force. At younger ages, black women are more likely than Hispanics to be out of the labor market, but after age 22 these differences are negligible. A broad geralization graphs 1 to 4 is that women’s labor force dynamism is concentrated at younger ages, with relative stability achieved around age 25. Although the share of women who are not employed stabilizes after this age, there is no guarantee that the same women remain inactive over time. Therefore, it is important to ascertain how early dynamics in labor force careers, which virtually all women experience, eventuates in stable work careers for some and unstable trajectories for others.
Timing, quantity and type of transitions To represent these employment dynamics, we record all months in which either employment or labor force transitions occur and calculate the percentage of transition months 9
relative to the total number of months women are at risk of experiencing a transition. Table 1, which displays transition frequencies, confirms prior work for men showing that most work transitions occur at younger ages. The frequency of transitions rises after age 16, where 9 percent of all person months recorded a transition, and peaks at age 18, where more than 12 percent of all person months involved a transition. By age 30, only 5 percent of all person months involved a work-related transition. However, there are substantial race and ethnic differences in the timing and frequency of transitions. White women experience more work transitions compared to minority women, especially early in their work careers. At age 18, when white women’s labor force transitions peak, 15 percent of their person months involved workrelated transitions, compared to 12 and 9 percent of comparably-aged Hispanic and black women, respectively. (Table 1 about here) The age pattern of transitions is similar for white and Hispanic women (although different in level), but the distribution of transition months for black women is less age differentiated. This representation confirms previous evidence regarding the variation in pathways from school-to-work. Because white women are much more likely to combine work and school than minorities (Donahoe and Tienda, 2000), they experience more transitions than black and Hispanic women women, especially early in their work careers. The lower frequency of transitions experienced by black women reflect several factors, including their delayed age at labor market entry, early childbearing, prolonged schooling, and high unemployment rates vis-avis Hispanics (Donahoe and Tienda, 2000; Tienda, et al., 1999; Eliason, et al., 1999). Hispanic women exit school prematurely but also delay labor market entry compared to whites, but are less likely than blacks to experience births as teens (Ahituv and Tienda, 1999). These social and
10
demographic circumstances partly explain why Hispanics experience fewer employment transitions than whites, but more than blacks. If work transitions are an important mechanism to optimize worker-job matches, as search theory alleges, these differentials imply fewer opportunities for black women to enhance their market options early in the life course. Compared to blacks, white and Hispanic women apparently shop and thrash more before stabilizing their work careers. Because white women generally fare better in the labor market than their minority counterparts, it is conceivable that the higher levels of dynamism in their early careers contribute to their adult successes. We evaluate this possibility below. Table 1 captures both labor force and employer transitions. To consider whether these two types of work-related transitions peak at different stages in the life course, we disaggregate all transitions by their origin and destination states in order to distinguish labor force instability from job turnover. Women’s market dynamics depend on their current state, whether a transition occurs between t1 ands t 2, and the destination state. If, for example, a woman is currently employed full-time, her transition alternatives include: moving to another full-time job (turnover); moving to part-time employment (turnover that involves change in labor supply); or moving to non-employment (labor force transition). A part-time worker faces a similar set of options, but jobless women can transit only to full-time or part-time employment if they do not remain inactive. Appendix A presents all sets of transition alternatives. As women move between labor force states, their choices may differ because of other changes in their life course, notably changes in human capital and in family statuses. Table 2, which displays destination states conditional on the occurrence of a transition, provides important insights about the interplay among the timing, frequency, and type of
11
transition. Age 18 is the peak age for making work-related transitions of all types, but the peak age for full-time to full-time transitions occurs at age 23, when 32 percent of the transitions involve moves between full-time jobs. The FT-FT transitions decline gradually until age 30, when 25 percent of all transitions involve full-time job turnover. By contrast, the FT-PT transitions are relatively infrequent and age-invariant. Most transitions from full-time work to nonemployment occur at early ages, and then decline gradually, ebbing at age 22, but rise again during the peak childbearing years. Transitions from part-time to full-time employment rise continuously from age 16 to 30, as do transitions from non-employment to full-time employment. It appears that the peak transition age 18 described earlier mainly captures labor force transitions, while most job turnover occurs at later ages, especially between 20 and 25. (Table 2 about here) To consider whether patterns of turnover and labor force transitions differ along race and ethnic lines, Table 3 depicts group differences in transitions from full-time employment and nonemployment.2 At almost every age, white women employed full-time are more likely to move to another full-time job compared to their Hispanic and black counterparts. This indicates that for white women, employment dynamism largely involves job turnover that probably affords the possibility of economic mobility, although it does not guarantee it. Whites also move to parttime employment more than minority women, and consequently are less likely than Hispanic and black women to move to non-employment. A potential benefit of this behavior is that it maintains labor market attachment while also accumulating valuable work experience.
2
We do not present transitions from part-time employment because of sample size constraints in the group–specific tabulations.
12
Because there are no major group differences in the destination of transitions from nonemployment, it is not obvious whether race and ethnic differences in young women’s early work dynamics will persist into adulthood. Also, white women’s higher turnover also puts them at greater risk for churning, which may produce offsetting wage and employment benefits. Indeed, as we demonstrate below, the consequences of labor force instability and turnover depend crucially both on their frequency and timing. (Table 3 about here) Instability and Turnover This exercise of unfolding transitions by their origin/destination states illustrates the key distinction between turnover and labor force instability, but also highlights the importance of age and race variation in both aspects of labor force dynamism. In order to assess the employment and wage consequences of young women’s early market dynamics, we collapse all job turnover related transitions (FT-FT, FT-PT, PT-FT and PT-PT) and collapse all labor force related transitions (FT-NP, PT-NP, NP-FT and NP-PT) to create cumulative variables depicting the intensity of job turnover and labor force instability. Job turnover reported in Figure 5 refers to accumulated number of transitions between two employers.3 More than a half of all job turnover involved no change in hours worked (i.e. they were from FT to FT or from PT to PT).4 Labor force transitions depicted in Figure 6
3
We used a restrictive definition of job turnover and labor force instability, counting only employment spells that lasted more than 4 consecutive months. Analyses that are based on a more conservative definition are available from the author upon request. That results are similar using either measure attests to the robustness of the findings.
4
Twenty-nine percent of job transitions were from PT to FT, and an additional 19 percent were from FT to PT.
13
indicate the cumulative number of shifts between non-employment and employment (either FT or PT) and vice versa. Figure 5 shows substantial race and ethnic differences in turnover levels. Starting from age 16, white women experience more job turnover than blacks and Hispanics, and the gap between them and minority women widens over time. By age 25, white women averaged 2.7 job transitions, but Hispanic and black women only averaged 1.6 and 1.4 transitions, respectively. By age 30, white women made 3.6 transitions compared to 2.3 for Hispanics and 2.2 for blacks. Nonetheless, it is not clear if white women’s turnover is productive in promoting economic mobility, or if it reflects churning and signals poor employment prospects. (Figures 5-6 about here) Labor force transitions depicted in Figure 6 reveal similar race and ethnic differentials as observed for turnover—i.e., white women experience more labor force instability than minorities, but group differences are less pronounced. By age 25 white women accumulated 4.9 labor force transitions, while Hispanic and black women averaged 4.1. Five years later, the respective average frequencies were 6.5 for whites compared to 5.8 for minorities. While instructive about the dynamics of women’s early work careers, these descriptive tabulations do not address whether job turnover and labor force instability enhance adult employment status and wages, and whether race and ethnic differences in early experiences persist into adulthood. Answers to these queries require multivariate analyses because the observed differences in employment and wages at age 30 could simply reflect the varying educational investments of minority and non-minority women rather than the manner in which their work experience profiles were achieved. We turn to these issues next.
14
Multivariate Analysis To examine the impact of early work dynamics on labor force status and wages received at age 30, we estimate a series of logistic and OLS regressions using employment status (employed/not employed) and hourly (LN) wage at age 30 as dependent variables. Our main independent variables capture the effects of timing and frequency of transitions at three periods of the early life course. Accordingly, we divided the transition measures into three age periods representing late adolescence (16-20), early adulthood (21-25), and mature adulthood (26-29), respectively. These periods correspond roughly with the transition from high school to work or college; the transition from college for those who attend; and mature work status after age 25, which is the standard age marker for adult workers. After extensive diagnostics, accumulated job transitions and labor force transitions were divided into three categories for the designated age periods: zero, 1-2, and 3 or more transitions. In all models, zero transitions serve as the comparison group. Table 4 reports descriptive statistics for the standard set of covariates used in labor market analyses. Background characteristics include young women’s education and scholastic aptitude; family status variables (marital status and number of children at age 29), and conventional indicators of family background, including household income in 1979, family structure when the respondent was 14, mother’s completed education (in years), and whether the respondent’s mother worked in 1978-79. We also calculate two conventional experience measures, the number of years employed full-time and part-time through age 29 in order to
15
appreciate better the value of specifying how work experience is acquired.5 Because the returns to work experience decrease over time, we conclude square terms for both measures in the empirical models. (Table 4 about here) To estimate the effects of turnover and stability on employment status at age 30, we begin with a base model that only takes account of minority group status. Model 2 adds characteristics known to govern labor market behavior, including accumulated work experience, education and scholastic aptitude, family status, and selected family background indicators. Model 3 adds the job and labor force transition measures (up to age 25) in lieu of the aggregate experience terms to depict variation in the acquisition of market experience.6 Similarly, the analyses of hourly (ln) wages at age 30 begin with a baseline model that includes race/ethnic variables and an indicator for full-time versus part-time employment. We use bootstrap procedures to obtain statistical accuracy.7 Following the logic of the employment status regressions, Model 2 includes the standard human capital variables and women’s current occupation, while Model 3 includes the turnover and instability measures representing profiles of early work experiences. Because zero transitions made at any given period capture the labor force behavior of both stably active and stably inactive women (Clogg et. al 1990; Hsueh and
5
The aggregate experience measures obtained by dividing the number of months in FT and PT employment by the number of months in each year, hence are more precise than conventional measures, especially those based on census-type surveys that use variants of age.
6
Because the transition measures are a lagged version of the dependent variable, for women with protracted jobless or employment spells, the potential for endogeneity is high if transition measures between ages 26 and 29 are included in the employment equations. This problem does not arise for the wage analyses.
7
The accuracy of bootstrap estimates depends partially on the number of replications in the bootstrap. We estimate standard errors from 1000 replications, which is believed to produce reliable estimates (Efron 1990).
16
Tienda 1995; and Alon, et al., 2000), 8 in order to distinguish between stable inactivity and stable activity we controlled for the share of time spent in non-employment in each life cycle stage.
Results Employment status at age 30 Consistent with the descriptive results presented above, the gross effects of race and Hispanic origin on the odds of being employed at age 30 are negative. That is, ignoring early work experiences and human capital investments, the odds that Hispanic and black women are employed either full- or part-time at age 30 are approximately two-thirds the odds of white women. Hispanic-white differences disappear after adjusting for group differences in educational attainment, accumulated work experience, labor market aptitude (AFQT), and family status at age 29. In model 2, the race effect is reversed, such that black women are 60 percent more likely to be employed at age 30 than statistically comparable whites. In the interest of parsimony, we do not dwell on the background variables, but rather focus on the employment consequences of educational attainment, work experience, and more refined measures of early market experiences with labor force instability and job turnover. (Table 5 about here) Consistent with a vast empirical literature, college graduates are significantly more likely to be employed at age 30 relative to women with only a high school degree. Also, every
8
The labor force experience classification divides experiences into three categories: stably active, defining women with stable employment activity; unstably active, for women who experience both employment and nonemployment spells in a given period; and stably inactive, for jobless women (Clogg et. al 1990; Hsueh and Tienda 1995; and Donahoe et al. 1999).
17
additional year of work experience (either FT or PT) increases the odds of employment at age 30 by 33 percent.9 Beyond the substantial effect of accumulated work experience on employment status at age 30, the transition variables add nothing to the predictive power of the model.10 That is, above and beyond the actual experience gained while employed, instability and turnover neither raise nor lower the odds that a woman will be employed at age 30. However, the point estimates suggest that 3 or more labor force transitions between ages 21 and 25 incur labor force consequences, lowering the odds of employment at age 30 to only 70 percent of the odds for women with zero transitions at these ages. This effect is especially notable among white women, whose frequent labor force transitions lower the odds for employment to only 58 percent of their counterparts with zero labor force transitions at that age.11 Similar consequences of instability do not obtain for minority women. Also, for white women there is an intriguing relationship between the timing and frequency of job turnover, where a moderate number of transitions (1-2) raise mature women’s odds of employment, while frequent transitions (3 or more) lower the odds of employment at age 30. This suggests that early instability and job churning may undermine market attachment at later ages, but this conclusion is tentative because the results are not robust. Analysis of wages at age 30 provides more insight into this possibility.
9
This is a very large effect, but is evident in cross tabulations between the dependent variable and the experience measures. This result reflects a highly skewed experience distribution wherein most women are located at the lower end of the distribution. That we use a very precise measure of work experience, which is constructed based on the number of months in each state, also increases the sensitivity of this measure. However, our results are robust to alternative specifications, including more aggregated measures. These results are available upon request.
10
Comparing the pseudo R2 of the models there is no evidence for the added explanatory power of early workrelated transitions on mature women’s employment. The simple model that considered accumulated experience fit better than the models with the transitions variables. 11
Additional results (not presented here) obtained from the replication of model 3 for each racial/ethnic group.
18
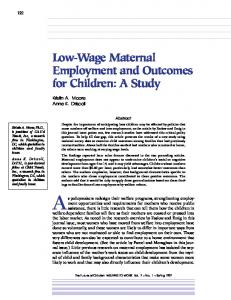
Wage at age 30 The base model reported in Table 6 shows the effects of race and ethnic origin on hourly wages of employed women. After controlling for labor supply (full-time/part-time employment), we find that employed black women earn lower wages than statistically equivalent white women. Differences in educational attainment, occupation and work experiences (model 2) or in labor force experience via instability and turnover (model 3) slightly attenuate, but do not eliminate the racial wage gap. By contrast, Hispanic women with comparable education and work experience or with equivalent instability and turnover profiles, earn 7 percent more than comparables whites. (Table 6 about here) The age-specific transition measures show that job turnover between ages 16-20 has trivial effects on women’s wages at age 30. This is consistent with predictions of human capital theory, which predicts diminished effects over time. Sociologically, this result is consistent with the exploratory character of adolescents’ unstable labor market behavior as they define interests and discover opportunities to actualize them. However, job turnover during young adulthood (ages 21-25) has lasting consequences on adult women’s wage prospects. At that period 1 or 2 transitions are associated with wage gain of 6 percent, while 3 or more transitions incur a wage penalty of 11 percents. Wage penalties accrue to all turnover experienced by mature women (ages 26 to 29), whose excessive job changes after age 25 lower wages on the order of 8 to 11 percent for one to two, and three or more job changes, respectively. These results point toward a process where job turnover serve as a tool for refining and shaping careers during adolescence and young adulthood, but become churning at later ages.
19
Unlike turnover, adult wage consequences of adolescent labor force instability appear to persist into adulthood. Surprisingly, women who experienced one to two labor force transitions during late adolescence incurred substantial wage penalties as mature workers, as did adult women who made three or more labor force transitions between ages 26 and 29. Moreover, spending time out of the labor force after age 21 also incurs appreciable wage penalties among adult women, probably reflecting the divide between women who are attached to the market and establish work careers and those who do not. Because the descriptive tabulations show appreciable group differences in the age pattern of turnover and instability, we investigate whether the benefits and costs of turnover and instability are uniform among black, white and Hispanic women. Table 1 shows that black women’s transition profile was quite flat, especially during the pivotal ages of career shaping (21-25). Table 7, which replicates model 3 for each group, reveals that minority and nonminority women differ not only in their transition patterns, but also in the “returns” to transitions experienced early in their life course. Specifically, black women who experience 1 or 2 transitions between ages 21 and 25 witnessed wage gains of 11 percent relative to their counterparts who had no transitions. Black women are also sensitive to labor force transitions during adolescence, as those who experience 3 or more transitions between ages 1620, receive 20 percent higher wages at age 30 compared to stable black women. That black women appear to benefit more from both (early) labor force instability and turnover probably reflects their success in overcoming obstacles that keep large shares out of the workforce at very young ages (Donahoe and Tienda, 2000; Eliason et al, 1999). In other words, black women who are able to move freely in and out of the labor force, especially at the early stages of their career formation, probably differ in unobserved ways both from those who are unable to enter the
20
workforce at all (stably inactive) and those who remained employed in the same jobs (which covered the dead-end jobs). For whites and Hispanics, the wage consequences of labor market dynamics derive largely from excessive turnover among young adults rather than early instability and employer transitions. (Table 7 about here) Discussion By age 30 white women are more likely to be employed either full or part time, and to earn more compared to Hispanic and black women. We trace these employment and wage inequalities to young women’s early work experiences to consider whether and how much the manner in which work experience is acquired contributes to race and ethnic employment and wage dispersion among young adult women. We show that neither labor force transitions or turnover influence employment status at age 30, but both aspects of early dynamism in early market activity influence wages. Also, we demonstrate that both the timing and number of transitions over the life course are important mechanisms producing these effects. Therefore, we tentatively conclude that a moderate quantity of job changing during the early work career enhances adult women’s wages. Furthermore, we demonstrate that at early ages, job turnover exerts stronger effects on adult wages than labor force instability. As for young men, women’s labor force dynamism is concentrated during the early stages of career formation, mostly up to age 25, but settles thereafter as women’s attachment to the market is solidified and work careers mature. Most transitions made up to age 18 involve labor force entry and exit, but from approximately high-school onward, job turnover is the more salient aspect of market dynamism. Race and ethnic disparities in the frequency of transitions are especially pronounced during late adolescence and early adult ages, when white women
21
experience more transitions than minority women. White women’s transitions are more likely to involve job changes (turnover) compared to blacks and Hispanics, which is economically significant because turnover presumes continuous employment and is more conducive to economic mobility, while labor force instability often has the opposite effects.12 That race wage gaps at age 30 are diminished after modeling early employment dynamics illustrates the economic consequences of early labor market behavior for later adult outcomes. Wage disparities among 30-year-old black, white and Hispanic women reflect not only differences in the amount of accumulated experience – which is the focus of most studies of market outcome – but also by the ways work experience is acquired over the life cycle. The complex nature of women’s labor market dynamics is simplified by our life cycle depiction of the timing and frequency of transitions and job changes used to distinguish between mobility and instability. Figure 7 presents women’s wages at age 30 for different levels of job turnover over the life course. This figure illustrates the process where turnover, which is initially an important component of career development, becomes churning. A moderate number job transitions during the pivotal stage of career formation, approximately between ages 21-25, appear to optimize the worker-job match and increase wages. However, excessive job turnover at these ages and all job turnover at later ages, incurs significant wage penalties. Similarly, labor force transitions after age 26 also incur significant wage penalties and weaken women’s labor force attachment at age 30. (Figure 7 About Here)
12
We also examined effects of turnover via episodes of joblessness and find that this form of turnover is very rare and no additional information is gleaned from this refinement. Results are available upon request.
22
Despite these insights, our approach permits only approximate distinctions between employer transitions that represent churning and those that capture the process of career shaping. That is, the timing and frequency of transitions are important, but they do not adequately portray the quality of transitions. Further refinement of the transitions is required to designate more precisely which employer transitions signal upward mobility and which constitute churning or downward mobility. This line of inquiry, based on a fully dynamic estimation framework, may help explain better race and ethnic dispersion in women’s wages, which indicate differential benefits and costs of instability and turnover for blacks, whites, and Hispanics. Nevertheless, our analysis helps fill the immense research gap about the consequences of young women’s labor force dynamics. In an effort to understand the complexity of work-related transitions, we elaborate some conceptual underpinnings and make an important empirical stride. Future research should build on our distinction between career shaping and churning, which ultimately are the cornerstones of the mobility-instability debate, and the foundations of market inequality.
23
REFERENCES Abbott, M. G., and Beach, C. M. (1994). “Wage Changes and Job Changes of Canadian Women.” The Journal of Human Resources, 29(2), 429-460. Ahituv, Avner, Marta Tienda, and V. Joseph Hotz. 2000. “The Transition from School to Work: Black, Hispanic and White Men in the 1980's.” Pp. 250-258 in Ray Marshall (ed.) Back to Shared Prosperity. Armonk, NY: M.E. Sharpe. Ahituv, A., and Tienda, M. (1999). “Early Employment Activity and School Continuation Decisions of Young White, Black and Hispanic Women.” Princeton University, Unpublished Manuscript (June). Alon, S., Tienda, M., and Donahoe, D. (2000). “The Effects of Early Work Experience on the Establishment of Stable Labor Force Careers among Young Women.” (under review). Anderson, P. M. and Meyer, B.D. (1994). "The Extent and Consequences of Job Turnover." Washington D.C., Brookings Institute, unpublished manuscript. Bernhardt, A., Morris, M., Handcock, M., and Scott, M. (1998). “Job Instability and Wage Inequality among Young Men: A Comparison of Two NLS Cohorts.” Presented in the Russell Sage Foundation's Conference on Changes in Job Stability and Job Security. Blau, F. D. (1998). “Trends in the Well-Being of American Women, 1970-1995.” Journal of Economic Literature, 36(March), 112-1165. Borjas, G., and Rosen, S. (1980). “Income Prospects and Job Mobility of Younger Men.” Research in Labor Economics, R. G. Ehrenberg, ed., JAI Press, Greenwich, CT, 159-81. Bowler, M. (1999). "Women's earnings: an overview." Monthly Labor Review, December 1999: 13-21. Clark, K. and Summers, L. (1979). “Labor Market Dynamics and Unemployment: A Reconsideration.” Brookings Papers on Economic Activity, 1, 13-72. Clogg, C. C., Eliason, S. R., and Wahl, R. J. (1990). “Labor Market Experiences and Labor Force Outcomes.” American Journal of Sociology, 95, 1536-76. Devine, T. and Kiefer, N. (1993). “The Empirical Status of Job Search Theory.” Labour Economics, 1, 3-24. Donahoe, Deborah and Tienda, M. (2000). “The Transition from School to Work: Is there a Crisis and What Can Be Done?” Pp._ in Sheldon Danziger, Jane Waldfogel (eds.). Securing the Future: Investing in Children from Birth to College. New York: Russell Sage Foundation.
24
Efron, B. (1990). “More Efficient Bootstrap Computations.” Journal of the American Statistical Association, 85, 79-89. Eliason, Scott R. et al., 2000. “Labor Market Experience & Labor Force Outcomes: 15 Years of Race and Sex.” Paper presented the 2000 Population Association of American Annual Meeting, Los Angeles, CA. England, P. (1982). “The Failure of Human Capital Theory To Explain Occupational Sex Segregation.” The Journal Of Human Resources, 17(3), 358-370. Felmlee, D. H. (1982). “Women's Job Mobility Processes within and between Employers.” American Sociological Review, 47(Feb), 142-151. Felmlee, D. H. (1984). “Dynamic Analysis of Women's Employment Exits.” Demography, 21(2), 171-183. Felmlee, D. H. (1995). “Causes and Consequences of Women's Employment Discontinuity, 1967-1973.” Work and Occupations, 22(2), 167-187. Glass, J. (1988). “Job Quits and Job Changes: The Effects of Young Women's Work Conditions and Family Factors.” Gender and Society, 2(2), 228-240. Gottschalk, P. and Moffitt R. (1994). “The Growth of Earnings Instability in the U.S. Labor Market.” Brookings Papers on Economic Activity, 2, 217-272. Hill, A. M., and O'Neill, J. E. (1992). “Intercohort Change in Women's Labor Market Status.” Research in Labor Economics, 13, 215-286. Hsueh, S., and Tienda, M. (1995). “Earning Consequences of Employment Instability among Minority Men.” Research in Social Stratification and Mobility, 14, 39-69. Hsueh, S., and Tienda, M. (1996). “Gender, Ethnicity, and Labor Force Instability.” Social Science Research, 25, 73-94. Keith, K., and McWilliams, A. (1997). “Job Mobility and Gender-Based Wage Growth Differentials.” Economic Inquiry, XXXV(April), 320-333. Klerman, J. A. and Karoly, L. A. (1994). "The Transition to Stable Employment: The Experience of U.S. Youth in Their Early Labor Market Career." National Center for Research in Vocational Education, University of California-Berkeley. Light, A., and Ureta, M. (1995). “Early-Career Work Experience and Gender Wage Differentials.” Journal of Labor Economics, 13(1), 121-154.
25
Mare, R. D. (1995). "Changes in Educational Attainment and the Timing of Entry into Parenthood." State of the Union: America in the 1990s, R. Farley, ed., New York, Russell Sage Foundation. Muhleisen, M., and Zimmermann, F. K. (1994). “New Patterns of Labor Mobility: A Panel Analysis of Job Changes and Unemployment.” European Economic Review, 38, 793-801. Neal, D. (1999). “The Complexity of Job Mobility among Young Men.” Journal of Labor Economics, 17(2), 237-261. Rexroat, C. (1992). “Changes in the Employment Continuity of Succeeding Cohorts of Young Women.” Work and Occupations, 19(1), 18-34. Tienda, M. and Stier, H. (1996). “Generating Labor Market Inequality: Employment Opportunities and the Accumulation of Disadvantages.” Social Problems, 43, 147-165. Tienda, Marta, V. J. Hotz, Ahituv, A. and Michelle Bellessa. 1999. “Employment and Wage Prospects of Black, White, and Hispanic Women: Evidence from the 1980s and Early 1990s.” Working Paper #99-4, Princeton University: Office of Population Research. Topel, R. H., and Ward, M. P. (1992). “Job Mobility and the Careers of Young Men.” The Quarterly Journal of Economics, May, 439-479. United States Department of Education (1994). Digest of Education Statistics. Washington, D.C., U.S. Government Printing Office. Waldfogel, J. (1998). “The Family Gap for Young Women in the United States and Britain: Can Maternity Leave Make a Difference?” Journal of Labor Economics, 16(3), 505-545.
26
Figure 1 Age-Specific Distribution of Women's Person-Months among Employment States (n=~ 23,200 person months for each age)
90 80
Percent of person months
70 60 50 40 30 20 10 0 16
17
18
19
20
21
Full-Time
Source: NLSY WorkHistory File
22
23
Part-Time
24
25
26
Non-Employment
27
28
29
30
Figure 2 Age-Specific Shares of Women's Person-Months in Full-Time Employment by Race (n=~ 23,200 person months for each age)
90 80
Percent of person months
70 60 50 40 30 20 10 0 16
17
18
19
20
21
22
Hispanic
Source: NLSY WorkHistory File
23 Black
24
25
White
26
27
28
29
30
Figure 3 Age-Specific Shares of Women's Person-Months in Part-Time Employment by Race (n=~ 23,200 person-months for each age)
90 80
Percent of person months
70 60 50 40 30 20 10 0 16
17
18
19
20
21
22
23
Hispanic
Source:NLSY WorkHistory File
24 Black
25 White
26
27
28
29
30
Figure 4 Age-Specific Shares of Women's Person-Months in Non-Employment by Race (n=~ 23,200 person months for each age)
90 80
Percent of person months
70 60 50 40 30 20 10 0 16
17
18
19
20
21
22
23
Hispanic
Source:NLSY WorkHistory file
24 Black
25
26
White
27
28
29
30
Figure 5 Turnover: Cumulative Employer Transitions by Race (emp. spells of 4+ months) n=1780 women
7
6
Number of transitions
5
4
3
2
1
0 16
17
18
19
20
21
22
23
Hispanic
Source:NLSY WorkHistory File
24
Black
25
26
White
27
28
29
30
Figure 6 Instability: Cumulative Labor Force Transitions by Race (emp. spells of 4+ months) n=1780 women
7
6
Number of Transitions
5
4
3
2
1
0 16
17
18
19
20
21
22
Hispanic
Source:NLSY WorkHistory File
23
Black
24
25
White
26
27
28
29
30
Figure 7 Wage at age 30, by Timing and Frequency of Job Transitions 12.5 Career Shaping
Churning
12
*
Hourly Wage 30
11.5
*
11
*
10.5
*
10
9.5
9 0 16-21
1 to 2
3+
0 21-25
1 to 2
3+
0
1 to
26-29
2
3+
* Significant at OLS Regression (Table 6)
Table 1 Transition Months as Shares of Age-specific Person-months by Race
Total N of person months
Transition person months
Transition Months as Share of Total Person Months Total
16 17 18 19 20 21 22 23 24 25 26 27 28 29 30
20114 23189 23187 23212 23267 23224 23215 23186 23269 23203 23212 23211 23262 23207 23194
1812 2484 2850 2704 2503 2313 2105 1730 1632 1547 1523 1449 1359 1231 1185
Source: NLSY Work History Files
9.0 10.7 12.3 11.6 10.8 10.0 9.1 7.5 7.0 6.7 6.6 6.2 5.8 5.3 5.1
Hispanic
Black
White
8.9 10.6 11.8 10.6 9.2 9.2 7.7 6.9 6.4 5.9 6.1 5.7 5.6 5.0 4.5
5.8 7.6 8.8 9.0 9.5 9.1 8.3 7.2 7.1 6.9 6.4 6.4 5.7 5.2 5.3
11.4 12.9 14.8 13.8 12.3 10.9 10.2 7.9 7.2 6.8 6.9 6.4 6.0 5.5 5.3
Table 2 Age-Specific Distribution of Young Women’s Monthly Transitions by Origin State (Percentages)
All Transitions Age
Transition Person Months
16 17 16 17 18 19 20 21 22 23 24 25 26 27 28
1812 2484 2850 2704 2503 2313 2105 1730 1632 1547 1523 1449 1359 1231 1185
Transition Months as Share of Total Person Months
Transitions from FT Employment FT-FT
FT-PT
FT-NE
9.0 3.8 14.6 10.7 9.9 16.4 12.3 12.4 16.5 11.6 16.0 16.3 10.8 22.0 15.3 10.0 22.8 14.8 9.1 28.8 14.5 7.5 31.5 14.1 7.0 31.6 14.1 6.7 31.7 13.5 6.6 28.2 11.7 6.2 29.5 15.6 5.8 25.9 13.1 5.3 23.7 16.2 5.1 25.3 17.6 Source: NLSY Work History Files
81.6 73.7 71.0 67.8 62.7 62.4 56.8 54.5 54.3 54.8 60.1 54.9 61.0 60.1 57.2
Transitions from Non-Employment
Transitions from PT Employment
Person Months
PT-PT
PT-FT
PT-NE
Person Months
NE-FT
NE-PT
Person Months
185 353 611 704 732 710 726 683 668 668 634 654 579 511 467
23.3 21.4 18.1 16.2 18.0 16.6 15.8 12.0 11.7 16.1 15.7 12.9 15.9 16.8 20.4
5.8 16.3 20.2 22.5 21.2 25.7 31.9 33.3 35.4 32.3 32.9 33.9 33.7 35.0 35.1
70.9 62.2 61.7 61.3 60.7 57.8 52.4 54.6 53.0 51.6 51.4 53.2 50.4 48.2 44.4
725 1059 1073 882 782 694 584 399 379 316 350 295 276 297 279
20.3 28.5 40.7 48.5 47.8 51.8 59.8 65.6 64.6 66.1 66.4 64.8 66.9 62.2 61.3
79.7 71.6 59.3 51.5 52.2 48.2 40.3 34.4 35.4 33.9 33.6 35.2 33.1 37.8 38.7
902 1072 1166 1118 989 909 795 648 585 563 539 500 504 423 439
Table 3 Age-Specific Distribution of Young women’s Monthly Transitions from Full-Time Job and Non-Employment by Race (Percentages)
Age 16 17 18 19 20 21 22 23 24 25 26 27 28 29 30
H
FT-FT B
2.1 13.4 12.9 19.4 23.3 19.4 30.2 23.9 26.3 29.1 23.9 35.0 25.4 27.8 21.5
2.9 7.7 4.5 11.4 14.4 18.9 21.3 26.3 30.3 29.8 26.5 25.2 22.2 27.7 26.6
Transitions from Full-Time employment FT-PT FT-NE W H B W H B 4.9 9.0 15.3 16.4 24.9 26.3 32.1 37.4 34.2 34.1 31.1 30.2 28.6 19.3 25.9
14.9 7.2 16.8 13.4 10.0 13.6 7.4 13.9 16.1 9.4 11.1 13.0 14.9 14.9 17.2
8.6 10.3 14.2 14.1 17.1 12.4 15.2 15.6 7.2 11.8 11.2 16.2 11.6 13.9 15.2
Note: H = Hispanic; B = Black; W = White
16.5 24.2 17.3 18.1 16.5 16.5 16.5 13.2 17.5 16.1 12.3 16.2 13.4 18.4 19.4
83.0 79.4 70.4 67.2 66.7 67.1 62.5 62.3 57.6 61.5 65.0 52.0 59.7 57.4 61.2
88.6 82.1 81.3 74.6 68.5 68.8 63.5 58.1 62.6 58.3 62.3 58.6 66.1 58.4 58.2
W
Person Months
H
78.6 66.9 67.3 65.6 58.6 57.2 51.4 49.4 48.3 49.9 56.6 53.6 58.0 62.3 54.6
185 353 611 704 732 710 726 683 668 668 634 654 579 511 467
27.9 38.2 43.1 51.0 56.3 61.4 55.3 67.9 63.9 70.8 65.7 64.8 66.7 68.0 75.3
Transitions from Non-Employment NE-FT NE-PT Person B W H B W Months 18.8 30.7 39.0 43.1 47.2 50.9 61.5 66.8 68.8 70.8 75.3 69.9 74.1 63.3 62.1
18.2 23.8 40.7 50.2 45.4 48.8 60.3 63.7 61.8 60.1 60.9 61.0 61.9 59.2 55.1
72.1 61.8 56.9 49.0 43.7 38.6 44.7 32.1 36.1 29.2 34.3 35.2 33.3 32.1 24.7
81.2 69.3 61.0 56.9 52.8 49.1 38.6 33.2 31.2 29.2 24.7 30.1 25.9 36.7 37.9
81.8 76.2 59.3 49.8 54.6 51.2 39.8 36.3 38.2 39.9 39.1 39.0 38.1 40.8 44.9
902 1072 1166 1118 898 909 795 648 585 563 539 500 504 423 439
Table 4 Means and (Standard Deviations) of Independent Variables Variable
Total
Hispanic
Race % Hispanic % Black
20.5 31.9
-
-
17.9 24.8 19.2 52.8 (40.3)
26.6 25.7 9.6 39.5 (34.0)
20.4 28.2 12.9 30.1 (27.0)
12.4 22.1 27.6 73.7 (39.6)
5.7 (3.5) 2.5 (2.1)
5.4 (3.7) 2.1 (2.0)
5.0 (3.4) 1.9 (1.9)
6.4 (3.3) 3.0 (2.2)
52.6 1.48 (1.32)
55.1 1.75 (1.5)
31.7 1.68 (1.43)
65.5 1.23 (1.12)
Human Capital % High-school dropout % Some college % College % AFQT score
Work Experience up to age 29 # of years in FT # of years in PT
Family status at age 29 Married Number of children in household Family Background Mother’s education Family Income ($ 1000) % Mother worked % Female-headed household at age 14 Job Turnover Transitions made between ages 16-20 % 1-2 transitions % 3+ transitions Transitions made between ages 21-25 % 1-2 transitions % 3+ transitions Transitions made between ages 26-29 % 1-2 transitions % 3+ transitions
Black
White
-
10.2 (4.0) 14.4 (13.2) 68.9 20.2
7.5 (4.3) 11.3 (10.1) 63.3 39.8
9.9 (3.7) 9.9 (10.2) 63.7 37.1
11.5 (3.3) 18.7 (14.8) 74.7 9.0
37.5 10.1
30.4 8.8
25.4 3.7
48.6 14.9
42.1 15.4
39.2 9.3
37.9 12.0
46.3 20.4
34.9 7.0
29.0 7.1
35.9 5.3
36.8 8.0 Continues
(Table 4, continued) LF Instability Transitions made between ages 16-20 % 1-2 transitions % 3+ transitions Transitions made between ages 21-25 % 1-2 transitions % 3+ transitions Transitions made between ages 26-29 % 1-2 transitions % 3+ transitions
37.0 45.1
40.5 38.9
37.9 35.6
34.8 54.2
34.8 37.2
37.8 32.9
36.1 35.9
32.6 39.9
35.6 19.2
31.0 19.5
34.5 21.3
38.4 17.6
Occupation % Sales and clerical % Crafts and laborer % Service
24.9 7.6 12.5
26.0 5.5 10.7
24.5 9.9 13.7
24.7 7.1 12.4
Hourly wage at age 30 (Full time emp.) Hourly wage at age 30 (Part time emp.)
11.0 10.9
11.0 12.3
9.7 7.2
11.8 12.1
N
1780
365
568
847
Table 5 Odds of Being Employed at Age 301 (asymptotic standard errors) Model 1
Model 2
Model 3
0.609** (0.082) 0.636** (0.076)
1.186 (0.238) 1.569* (0.301)
1.126 (0.213) 1.404 (0.257)
0.981 (0.025) 0.987 (0.007) 1.016 (0.148) 0.577** (0.096)
0.984 (0.023) 0.994 (0.007) 1.147 (0.157) 0.590** (0.092)
1.042 (0.189) 1.156 (0.201) 1.863** (0.453) 1.001 (0.003)
0.852 (0.144) 1.192 (0.193) 1.726* (0.396) 1.003 (0.002)
0.708* (0.101) 0.998 (0.056)
0.758* (0.102) 0.888* (0.047)
Race/Ethinc Hispanic Black
Family Background Mother’s education Family income Mother worked Female-headed household
Education and Scholastic Aptitude High-school dropout Some college College AFQT score
Family status at age 29 Married Number of children in household
Work Experience2 # of years in FT up to age 29 # of years in PT up to age 29
1.332** (0.098) 1.330** (0.120)
Job Turnover3 Transitions made between ages 16-20 1-2 transitions 3+ transitions
1.089 (0.186) 0.807 (0.221) continues
(Table 5, continued) Job Turnover (continued) Transitions made between ages 21-25 1-2 transitions
1.128 (0.172) 0.904 (0.200)
3+ transitions
LF Instability Transitions made between ages 16-20 1-2 transitions3
1.356 (0.252) 1.143 (0.228)
3+ transitions3 Transitions made between ages 21-25 1-2 transitions
0.932 (0.156) 0.691* (0.117)
3+ transitions
Percent time spent in NE between ages 16-20
0.995 (0.004) 0.976** (0.002)
between ages 21-25
Log-likelihood Pseudo R2 N 1
-1065.65 0.01 1780
-776.82 0.28 1780
-859.43 0.20 1780
Also included in the equation (models 2-3) are flags for missing on the variables: number of months, AFQT, mother’s education, mother worked, family income. 2 Also included are the square terms for FT_29 and PT_29 to control for curvilinear effect of experience. 3 Zero transitions is the comparison group. * p