a statistical analysis of a server's operational behavior in order to minimize the energy consumption in data centers at cloud computing providers. Based on ...
CloudESE: Energy Efficiency Model for Cloud Computing Environments Imad Sarji
Cesar Ghali
Ali Chehab
Ayman Kayssi
Electrical and Computer Engineering Department American University of Beirut Beirut 1107 2020, Lebanon {ies02, csg04, chehab, ayman}@aub.edu.lb Abstract— In this paper, we propose two energy models based on a statistical analysis of a server’s operational behavior in order to minimize the energy consumption in data centers at cloud computing providers. Based on these models, the Energy Savings Engine (ESE) in the cloud provider decides either to migrate the virtual machines (VMs) from a lightly-loaded server and then turn it off or put it in a sleep mode, or to keep the current server running and ready to receive any new load requests. The main difference between the two models is the energy and time required to put the server in operational mode from a sleep mode or from an off state. Therefore, the decision is a tradeoff between the energy savings and the required performance according to the SLA between the client and the cloud provider. We show results based on actual power measurements taken at the server’s AC input, to determine the energy consumed in the idle state, the sleep state, the off state and in the case of switching between any two of these states. In addition, we measured the power consumed by the source and the destination servers during the migration of a VM. Keywords-cloud computing, virtualization, migration, energy saving, energy efficiency
I.
INTRODUCTION
Due to the massive growth of high performance computational services and applications, huge investments have been made in the last decade to build large scale data centers with thousands of servers and computing nodes. However, large scale data centers consume enormous amount of electrical power. According to [1], the energy consumed by data centers and IT infrastructure in the USA was estimated to cost around 4.5 billion dollars in 2006 and that this figure will double by 2011. As shown in [2], a data center’s monthly budget is divided into two main components: servers’ operational costs (53%) and power consumption (42%) including both the direct and the cooling cost. In addition to the overwhelming operational cost, the overheating caused by high power consumption will affect the reliability of machines and hence reduce their lifetime, in addition to the very high resulting CO2 footprint. Cloud computing, as defined in [3], is a distributed type of computing resource consisting of physical machines with each hosting several virtual machines (VMs). These VMs can be provisioned and released dynamically, and are also presented to customers as processing and storage resources based on service level agreements (SLAs). Cloud Computing has already
been proved to be one of the most important processing and storage resources for most applications and enterprises. In this paper, we propose two energy models based on a statistical analysis of a server’s operational behavior in order to minimize the energy consumption in data centers at cloud computing providers. Based on these models, the energy savings engine (ESE) in the cloud provider decides either to migrate VMs and turn the server off or put it in a sleep mode, or to keep the current server running and ready to receive any new load requests. The main deference between the two models is the energy and time required to put the server in operational mode from a sleep mode or an off state. Therefore, selecting which model to deploy is a tradeoff between the energy savings and the expected performance according to the SLA between the client and the cloud provider. We also performed power measurements on the server’s AC input, to determine the energy consumed in the idle state, the sleep state, (S3) the off state (G3) [12], and for switching between any two of these states. Note that the idle state referred to later in the paper corresponds to a running server with no load. In addition, we measured the power consumed by the source and the destination servers during the migration of a VM. The rest of the paper is organized as follows: Section II presents a literature review of the related work. In Section III, we explain the two energy models based on which decision is to be made. Section IV shows the results of energy measurement experiments and the server power profiles in different scenarios. In Section V, we present several cases that cover different scenarios where the ESE has to make a decision in order to reduce the energy consumption. Conclusions are provided in Section VI. II.
RELATED WORK
Wide efforts in the literature focused on power management for servers and data centers in order to minimize the energy consumption and hence to reduce the energy bill. These efforts have been carried out at two levels: the server level whereby the target is to minimize the power consumption by a single server, and the data center level whereby the target is to optimize the power consumption within a pool of servers. Concerning the first approach, researchers have developed several energy savings models at different operational layers. These layers can be summarized as follows: -‐
The Compiler Layer: different optimization techniques
978-1-4673-0465-8/11/$26.00 ©2011 ©2011 IEEE IEEE 978-1-4673-0465-8/11/$26.00
have been made in this layer to reduce the energy consumption without affecting the performance of the processor [4]. -‐
-‐
The Operating System (OS) Layer: The OS can play an important role in the energy optimization process by setting the idle devices in sleep mode [5]. John et al showed in [6] that Windows 7 is more power efficient than Windows Vista because of the advanced power-state techniques implemented in Windows 7. Dynamic Voltage and Frequency scaling (DVFS) is also a technique that can be managed by the OS to vary the frequency of the processor to conserve energy [7]. Horvath et al. used the (DVFS) technique to vary the server voltage in order to reduce the energy consumption without violating the required performance constraints. The Application layer: one of the techniques that are used at the application layer to save energy is to execute the assigned tasks as fast as possible by using the all available resources and then setting the devices to an idle state [8].
On the other hand, the research efforts to minimize the power consumption in a server pool focused mostly on virtualization. This technology allows one to overcome power inefficiency by accommodating multiple VMs on a single physical host and by performing live migrations to optimize the utilization of the available resources. In [9], Liu et al. proposed a green cloud architecture based on a virtualized data center that minimizes total energy cost. Their approach was tested on gaming workloads rather than business services. In [10], Beloglazov et al. proposed an optimization technique for continuous VMs allocation based on three policies: -‐
Optimization over multiple system resources: the VMs allocation is optimized in order to minimize the usage of the CPU, the memory and other server components.
-‐
Network optimization: the new placement decision for the migrated VMs takes into consideration the overhead of the transferred data and hence tries to minimize it.
-‐
Thermal optimization: reducing the workload of the overheated spot.
The main limitation in [10] is that the allocation decision is made based on the current utilization of the resources without considering the expected future load or the current load of the destination physical machines. In addition, Mazzucco et al. aimed to maximize the revenue of the cloud provider by reducing the energy cost using an intelligent algorithm to switch-off servers based on dynamic load estimation model of the system behavior [11]. III.
ENERGY SAVINGS MODELS
As mentioned earlier, migration of VMs is one of the methods adopted by cloud computing providers as a tool to reduce the consumed energy in the cloud data center. In this paper, we propose two energy savings models, the “server shutdown” and the “server sleep” models. What differentiates the two models is mainly the energy consumed while the server is in a shutdown state or a in a sleep state. Although the energy level would be decreased to the minimum possible level when the server is down, however, it will require more time and
energy to turn it back on and make it operational. Therefore, selecting which model to adopt is a tradeoff between the energy savings and the performance dictated by the SLA between the client and the cloud provider. The two proposed models are based on a statistical analysis of a server’s operational behavior. The parameters that are collected through an initial learning phase of the system are: -‐
𝐿, the server average load during the measurement period.
-‐
𝜎, the standard deviation of the server average load.
-‐
𝑁 , the number of samples collected throughout the measurement period.
The cloud provider collects weekly statistical data as follows: the three parameters listed above are gathered every hour of the day on a weekly basis throughout the whole year and stored in a database. Later on, for each hour, the server load 𝐿 is averaged and its standard deviation 𝜎 is calculated based on 𝑁 collected server load samples 𝑙!! . For instance, if 100 load samples were collected between 10:00 AM and 11:00 AM during all days of the second week of the year, these samples will be used to calculate the values of 𝐿, 𝜎 and 𝑁. In order to save storage capacity, we update the average, standard deviation, and number of samples at runtime using Equations 1, 2 and 3. 𝐿′ = 𝜎! =
𝐿×𝑁 + 𝑙!!! 1 𝑁+1
1 × 𝜎×𝑁 + 𝑙!!! − 𝐿! ! 2 𝑁+1 𝑁 ! = 𝑁 + 1 3
Where: -‐
𝐿 , the server load average calculated based on 𝑁 samples.
-‐
𝐿′, the server load average taking into consideration the new sample 𝑙!!! .
-‐
𝑙!!! , the new sample that should be integrated into the load average and standard deviation.
-‐
𝜎 is the standard deviation calculated based on 𝑁 samples and the load average 𝐿.
-‐
𝜎′, the standard deviation taking into consideration the new sample 𝑙!!! and the load average 𝐿.
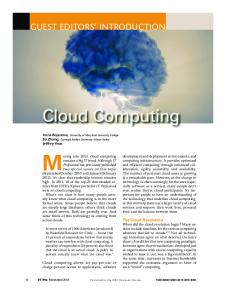
Due to the running average of the collected server load samples, a certain probability of error 𝑃! is introduced. 𝑃! accounts for the case where an unexpected extra load is requested by one of the cloud computing clients. For instance, if the cloud server should be operating with 𝐿% load for a period of time equal to 𝑇 seconds, and after 𝜏 seconds an unpredicted extra load equal to 𝐿! % is requested, with probability of error equal to 𝑃! , the server operates with load 𝐿 + 𝐿! % for 𝑇 − 𝜏 seconds and hence consumes more energy. Figure 1 illustrates the scenario of receiving an unexpected extra load request.
Load [%] 100
Extra Load 0
Time [sec] T
Figure 1. Receiving an unexpected extea load request scenario
The probability of error 𝑃! for each hour during every week day can be calculated as a function of the standard deviation 𝜎 using Equation 4. 𝜎 𝑃! = 𝑓 𝜎 = 4 𝑀 Where 𝑀 is the maximum deviation of one load sample from the average 𝐿 and it is calculated using Equation 5. 𝑁 𝑀 = Max 𝑙! − 𝐿 5 𝑖=1 Note that it is not necessary to store all the collected load samples in order to calculate 𝑀. Actually, it can be calculated at runtime while the statistics are being collected. Moreover, the time (𝜏) after which an unexpected extra load might occur is also obtained from the statistics and stored in the database along with the received extra load 𝐿! . Note that the initial value of 𝜏 can either be set to 0 as the worst case scenario or to 𝑇as the best case scenario. Therefore, each hour of the server operation is expressed using the vector: < 𝐿, 𝜎, 𝑁, 𝑀, 𝑃! , 𝜏, 𝐿! > A. The Server Shutdown Energy Savings Model In this model, the cloud provider energy savings engine (ESE) decides whether or not to migrate one or more VMs from a particular server and to shut it down by comparing the two quantities on both sides of equation 6. The left hand side of the equation accounts the energy consumed when migrating VMs to another server and turning off the server for time equal to 𝑇 seconds whereas the right hand side of the equation models the energy consumption by keeping the server turned on. 𝐸! ×𝐶 + 𝑬𝒐𝒏→𝒐𝒇𝒇 + 𝑬𝒐𝒇𝒇→𝒐𝒏 + 𝑷𝑰𝑶𝒇𝒇 ×𝑇 + 𝑃! × 𝑇 − 𝜏 ×𝑃!" 𝐿 + 𝐿!
? = 𝑇×𝑃!" 𝐿
+ 𝑃! × 𝑇 − 𝜏 ×𝑃!" 𝐿! 6 -‐
𝐸! = 𝐸! !" + 𝐸! !"# , the energy consumed while migrating 1 𝑀𝐵 of data, in inbound and outbound directions, to another server.
-‐
𝐶, the size of the migrated VMs in 𝑀𝐵.
-‐
𝐸!"→!"" , the energy required to change the state of the server from off to idle, i.e. turned on with no load.
-‐
𝐸!""→!" , the energy required to change the state of the server from idle to off.
-‐
𝑃!"## , the power consumed by the server while in the idle state.
-‐
𝑇, the expected period, in seconds, for the server to be in the idle state.
-‐
𝑃!" 𝐿 , the power consumed by the server when operating with load equal to 𝐿%.
-‐
𝑃!" 𝐿! , the power consumed by the server when operating with the unexpected extra load 𝐿! .
-‐
𝑃! is the probability of receiving an unexpected extra load 𝐿! after 𝜏 seconds.
-‐
𝐿! is the unexpected extra load that might be received after 𝜏 seconds.
-‐
𝜏 is the time in seconds after which an unexpected extra load 𝐿! might be received.
In cases where 𝐿 ≫ 𝐿! , the server shutdown energy savings model can be simplified as follows: 𝐸! ×𝐶 + 𝑬𝒐𝒏→𝒐𝒇𝒇 + 𝑬𝒐𝒇𝒇→𝒐𝒏 + 𝑷𝑰𝑶𝒇𝒇 ×𝑇
? + 𝑃! × 𝑇 − 𝜏 ×𝑃!" 𝐿 = 𝑇 ×𝑃!" 𝐿 7
B. The Server Sleep Energy Savings Model In this model, the provider decides to put the server in sleep mode instead of turning it off when it is not loaded. This can be modeled using the following equation: 𝐸! ×𝐶 + 𝑬𝒐𝒏→𝒔 + 𝑬𝒔→𝒐𝒏 + 𝑷𝑰𝑺 ×𝑇
? + 𝑃! × 𝑇 − 𝜏 ×𝑃!" 𝐿 + 𝐿! = 𝑇×𝑃!" 𝐿
-‐
+ 𝑃! × 𝑇 − 𝜏 ×𝑃!" 𝐿! 8 𝐸!"→! , the energy required to change the state of the server from sleep mode to idle, i.e. turned on with no load.
-‐
𝐸!→!" , the energy required to change the state of the server from idle to the sleep mode.
-‐
𝑃!" , the power consumed by the server while in the sleep mode.
Similarly, when 𝐿 ≫ 𝐿! , the server sleep energy saving model can be simplified as follows: 𝐸! ×𝐶 + 𝑬𝒐𝒏→𝒔 + 𝑬𝒔→𝒐𝒏 + 𝑷𝑰𝑺 ×𝑇
? + 𝑃! × 𝑇 − 𝜏 ×𝑃!" 𝐿 + 𝐿! = 𝑇
×𝑃!" 𝐿 9 The decision process is performed as follows: The ESE of the cloud computing provider estimates the consumed energy for the following three scenarios:
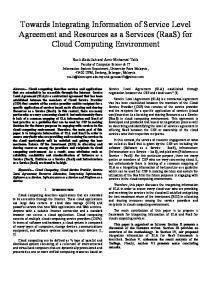
Figure 2. Turn on, idle, turn off every consumption profile
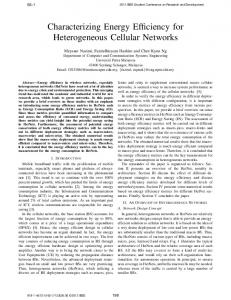
Figure 3. Inbound VM migration enegry consumption profile
1.
Scenario 1: Migrating one or more VMs to another server and turning the source server off.
HDDs installed to match the RAID 5 arrangement, and a 100 Mbps network interface card.
2.
Scenario 2: Migrating one or more VMs to another server and putting the source server in the sleep mode.
3.
Scenario 3: Keep the server running and ready to be loaded with new unexpected load.
Figure 2 shows the energy profile when turning on the server, running under 0% load and then turning it off again. From the curve, we can calculate the consumed energy by integrating the power utilization over a certain amount of time. Therefore, the consumed energy to turn on the server after being turned off is 𝐸!""→!" = 43,020 𝐽, the energy consumed to turn off the server after being turned on is 𝐸!"→!"" = 5,560 𝐽, and the power utilization when the server is in the off state is 𝑃!"## = 0.04 𝑘𝑊.
After evaluating the energy consumed in the three scenarios, the ESE will adopt the scenario that utilizes the least amount of energy. IV.
EMPIRICAL MEASUREMENTS
Whenever a cloud provider decides to employ one or both of the methods proposed in Section III, the parameters in Equations 6 and 8 must be evaluated. After evaluating both sides of the equations, the ESE of the cloud provider decides whether to migrate and put the server either in off or sleep mode or to keep it running and ready to take on any new requested load. This decision can be made by comparing the numerical values of both sides of the equations and then making the decision that ensures the minimum energy consumption. In order to evaluate the parameters in Equations 6 and 8, we took measurements for the energy consumed in several scenarios on a Fujitsu Siemens TX300 S2 server running Windows Server 2003 R2 Enterprise Edition and equipped with two Intel Xeon 3.8 GHz processes, 2GB of RAM, three
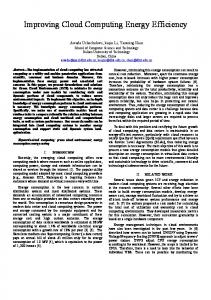
Figures 3 and 4 show the inbound and outbound energy consumed when migrating 2.17 𝐺𝐵 of virtual machine from the TX300 S2 to another server. Similarly we calculated the energy consumed to migrate 1 𝑀𝐵 of virtual machine in the inbound and the outbound directions to be equal to 𝐸! !" = 1.7892 𝐽/𝑀𝐵 and 𝐸! !"# = 1.7596 𝐽/𝑀𝐵. Figure 5 illustrates the scenario where the server is switched from the idle to the sleep state consuming 𝐸!"→! = 5,510 𝐽 and then turned back on utilizing 𝐸!→!" = 4260 𝐽. While in the sleep state, the server consumed 𝑃!" = 0.107 𝑘𝑊. Moreover, Figure 6 shows the consumed power, 𝑃!" 𝐿 , when the server is working under different load percentages. It is obvious from the curve that when the server is in the idle
Figure 4. Outbound VM migration enegry consumption profile
Figure 5. Idle, sleep mode, idle enegry consumption profile
state, with 0% load, it is consuming 57.14% of the power utilization when compared to a 100% load. Power Consumption vs CPU Load
0.4 0.35
Power Consumption [kW]
0.3 0.25 0.2 0.15 0.1 0.05 0
0
10
20
30
40
50
60
70
80
90
100
CPU Load [%]
Figure 6. Power Consumption vs. CPU load percentage
V.
CASE STUDIES
In this section, we provide several cases in which the ESE of the cloud provider has to make a decision in order to reduce the energy consumption in the cloud computing datacenter. A. Case 1 Assume that the collected statistics between 4:00 PM and
5:00 PM during the 27th week of the year are as given in Table 1. Based on the parameters given in the table, the cloud computing provider estimates the energy consumed in the three scenarios listed in Section III as follows: scenario 1: 308,872.48 𝐽 , scenario 2: 511,262.48 𝐽 , and scenario 3: 1,160,351.80 𝐽. Therefore, migrating one or more VMs to another server and turning the source server off is the solution that leads to most energy savings. B. Case 2 Assume that the collected statistics between 1:00 AM and 1:08 AM during the 11th week of the year are as given in Table 1. Note that only the parameters that have changed from the previous case are listed in the table. Therefore the cloud provider estimates the energy consumptions as follows: scenario 1: 118,143 𝐽, scenario 2: 111,493 𝐽, and scenario 3: 165,867.19 𝐽. Thus migrating one or more VMs to another server and putting the server in sleep mode is the best solution for saving energy in this case. C. Case 3 Assume that the collected statistics between 7:00 PM and 7:05 PM during the 43rd week of the year are as given in Table 1. The cloud provider estimates the energy consumptions as follows: scenario 1: 96,957.12 𝐽, scenario 2: 91,322.12 𝐽, and scenario 3: 88,511.64 𝐽. Thus keeping the server running and waiting for any unexpected load is the most energy efficient solution in this case.
TABLE I.
CASE STUDIES PARAMETERS
Case 1
Case 3
Case 2
Param
Value
Param
Value
Param
Value
Param
Value
Param
Value
Param
Value
𝑬𝒎
3.5488 𝐽
𝑪
2228.08 𝑀𝐵
𝑪
569.46 𝑀𝐵
𝑻
480 𝑠𝑒𝑐
𝑪
5368.45 𝑀𝐵
𝑬𝒐𝒇𝒇→𝒐𝒏
53059 𝐽
𝑬𝒐𝒇𝒇→𝒐𝒏
43020 𝐽
𝑬𝒔→𝒐𝒏
4260 𝐽
𝝉
86.4 𝑠𝑒𝑐
𝑳
35.47%
𝑬𝒔→𝒐𝒏
9206 𝐽
𝑷𝑰𝑺
167.56 𝑊
!
𝑬𝒐𝒏→𝒐𝒇𝒇
5560 𝐽
𝑬𝒐𝒏→𝒔
5510 𝐽
𝑳
4.2%
𝝈
4.33
𝑻
300 𝑠𝑒𝑐
𝝉
256 𝑠𝑒𝑐
𝑷𝑰𝑶𝒇𝒇
40 𝑊
𝑷𝑰𝑺
107 𝑊
𝑴
9.52
𝑷𝒆
0.45
𝑳
43.52%
𝑳!
26.8%
218.74 𝑊
𝝈
12.39
𝑴
23.52 314.36 𝑊
3600 𝑠𝑒𝑐
𝝉
2953 𝑠𝑒𝑐
𝑷𝒐𝒏 𝑳
𝑷𝒐𝒏 𝑳!
220.34 𝑊
𝑷𝒐𝒏 𝑳 + 𝑳!
308.47 𝑊
𝑷𝒐𝒏 𝑳 + 𝑳!
270.04 𝑊
𝑷𝒐𝒏 𝑳!
251.42 𝑊
𝑷𝒐𝒏 𝑳 + 𝑳!
𝑳
60.95%
𝑳!
5.3%
𝑷𝒆
0.52
𝑷𝒐𝒏 𝑳
275.61 𝑊
𝝈
3.83
𝑴
7.05
𝑷𝒆
0.54
𝑷𝒐𝒏 𝑳
300.81 𝑊
𝑻
263.97 𝑊
!
D. Analysis Based on the previous case studies, we can notice that 𝑇 has a major impact on the decision of the ESE in a cloud provider. In Case 1, 𝑇 was relatively large, compared to the other cases, and the decision of the ESE was to migrate VMs and shutdown the server. This is because keeping the server on for a long time will consume more energy than turning it off and on again. When 𝑇 decreases, as in Case 2, the probability of putting the server in sleep mode increases while the probability of turning it off decreases. This is due to the fact that switching the server from on to sleep and then back on consumes less energy than turning it off or keeping it running. However, the decision for shutting down, putting in sleep mode or keeping the server running, does not only depend on 𝑇. Several other parameters also have an effect on the decision of the ESE, such as the energy required to turn on the server after being shutdown or put in sleep mode, the energy consumed to turn the server off or put it in the sleep mode, the energy needed when the server is running in idle or sleep mode, etc. This is demonstrated in Case 3. Therefore, when making a decision, the ESE should take into consideration all the specifications of the physical server in order to select the most energy efficient solution. Moreover, based on the parameters collected in Section IV we can solve Equations 6 and 8 for the only variable 𝑇, and then, we can determine thresholds, based on which the decision of the ESE changes. VI.
CONCLUSION
In this paper, we proposed two models for saving energy consumption in cloud computing environments based on virtual machines migration. These two methods are the server shutdown and the server sleep energy models. The main differences between the two models are the time and energy required to switch the server from idle to shutdown or sleep mode. The energy savings engine ESE in the cloud provider takes into consideration all the physical server parameters when deciding to migrate one or more VMs and then turning off the server or putting it in sleep mode, or keeping the server
𝑷𝒐𝒏 𝑳
running and ready to receive any unexpected load request from the cloud customers. ACKNOWLEDGEMENTS This work was supported by the Intel-KACST Middle East Energy Efficiency Research (MER) Program. REFERENCES [1]
R. Brown et al., Report to Congress on Server and Data Center Energy efficiency: Public Law 109-431, Lawrence Berkeley National Laboratory, 2008. [2] J. Hamilton, “Cooperative Expendable Micro-Slice Servers (CEMS): Low Cost, Low Power Servers for Internet-Scale Services,” in Proc. 4th Biennial Conf. Innovative Data Systems Research (CIDR), Asilomar, CA, USA, January 2009. [3] R. Buyya, C. S. Yeo, S. Venugopa, “Market-Oriented Cloud Computing: Vision, Hype, and Reality for Delivering IT Services as Computing Utilities,” in Proc. 10th IEEE International Conference on High Performance Computing and Communications (HPCC-08), Los Alamitos, CA, 2008. [4] S. Daud, R. B. Ahmad and N. S. Murhty, “The Effects of Compiler Optimizations on Embedded System Power Consumption,” in Proc. International Conference on Electronic Design, pp. 1-6, 2008. [5] D. Tudor and M. Marcu, “Designing a Power Efficiency Framework for Battery Powered Systems”, in Proc. SYSTOR, 2009. [6] B. P. John, A. Agrawal, B. Steigerwald, and E. B. John, “Impact of Operating System Behavior on Battery Life,” J. Low Power Electronics, pp. 10-17, 2010. [7] T. Horvath, T. Abdelzaher, K. Skadron, X. Liu, “Dynamic Voltage Scaling in Multi-tier Web Servers with End-to-end Delay Control,” IEEE Transactions on Computers, vol. 56, pp. 444-458, 2007. [8] B. Steigerwald, R. Chabukswar, K. Krishnan, J. D. Vega, “Creating Energy–Efficient Software,” Intel White Paper, 2008. [9] L. Liu, H. Wang, X. Liu, X. Jin, W. He, Q. Wang, and Y. Chen, “GreenCloud: A New Architecture for Green Data Center,” in Proc. International Conference on Autonomic Computing and Communications, New York, NY, 2009. [10] A. Beloglazov and R. Buyya, “Energy Efficient Resource Management in Virtualized Cloud Data Centers,” in Proc. 10Th IEEE/ACM Int. Conf. on Cluster, Cloud and Grid Computing, 2010. [11] M. Mazzucco, D. Dyachuk, and R. Deters, “Maximizing Cloud Providers Revenues via Energy Aware Allocation Policies,” in Proc. 3rd IEEE International Conference on Cloud Computing (IEEE Cloud), July 2010. [12] Hewlett-Packard, Intel, Microsoft, Phoenix, Toshiba. Advanced configuration and power interface specification. Available from: http://www.acpi.info/spec.htm.