South African Journal of Industrial Engineering August 2016 Vol 27(2), pp 15-29
ASSESSING THE IMPACT OF NEW TECHNOLOGY ON COMPLEX SOCIOTECHNICAL SYSTEMS R. Oosthuizen1#* & L. Pretorius1
ARTICLE INFO
ABSTRACT
Article details Submitted by authors 4 Nov 2015 Accepted for publication 29 Feb 2016 Available online 12 Aug 2016
In complex sociotechnical systems, cognitive and social humans use technology to make sense of situations when making decisions. These elements make sociotechnical systems difficult to develop. A modelling and assessment methodology for systems engineering is required to understand the sociotechnical system’s behaviour and underlying structure. Modelling captures the dynamic interaction, as well as the effect of humans in a complex environment. Cognitive Work Analysis and System Dynamics are two complementary approaches applied in mutual support within this context. The objective of this paper is to demonstrate a modelling methodology for complex sociotechnical systems, in order to support the systems engineering process.
Contact details *
[email protected]
Author affiliations 1 Department of Engineering and Technology Management University of Pretoria, South Africa #
The author was enrolled for a DEng (Engineering Management) degree in the Graduate School of Technology Management, University of Pretoria
DOI http://dx.doi.org/10.7166/27-2-1144
1
OPSOMMING In komplekse sosio-tegniese stelsels, gebruik kognitiewe en sosiale mense tegnologie om situasies te verstaan en besluite te neem. Hierdie elemente maak sosio-tegniese stelsels moeilik om te ontwikkel. ’n Modellering en assessering metodologie vir stelselingenieurswese is nodig om die gedrag van die sosio-tegniese stelsel en onderliggende struktuur te verstaan. Modellering implementeer die dinamiese interaksie sowel as die effek van die mens in ’n komplekse omgewing. Kognitiewe werkanalise en Stelseldinamika is twee aanvullende benaderings wat binne hierdie konteks toegepas is in wedersydse ondersteuning. Hierdie artikel demonstreer ’n modellering metodologie vir komplekse sosiotegniese stelsels om die stelselsingenieurswese proses te ondersteun.
INTRODUCTION
The development of complex sociotechnical systems (STS) often consists of integrating new technology into existing systems through the application of systems engineering (SE) processes. Standard SE processes can struggle with complex STS, which exhibit dynamic behaviour as many unintended or unpredicted consequences may be experienced. The new artefact often leads to new task possibilities that evolve user requirements [1]. To overcome these difficulties, SE can apply modelling to explore structural, functional, and operational elements of the problem and solution space [2]. STS theory, as developed by Trist [3], provides a framework for modelling and analysing complex systems. STS consists of humans applying technology to perform work through a process within a social structure (organisation) to achieve a defined objective [4,5]. Work can become complex due to dynamic interaction between the people themselves, between people and technology, and between people and the environment. The central aim of this paper is to demonstrate a modelling methodology for complex STS in support of the SE process. First, some background will be provided on the development of the modelling methodology before the model is demonstrated. 15
The modelling methodology combines cognitive work analysis (CWA) and system dynamics (SD) [6]. CWA analyses the way people perform work within environmental constraints to capture the structure of the problem in constructs or models [7]. However, CWA does not address the dynamic behaviour of the system [8]. SD uses the structure of the system to analyse, through simulation, the effect of feedback and delays on the operation of the system as a result of decisions based on policies [9]. The design science research (DSR) framework structures the modelling methodology [10]. The methodology will be demonstrated in a case study through modelling and analysing the impact of a new web-based collaboration technology on the situation awareness of patrollers and coordinators in a neighbourhood watch system that is part of a community policing forum (CPF). 2
RESEARCH METHODOLOGY
The DSR approach was followed to develop the modelling methodology [6]. As seen in Figure 1, DSR is a framework for information system development through the creation of artefacts for a human purpose. The two basic activities in DSR methodologies are designing a novel and useful technological artefact for a specific purpose, and evaluating its utility [10-13]. In the context of this research, artefacts are regarded as something new that does not already exist in nature, to improve human capabilities. DSR aims to gain knowledge and experience in application of the artefact to solve a problem [14]. Note that the DSR framework is also used in the modelling methodology that is demonstrated in this paper.
Evaluation to Determine Ability of the Artefact to Solve the Problem
Disciplinary Knowledge
Demonstrate Artefact Ability in Context to Solve Problem
Metrics, Analysis Knowledge
Design and Develop Artefact
How to Knowledge
Define Objectives and Contribution of the Solution Artefact
Theory
Identify and Define Problem
Interface
Process Iteration
Conclusion and Communication of Results
Figure 1: Design science research (DSR) This paper addresses the final stages of the DSR framework, which is to evaluate the ability of the modelling methodology (the research artefact) to model the impact of a new technology (demonstration artefact) in a complex STS. The outputs of the modelling and simulation are compared with the findings of an empirical case study in order to demonstrate the utility of the modelling methodology in supporting learning about a complex STS that supports an SE approach. Specific concepts, such as abstraction decomposition hierarchy (ADH), will be explained in appropriate detail in Sections 3 and 4 where they are needed. 3 3.1
MODELLING COMPLEX SOCIOTECHNICAL SYSTEMS (STS) Background
This section describes a modelling approach to support an understanding of the effect that a new technology will have on human work in the system. The two modelling frameworks to be included in the methodology are CWA and SD; however, they are fundamentally different, and require a framework to enable an integrated approach. For this reason, the principles of DSR are applied [6]. A sociotechnical system (STS) consists of complex interaction between social humans and technical systems [5]. This was identified in the 1950s, when new technology did not always improve the efficiency and productivity of organisations [3]. System behaviour improvements cannot be expected when only inserting a new technology into a complex STS. STS theory highlights the importance of the joint optimisation of social and technical subsystems in an organisation in order to solve complex issues [4,11]. People work in organisations by making use of technological artefacts (tools, devices, and techniques) to achieve economic performance and job satisfaction, as seen in Bostrom and Heinen’s model in Figure 2 [4]. 16
Complex Environment Sociotechnical System Structure
(Organisation)
People
(Cognitive & Social) Social System
Physical System
(Hardware, Software, Facilities)
Task
(Work) Technical System
Figure 2: Sociotechnical system (STS) [4] The social subsystem consists of the organisational structure, which encompasses authority structures, reward systems, knowledge, skills, attitudes, values, and needs. The human (socio) and technical interaction can lead to unexpected, uncontrolled, unpredictable, and complex relationships. Because the STS is an open system and is susceptible to external inputs, it will be affected by the complex operating environment [5]. The term ‘complex’ is defined in the Merriam-Webster dictionary as “a whole made up of complicated or interrelated parts” that are intricately intertwined with a high level of interconnectivity. Complex system elements have non-linear interactions (including feedback loops with delays) that sometimes cause non-deterministic, emergent, unpredictable, and unexpected behaviour. Complexity may exist in simple systems due to dynamic context-dependent interactions and feedback. Methods to analyse and design STS for successful operation in a complex environment need to address the social, cognitive, and dynamic complexity in the system [7, 16-18]. 3.2
Modelling in systems engineering (SE)
SE aims to solve problems by developing systems through the application of systems thinking, which considers the interaction of elements within the context of the whole [2]. Modern complex STS tend to be developed through piecewise replacement of subsystems with new technology. SE uses modelling throughout the system’s lifecycle to describe selected aspects of structure, behaviour, operation, and environment, in order to gain insight into the problem. Experimentation with this knowledge investigates the dynamic and non-linear interaction of and within the system [19,20]. A model abstracts reality, simplifies complexity, considers constraints, and synthesises results. Models support multiple views with a balance between realism and simplicity for theoretical or empirical understanding [2,21-25]. 3.3
Cognitive work analysis
The modelling methodology considered in this paper starts with an analysis of the role of new technology in the complex STS. The theoretical roots for CWA are in systems thinking, adaptive control systems, and ecological psychology. CWA has been applied in systems analysis, modelling, and evaluation of complex STS such as command and control, aviation, and health care. It supports the formative development of ‘how work can be done’ instead of normative models (how the system should behave) or descriptive models (how the system is actually behaving). The CWA determines how the new technology can support existing system functions [7,26-28]. The five phases of CWA, as seen in Figure 3, include work domain analysis (WDA), control tasks analysis, strategies analysis, worker competency analysis, and social organisation and cooperation analysis [7,26-29]. The WDA elicits and presents information on the system from existing 17
documentation and expert users to understand the functional structure of the enterprise and the environmental effects on work. It identifies the goals of the cognitive system in a top-down approach. This is integrated with a bottom-up view of available physical resources for the human operators to achieve the goals of the system [26,27]. The other phases will not be discussed in this paper, but will be the focus of future research as experience in application modelling is gained. Despite its advantages, CWA does not support the development of a complete understanding of the system’s dynamic behaviour. CWA also tends to be used to analyse existing systems instead of designing revolutionary and novel systems, motivating the need for additional tools [8]. Work Domain Analysis
Control Task Analysis Context Analysis Decision Ladder
Strategies Analysis
Socio Organisation Analysis
Worker Competency Analysis
Figure 3: Cognitive work analysis 3.4
System dynamics
SD uses systems thinking, qualitative modelling, and quantitative simulation to investigate the effect of feedback in social systems. System structure is the source of system behaviour, and consists of interlocking stocks, flows, and feedback loops. Causal loop diagrams and stock and flow diagrams present the process and information structure of the system. A causal loop diagram shows the causal influences between variables in order to identify the feedback structure of the dynamic system. Delays in feedback loops cause inertia in the system that may lead to dynamics and oscillations [9,30-32]. Stock and flow diagrams show the structure of system processes, delays, and stocks. Stocks indicate the state of the system as a result of the history of changing flows that cause delays, inertia, and memory. The causal connection between the stock and the flow, due to decision rules, is important for understanding the behaviour of the system. Observing system behaviour over a long time leads to dynamic behaviour patterns that support learning about the underlying structure [9,31]. 3.5
Complex STS modelling methodology
Effective modelling and assessment that addresses human work with the technical system in a complex environment will support the development of complex STS [2,5]. The modelling methodology presented in Figure 4 integrates the theory on WDA and SD, using the steps of the DSR framework [6]. Implementation of DSR for the overall research methodology should not be confused with similar steps of DSR implemented in the modelling methodology. WDA and SD are two fundamentally different methodologies that need integration through a framework to support modelling and learning. First, the problem to be solved (technology push or pull) is identified and defined. In the second step of the modelling methodology, the WDA is used to analyse and present information on the system that is available from documents and users (focus groups) in constructs [6]. The WDA employs an abstraction decomposition hierarchy to make the links between elements of the new technology and the higher-level system functions. The success of the functional purpose depends on the values and priority measures of the system as achieved through the purpose-related functions that are performed by people, using the physical objects with object-related functions [26]. 18
Identify and Define Problem
Context
Learning
Define Objectives and Contribution of the Solution Artefact
Demonstrate Artefact Ability to Solve Problem (Simulation) System Behaviour Simulation
Stocks and Flows
Exploratory Focus Group
Function or Purpose of System
Design and Develop Artefact
Work Domain Analysis
Gather Information & Review Existing Solutions, Work, Process, Human Contribution, Environment Constraints
Conclusion and Communication of Results
Causal Loop Diagrams
System Dynamics
Concept System Models
Analyse and Interpret Data
Confirmatory Focus Group
Update Concept System Models
Perform Experiment and Collect Data
Plan Experiment and Predict Results
Evaluation to Determine the Ability of the Artefact to Solve the Problem (Experimentation)
Figure 4: Modelling methodology The next step is to develop the conceptual system models that represent the structure and behaviour of the complex STS. Since SD does not necessarily focus on human processes, the inputs of the CWA are crucial in modelling the problem. The SD modelling process develops a causal loop diagram and stock and flow diagram, which are used to understand the effect of the new technology on complex STS behaviour. The purpose of SD is not to predict system behaviour, but to understand the effects of certain causes of possible system behaviour. The SD simulation outputs are reviewed with stakeholders for possible model improvements to facilitate learning. If required, the concept system models can be updated for another iteration of learning through simulations. The outputs of this combined modelling approach support the planning of experiments, and guide the analysis of recorded data [6]. In the next section, the methodology presented here is demonstrated on a coordination technology for community security. 4 4.1
COMPLEX SOCIOTECHNICAL MODELLING CASE STUDY Background
This section will demonstrate the ability of the modelling methodology presented in the previous section by using an empirical case study of the effect of a web-based technology on situation awareness for community security. A CPF consists of community and police representatives who address safety problems in the community. The focus of the CPF is crime prevention and community policing. Community policing is a policy and strategy for the proactive use of community resources to achieve more effective and efficient crime control and to change crime-causing conditions [33]. Residents’ associations and neighbourhood watches participate in the CPF to help enhance their own safety. Patrols act as the ‘eyes and ears’ of the police to report incidents, suspicious persons, or potential crime scenes, without getting involved. Suitable technology is required to capture and distribute information on incidents and suspicious behaviour reported by the patrollers [33,34]. This can be viewed as a complex STS because it consists of humans interacting with each other in small diverse teams using processes, structure, and technology. The goal of the web-based collaboration technology is to enhance situation awareness and decision support. It uses any communication network through commercial Android smart phones to capture and distribute information. The typical capabilities through installed software applications are 19
tracking of own forces, incident capture, chat and coordination, situation awareness picture, and information analysis. The next sub-sections demonstrate the methodology presented in Figure 4 that was used for this case study. 4.2
Identify the problem
Limited information and crime intelligence hinders effective CPFs and neighbourhood watches. The current radio-based voice and paper-based reporting system is not very effective, because only a few incidents are captured and they are not managed [33,34]. Even though some CPFs apply social media tools such as Facebook and WhatsApp, they have disparate capabilities and are not integrated. Patrollers tend to go about their routine business without considering the longer-term requirements for information. The aim of the proposed technology is to gather and distribute information for effective situation awareness and patrol coordination. Information and intelligence have to support the situation awareness of coordinators and patrollers. Although the expectation is that the new technology will improve the CPF as complex STS, it is not clear what the resulting behaviour of the system will be. 4.3
Define objectives and contribution of the solution artefact
An exploratory focus group led by the first author of this paper, together with the technology development team and CPF members, determined the current problems experienced and possible improvements to the system. The research outputs of the focus group were the functions and processes executed within the constraints of the current system. This information was captured in an abstraction decomposition hierarchy (ADH) [26], as seen in Figure 5. The yellow blocks indicate the elements and functions of the system with the current technology, while the blue blocks highlight the contribution of the new technology. The white blocks are elements that are identified but not supported by the current or new technology. The functional purpose of neighbourhood watch is to make the neighbourhood safe for its citizens by coordinating the patrollers (volunteer residents), initiating responses from the police to incidents, and generating crime intelligence. The success of these functions depends on the values and priority measures of the system, which enables the neighbourhood watch patrols to serve effectively as the eyes and ears of the police and the CPF. Since patrollers are citizen volunteers with limited training, their safety during patrols is essential. The situation awareness of the patrollers and coordinators, through the optimised use of the available information for collaboration and synchronisation, affects the effectiveness of the CPF. The purpose-related functions of the whole system are reporting observations (capturing information) and analysing them to support sense-making and situation awareness. These are done to identify incidents and to make decisions about immediate (tactical) action or later attention (operational or strategic). The exchange of information facilitates synchronisation, coordination, and collaboration between patrollers and coordinators. The current physical objects for the neighbourhood watch patrols consist mainly of radios for verbal communication, which can be supported by paper reports. The new technology makes many more object-related functions available in support of purpose-related functions. The lines between the blocks indicate a means-to-ends relationship, and are interpreted from the bottom up. The thick lines indicate the current capability, with the thin lines indicating the possible contributions of the technology to the system. The relationships indicate which higher level blocks are supported by which lower level elements. These relationships support development of the causal loop models and the stock and flow diagrams.
20
Improve safety in the Neighbourhood
Functional Purpose
Values & Priority Measures
PurposeRelated Functions
ObjectRelated Functions
Physical Objects
Tactical Coordination of NW Patrollers
Support CPF and Police through Intelligence
Initiate Police Response
Situation Awareness Perception
Comprehension
Projection
Coordinator
Eyes and Ears of Police
Collaboration
Coordination
Optimised Info Use
Patroller Control Response
Develop Situation Awareness Picture
Analyse Information
Display Information
Filter & Aggregate Information
Information Display Screen (Geographic Maps)
Paper Map
Safety of Patrollers
CPF Preventative Action Planning
Capture Data/ Information
Analyse Intelligence
Process Information
Capture Information
Structure & Store Information
Control Information
Integrate Sensors
Transport Information
Decision Support
Human Sensors (Workflow, Camera, GPS, Compass, Chat)
Database
Gateway
3G & Internet Network
Verbal & Paper Reports
Disseminate Information
New Collaboration Technology
Figure 5: Work domain analysis for the neighbourhood watch
Social Media
Radio
21
4.4
Design and develop the artefact
This step develops models of the system’s structure, operation, and behaviour. The ADH output helps users to understand the relationship between the functions in order to compile a conceptual functional flow diagram, as seen in Figure 6. The same colour coding is used as in Figure 5. The purpose-related functions provide the work functions performed by people.
Capture Information in Database
Sensing Data/Information
Coordinator (Control Room)
Disseminate Information
Attend to Incidents
Routine Patrol
Patroller
Reaction to Incident
Police
Identify Incident
Develop Situation Awareness Picture
Control Response
Analyse Information
Preventative Actions
Plan Actions
Analyse Intelligence
CPF Management
Apply Intelligence
Figure 6: Functional flow model Patrollers report information on incidents in the neighbourhood over the radio or cellular network. The coordinator intercepts these messages and records them in an incidents book. The incident information is used to respond immediately or to plan future actions. The new technology supports the automated capturing and integrating of more sensors into the information database. The ability to structure and filter the available information also enables information analysis for an improved situation awareness picture. Information can be disseminated to more participants in digital format in order to support collaboration and synchronisation during the planning of operations. Due to the web-based architecture, each person with network (cellular) connectivity has access to the situation awareness picture and can capture additional information. 4.5
Causal loop diagram
The dynamic hypothesis to guide the SD modelling and analysis in this research is that the new technology will improve the coordination of patrols through disseminating information in support of a shared situation awareness. The models developed in the previous section of this paper are now used to identify the important variables in the system and the causal loops between them. The causal loop diagram in Figure 7 was constructed from the models and constructs in the preceding sections of this paper. These constructs support identifying important variables in the system and the causal loops between them. The relationships between the lower levels of the ADH are used to identify possible causal links, while the higher levels of the ADH are used to understand the relationships. The functional models also indicate how the (feedback) loops connect. Care must be exercised in order not to make the model overly complex at this initial stage, as this will diminish its usefulness in supporting the stakeholders’ understanding. As the reader may notice, the naming convention of variables between the constructs and models may seem inconsistent. Each step of the modelling methodology aims to gain an understanding of the system and its implementation of technology to proceed to the next modelling phase. The ADH links functions and physical objects, the functional flow diagram links the functions into a process, and the CLD 22
Figure 7: Neighbourhood watch’s causal loop diagram identifies variables and their interaction. A slight difference in the naming of the elements does not reduce the accuracy of the models, but rather improves the understanding of the different stakeholders. Information on incidents and the location of the patrollers increases situation awareness in the system. This is achieved through proper information exchange interfaces. The main loops identified in the reference CLD are the Safety Loop (Reinforcing Loop R1), Patroller Awareness Loop (Reinforcing Loop R2), Complexity Loop (Reinforcing Loop R3), and Criminality Reduction Loop (Balancing Loop B4). The Collaboration Loop (Reinforcing Loop R5) is the focus of the analysis in this paper. The new technology distributes the situation awareness to all participants to improve the deployment of assets in response to an incident. This shared situation awareness of the crime situation enables coordination of patroller actions. 4.6
Stock and flow diagram
The causal loop diagram (Figure 7), WDA (Figure 5), and Functional Flow Model (Figure 6) support the development of a stock and flow diagram, as seen in Figure 8. This model is eventually used to simulate the impact of the new technology on the dynamic behaviour of the whole system. The stock that flows through the model in this case study is ‘information’. Information is gathered, distributed, processed, and displayed to support planning and decision-making. Variables are added to represent the external environment. The variable of ‘situation awareness’ is not included in this diagram, as it is assumed to relate closely to the amount of information available. Criminal action leads to information on crime incidents, most of which are reported to the police. These are reported to the CPF after a time delay. The other source of information is suspicious activity reported by patrols. The value of information for effective action decays over time. The available CPF information leads to coordinator and patroller awareness in support of initiating a reaction from the police or planning pre-emptive operations. These are aimed at preventing criminal activity. The new technology variable included in the model is the effect of collaboration. Collaboration enhances the availability and use of information to support the awareness of the patrol coordinators and CPF management.
23
Figure 8: Neighbourhood watch’s stock and flow diagram 4.7
Demonstrate the artefact
SD simulations with the stock and flow diagram from Figure 8 are used to analyse the effect of the new technology on system behaviour. Despite the many aspects available in the neighbourhood watch system to investigate, these SD simulations centred on the impact of the collaboration technology on the success of the overall system. Collaboration is implemented as a dimensionless constant that indicates the presence or absence of collaboration. The collaboration capability enables more information to be reported in support of the patrollers’ situation awareness, as well as for information to be distributed for better coordination during patrols. The simulations are used to determine whether the causal loop and stock and flow models replicate observed real-world behaviour, and to identify leverage points. The simulation results for the first two days are shown as the output stabilises thereafter. Information in support of crime prevention operations consists mainly of reported suspicious behaviour and actual incidents that are reported to the police, as seen in Figure 9. The reporting of suspicious activities is dependent on the effectiveness of the patrols, and is influenced by the level of safety experienced. The actual crime-related incidents that occur take longer to report due to the police’s bureaucratic processes. Collaboration increases the ability of various participants to contribute to the gathering and instantaneous reporting of information. The oscillations during the initial stages are due to the delays in the feedback loops of the model. However, with increased system effectiveness, the number of incidents will decrease, causing less information to be available. This presents counterintuitive behaviour in the system due to the new technology. The ability of coordinators to address criminal behaviour is affected by the amount of information available for situation awareness, planning, and decision-making. Collaboration assists the different resources to effectively reach the scene and take action on the incident through shared situation awareness. The effect of collaboration on situation awareness in order to address different incidents is shown in Figure 10. More incidents can be addressed given available or even limited information. This means that collaboration enhances the ability to use the available information fully. The Sshaped growth with overshoot mode oscillations during the initial stages is due to the delays in the feedback loops of the model [9,31].
24
Figure 9: Available information 4.8
Figure 10: Coordinator awareness
Evaluate the artefact
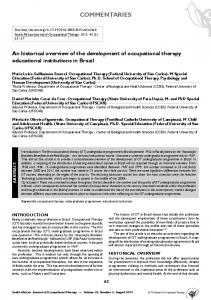
Background The final evaluation of the modelling methodology is an empirical case study. This was done as an initial exploratory evaluation of the artefact and SD models [30,31].The aim of the case study is to evaluate the ability of the modelling methodology to support an understanding of the effect of a new technology on a complex STS. This was achieved by implementing a new technology in an existing CPF (located in Pretoria, South Africa) to determine whether the developed models provided insight into the observed behaviour. The main unit of analysis is the situation awareness developed from information captured during patrols and from other sources. Empirical data on situation awareness were captured from neighbourhood watch patrollers and coordinators through structured interviews with questionnaires before and after introducing the new technology. The models, constructs, and simulations developed through the modelling process identified the characteristics to be addressed in the interviews. The situation awareness rating technique (SART) was used in this case study to measure the difference in situation awareness with and without the new technology. Taylor [38] developed and demonstrated the SART for situation awareness measurements of pilots. The SART measures general situation awareness constructs on a 7-point Likert scale, and relies on the system operators’ understanding of the situation when making decisions. This understanding is often conscious, explicit, and quantifiable. This situation awareness measurement is useful for both field and laboratory settings [37,38]. The questionnaire addresses the demand on attentional resources (instability, complexity, and variability of the situation), supply of attentional resources (arousal, concentration, division of attention, and spare mental capacity) and understanding of the situation provided (familiarity and information quantity and quality). The overall situation awareness rating or score is calculated by the following equation [38]: Situation awareness = Understanding – (Demand – Supply) The SART questionnaires were completed by 14 coordinators and 20 patrollers who participated in the case study before and after using the technology. The technology was used for a shift of two hours before completing the second questionnaire. The SART results, which were captured before and after introducing the new technology, were analysed in terms of the three main variables (demand, supply, and understanding), as well as the resulting calculated situation awareness. A Chi squared test (χ²) was used to test the sample distribution for the case when the null hypothesis is true, and to test the association between two variables. Box and whisker plots were used to present and interpret the recorded data because they enable the researcher to reason about information in complex tables. These plots provide an exploratory analysis of patterns regarding the shape, variability, and median of a statistical dataset through a graphical summary. The metrics include the median, quartiles, and the lowest and highest data points to present the symmetry, spread, and level of a distribution of data values [39]. 25
Patrollers The distributions of the data on the different SART variable categories for the patrollers are presented in the box and whisker plots in Figure 11. The variables for demand and supply are constant, while understanding showed a slight increase. The technology provides the patrollers access to the available information through a web browser on a smart phone. The quality of contextual information about the incidents is increased through the smart phone capability, compared with that of radio messages. The calculated situation awareness indicates a marginal increase due to the information on incidents, and tracks the CPF that is available in the smart phone. 7
40
6
35
5
30
4
25
3
20
2
15
1
10 5
0 Before
After
Demand
Before
After
Supply
Before
Before
After
Understand
After
Patroller Situation Awareness
SART Variables Figure 11: SART results for patrollers
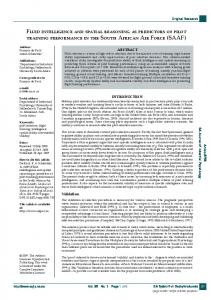
The SART evaluation of the technology use by patrollers does not provide a conclusive motivation for widespread implementation of the new technology. From the empirical data analysis, it can be deduced that, to have improved situation awareness, the patrollers do not require a smart phone with a situation picture in the vehicle while driving. They are active for only two hours, and need eyes on the road to detect suspicious behaviour or other incidents. The smart phones do, however, enable them to capture and distribute information for the coordinators to apply. Coordinators The distributions of the data on the different SART variable categories for the coordinators are presented in the box and whisker plots in Figure 12. The variable of ‘demand’ remained constant because the technology does not affect the complexity of the environment. The ‘supply’ category for coordinators also did not improve. Despite having access to information, it did not affect the coordinators’ level of alertness, concentration, attention, or demands on mental capacity. The graphical display of incidents and contextual information also reduced the load on their concentration when interpreting incidents. 7
45
6
40
5
35
4
30
3
25
2
20
1
15 10
0 Before
After
Before
After
Before
After
5 Before
Demand
Supply
Understand
SART Variables Figure 12: SART results for coordinators 26
After
Coordinator Situation Awareness
However, the ‘understand’ category considers the available information in support of coordinator situation awareness. In contrast with the first two sets of variables, it shows a clear increase. The technology gives the coordinators access to the available information, both past and present, through the web-based portal. The calculated situation awareness indicates a clear increase due to the information that is available to the coordinators. The SART evaluation of the coordinators does support a widespread implementation of the new technology. Even in the same scenario, the operators and patrollers have different roles. The slightly different requirement for information and situation awareness on the part of the coordinators makes the new technology much more useful for them. 4.9
Discussion of results
The purpose of modelling the technology in a complex STS is to gain an understanding of its impact on the system’s behaviour. The process of modelling, simulation, and field experimentation enabled learning about the problem space and the impact of the solution. This supports identifying key aspects to capture in the requirements for implementing and operating the system. The models of the system and technology implementation are not perfect representations of the system and its influence on the environment, but can still be used to learn about the influence of the variables on system behaviour. Effective collaboration between the patrollers, shift coordinators, and the control room will increase the amount of information captured. With the new technology, more information on incidents can be recorded for input into the CPF system. The increase in information will improve situation awareness and the resulting decisions of coordinators. According to the SD simulation results, the increase of information should result in a decrease of criminal incidents. The steady state of the coordinator situation awareness in Figure 9 is higher than without the technology, which relates to the empirical evidence in Figure 11. The steady state is achieved only after three days, as the users of the system first have to learn how to use the technology. This is complicated by delays in the system that result in oscillations of situation awareness during the initial stages of the implementation. This may cause the coordinators to lose faith in the technology, and thus hamper its acceptance in the STS. As CPF operations become more effective, there could also be less information available from actual incidents for planning further operations. This effect in the system is somewhat counterintuitive, and highlights the need to consider using less available information more effectively. 5
CONCLUSION
Effective modelling and analysis can support the development of a complex STS. This is important where humans use technology for decision support and communication, in order to make sense of a situation in support of coordinating actions. Modelling supports experimentation to improve the understanding of system requirements. Modelling also needs to capture the human contribution to the system’s success, as well as the dynamic interaction due to environmental constraints and system operation. Focusing only on the specific technology to be implemented may exclude important aspects that are required for successful project completion. This paper presents the culmination of research to develop a modelling methodology in support of complex STS development, which consists of the CWA and SD approaches. The DSR framework was used to develop this abstract artefact (modelling methodology). As part of the evaluation phase of DSR, the impact of a web-based collaboration technology on CPF was modelled and simulated. The simulation results were compared with data captured during an empirical field case study with the technology in an actual CPF. The modelled behaviour and simulation results compare well with the observed complex STS behaviour in terms of the situation awareness of system users. The field experiment demonstrated a clear gain in situation awareness for coordinators, but not for the patrollers. This can be explained by considering the patrollers' roles and priorities, and their way of carrying out their work. The successful conclusion of the case study as part of the DSR framework reinforces the utility of the methodology, which could also be used in other diverse applications of technology in complex STS. 27
REFERENCES [1] [2] [3] [4] [5] [6] [7] [8] [9] [10] [11] [12] [13] [14] [15] [16] [17] [18] [19] [20] [21] [22] [23] [24] [25] [26] [27] [28] [29] [30] [31] [32] [33]
28
Carroll, J.M. & Rosson, M.B. 1992. Getting around the task-artifact cycle: How to make claims and design by scenario. ACM Transactions on Information Systems, 10(2), pp. 181-212. Hitchins, D.K. 2008. Systems engineering: a 21st century systems methodology. John Wiley & Sons. Trist, E.L. 1981. The evolution of socio-technical systems: A conceptual framework and an action research program. Ontario Quality of Working Life Center, Occasional Paper No. 2. Bostrom, R.P. & Heinen, J.S. 1977. MIS problems and failures: A socio-technical perspective. Part I: The causes. MIS Quarterly, 1(3), pp. 17. Walker, G.H., Stanton, N.A., Salmon, P.M. & Jenkins, D.P. 2008. A review of sociotechnical systems theory: A classic concept for new command and control paradigms. Theoretical Issues in Ergonomics Science, 9(6), pp. 479. Oosthuizen, R. & Pretorius, L. 2014. Modelling methodology for engineering of complex sociotechnical systems. In INCOSE International Symposium, vol. 24, no. s1, pp. 268-281. 2014. Lintern, G. 2012. Work-focused analysis and design. Cognitive Technical Work 14, pp. 71. Springer-Verlag London Limited. Cummings, M.L. 2006. Can CWA inform the design of networked intelligent systems? Paper presented at Moving Autonomy Forward Conference, Lincoln UK. Sterman, J.D. 2000. Business dynamics: Systems thinking and modeling for a complex world. New York: Irwin/McGraw-Hill. March, S. & Smith, G. 1995. Design and natural science research on information technology. Decision Support Systems, 15, pp. 251. Hevner, A., March, S., Park, J. & Ram, S. 2004. Design science in information systems research. MIS Quarterly, 28(1), pp. 75. Venable, J. 2006. A framework for design science research activities. In Proceedings of the 2006 Information Resource Management Association Conference, Washington, DC, pp. 21-24. Baskerville, R., Pries-Heje, J. & Venable, J. 2009. Soft design science methodology. In Proceedings of the 4th International Conference on Design Science Research in Information Systems and Technology, Malvern, PA, pp. 9-20. Peffers, K., Tuunanen, T., Rothenberger, M. & Chatterjee, S. 2007. A design science research methodology for information systems research. Journal of Management Information Systems, 24(3), pp. 45. Baxter, G. & Sommerville, I. 2011. Socio-technical systems: From design methods to systems engineering. Interacting with Computers, 23(1), pp. 4. Checkland, P. & Poulter, J. 2007. Learning for action: a short definitive account of soft systems methodology and its use, for practitioners, teachers and students, UK, Wiley. Janlert, L.E. & Stolterman, E. 2010. Complex interaction. ACM transcript. Compututer-Human Interaction, 17(2), pp 8:1-8:32. White, B.E. 2010. Complex adaptive systems engineering. Aerospace and Electronic Systems Magazine, IEEE, 25(12), pp. 16. Papachristos, G. 2011. A system dynamics model of socio-technical regime transitions. Environmental Innovation and Societal Transitions, 1(2), pp. 202. Sheard, S.A. & Mostashari, A. 2009. Principles of complex systems for systems engineering. Systems Engineering, 12(4), pp. 295. Maria, A. 1997. Introduction to modeling and simulation. In Proceedings of the 1997 Conference on Winter Simulation. IEEE Computer Society, pp. 7-13. Ramos, A.L., Ferreira, J.V. & Barceló, J. 2010. Revisiting the similar process to engineer the contemporary systems. Journal of Systems Science and Systems Engineering, 19(3), pp. 321. Haskins C. (ed.). 2010. Systems engineering handbook: A guide for system life cycle processes and activities. Version 3.2., Revised by Krueger, M., Walden, D. & Hamelin, R.D. San Diego, CA: INCOSE. Buede, D.M. 2000. Engineering design of systems - Models and methods. John Wiley & Sons. Stanton, N.A., Baber, C. & Harris, D. 2012. Modelling command and control: Event analysis of systemic teamwork. UK: Ashgate Publishing, Ltd. Naikar, N., Moylan, A. & Pearce, B. 2006. Analysing activity in complex systems with cognitive work analysis: Concepts, guidelines and case study for control task analysis. Theoretical Issues in Ergonomic Science, 7(8), pp. 371. Jenkins, D.P., Stanton, N.A., Walker, G.H. & Salmon, P.M. 2009. Cognitive work analysis: Coping with complexity. UK: Ashgate Publishing. Vicente, K. 1999. Cognitive work analysis: Towards safe, productive and healthy computer-based work. Lawrence Erlbaum Associates. Lintern, G. 2008. The theoretical foundation of cognitive work analysis. In: Bisantz, A. & Burns, C. (eds.), Applications of cognitive work analysis. CRC Press. Forrester, J.W. 1968. Industrial dynamics - After the first decade. Management Science, 14(7), pp. 398. Meadows, D. 2008. Thinking in systems: A primer. Chelsea Green Publishing. Wolstenholme, E.F. 1990. System enquiry: A system dynamics approach. John Wiley & Sons. Meyer, M. & Van Graan, J.G. 2011. Effective community policing in practice: The Roodekrans Neighbourhood Watch case study, West Rand. Southern African Journal of Criminology. Acta Criminologica, 24(2), pp. 130-143.
[34] Zinn, R. 2010. Sourcing crime intelligence from incarcerated house robbers. SA Crime Quarterly, No. 32, pp. 27-35. [35] Vagias, W.M. 2006. Likert-type scale response anchors. Clemson International Institute for Tourism & Research Development, Department of Parks, Recreation and Tourism Management. Clemson University. [36] Vogt, W.P. 1999. Dictionary of statistics and methodology. Thousand Oaks, California: Sage. [37] Salmon, P., Stanton, N., Walker, G. & Green, D. 2006. Situation awareness measurement: A review of applicability for C4I environments. Applied Ergonomics, 37(2), pp. 225-238. [38] Taylor, R.M. 1990. Situational Awareness Rating Technique (SART): The development of a tool for aircrew systems design. AGARD, Situational Awareness in Aerospace Operations. [39] Williamson, D.F., Parker, R.A. & Kendrick, J.S. 1989. The box plot: A simple visual method to interpret data. Annals of Internal Medicine, 110(11), pp. 916-921.
29