Original Research published: 14 July 2015 doi: 10.3389/fneur.2015.00158
E
Alexandra Gramowski-Voß1*, Hans-Joachim Schwertle1, Anna-Maria Pielka2, Luise Schultz1,2, Anne Steder1, Konstantin Jügelt1, Jürgen Axmann3 and Wolfgang Pries4
Edited by: Niels Hansen, Ruhr University Bochum, Germany Reviewed by: Efthimios M. C. Skoulakis, Biomedical Sciences Research Centre Alexander Fleming, Greece Aurel Popa-Wagner, University of Medicine Rostock, Germany *Correspondence: Alexandra Gramowski-Voß, NeuroProof GmbH, Friedrich-Barnewitz-Strasse 4, Rostock 18119, Germany
[email protected] Specialty section: This article was submitted to Neurodegeneration, a section of the journal Frontiers in Neurology Received: 14 April 2015 Accepted: 25 June 2015 Published: 14 July 2015 Citation: Gramowski-Voß A, Schwertle H-J, Pielka A-M, Schultz L, Steder A, Jügelt K, Axmann J and Pries W (2015) Enhancement of cortical network activity in vitro and promotion of GABAergic neurogenesis by stimulation with an electromagnetic field with a 150 MHz carrier wave pulsed with an alternating 10 and 16 Hz modulation. Front. Neurol. 6:158. doi: 10.3389/fneur.2015.00158
Frontiers in Neurology | www.frontiersin.org
1 Division of Electrophysiology, NeuroProof GmbH, Rostock, Germany, 2 Division of Molecular Biology, NeuroProof GmbH, Rostock, Germany, 3 Engineering Office for Bioresonance and Environmental Technology, Werder/Havel, Germany, 4 Megawave GmbH, Bad Wörishofen, Germany
In recent years, various stimuli were identified capable of enhancing neurogenesis, a process which is dysfunctional in the senescent brain and in neurodegenerative and certain neuropsychiatric diseases. Applications of electromagnetic fields to brain tissue have been shown to affect cellular properties and their importance for therapies in medicine is recognized. In this study, differentiating murine cortical networks on multiwell microelectrode arrays were repeatedly exposed to an extremely low-electromagnetic field (ELEMF) with alternating 10 and 16 Hz frequencies piggy backed onto a 150 MHz carrier frequency. The ELEMF exposure stimulated the electrical network activity and intensified the structure of bursts. Further, the exposure to electromagnetic fields within the first 28 days in vitro of the differentiation of the network activity induced also reorganization within the burst structure. This effect was already most pronounced at 14 days in vitro after 10 days of exposure. Overall, the development of cortical activity under these conditions was accelerated. These functional electrophysiological changes were accompanied by morphological ones. The percentage of neurons in the neuron glia co-culture was increased without affecting the total number of cells, indicating an enhancement of neurogenesis. The ELEMF exposure selectively promoted the proliferation of a particular population of neurons, evidenced by the increased proportion of GABAergic neurons. The results support the initial hypothesis that this kind of ELEMF stimulation could be a treatment option for specific indications with promising potential for CNS applications, especially for degenerative diseases, such as Alzheimer’s disease and other dementias. Keywords: extremely low-electromagnetic field, cortical networks, neurogenesis, multiwell microelectrode recording, phenotypic screening, functional biomarker
Abbreviations: AD, Alzheimer’s disease; CNS, central nervous system; CV, coefficient of variation; Div, days in vitro; DMEM, Dulbecco’s modified Eagle’s medium; EEG, electroencephalography; ELEMF, extremely lowelectromagnetic field; GABA, gamma-aminobutyric acid; MEA, microelectrode array; MRI, magnetic resonance imaging; NIH, National Institute of Health; PTZ, pentylenetetrazole; SEM, standard error of mean.
1
July 2015 | Volume 6 | Article 158
Gramowski-Voß et al.
Enhancement of cortical neurogenesis by ELEMF stimulation
Introduction
target-based approaches (19–22). The MEA neurochip technology is a sophisticated phenotypic high-content screening method to characterize functional changes in network activity in electrically active cell cultures and it is very sensitive to neurogenesis, as well as neuroregenerative and -degenerative aspects (22–28, 29).
Already in 1896, Virchow expressed the modern idea in the context of regulation and disease: “The disease begins in the moment when the regulatory apparatus of the body is insufficient to eliminate the interference. Not life under abnormal conditions, not the disorder as such produces disease, but the disease begins with the insufficiency of the regulatory apparatuses” (1). In this respect, an increasing body of literature indicates that electrical and magnetic fields interact significantly with biological systems (2–6). Magnetic and electromagnetic fields (EMFs) are recognized by present-day medicine as real physical entities that could contribute to the healing of various health problems, e.g., pain treatment (7, 8). Electromagnetic therapies are well known and successful in medicine. Proposed and modeled mechanisms are, e.g., ion cyclotron resonance, ion parametric resonance (9, 10), free radicals (11), and the activation of heat shock proteins. One of the first electrochemical models proposed that the cell membrane exerts linear physicochemical changes (12, 13) to assess the EMF parameters for which biological effects might be expected. It was assumed that non-thermal EMF may directly affect ion binding and/or transport, and possibly alter the cascade of biological processes related to tissue growth and repair (4, 6, 14). However, the transduction mechanism for non-thermal EMF biological effects has not been fully elucidated. It is thought that the effectiveness is related to the fine manipulation of cell regulation and communication taking place in this power range. In recent years, several studies identified various stimuli capable of enhancing neurogenesis in adults, a process, which is dysfunctional in the senescent brain as well as in neurodegenerative and neuropsychiatric diseases. EMFs were already applied in several clinical studies. Saitoh and co-workers demonstrated in a randomized, multicenter, double-blind, crossover, sham-controlled clinical study that daily repeated 5-Hz transcranial magnetic stimulation of primary cortex provided short-term pain relief in neuropathic pain patients (15, 16). They also confirmed that high-frequency transcranial magnetic stimulation over the M1 food area significantly improved motor symptoms in patients with Parkinson’s disease (17). Pries and Baumgart (18) showed in a MRT study that treating patients with knee osteoarthritis twice a day for 60 min for eight consecutive days with exposure to 150 MHz fields pulsed with 10 Hz decreased knee contusion and recovered knee cartilage. Following up on these reports, we addressed in this study the possible involvement of basic modifications caused by alternating magnetic stimulation by determining functional phenotypic as well as morphological cellular changes. We investigated the effects of repeated exposures to 150 MHz stimulation with pulsed 10 and 16 Hz modulation on the developmental growth of primary cortical networks cultured on microelectrode arrays (MEAs) and their neuronal network activity by an electrophysiological multichannel recording assay. Unlike so-called target-based assays for tests of biological effects on individual receptors or target proteins, functional assays using primary cultures of neural networks on MEAs provide a reflection of the central nervous system with its complex multicellular interconnections. They allow phenotypic screening, which are demonstrably more successful in drug development than
Frontiers in Neurology | www.frontiersin.org
Materials and Methods Primary Cortical Cell Cultures
Experiments were carried out in accordance with the EU Directive 2010/63/EU on the protection of animals used for scientific purposes (certification file number 7221.3-2). As previously described (26, 30), embryonic frontal tissues were harvested from E 15 NMRI mice (Charles River, Sulzfeld, Germany). Frontal cortex was dissociated enzymatically in DMEM10/10 (10% horse and 10% fetal calf serum) including papain and DNase I, and mechanically with transfer pipettes. The cells were resuspended in DMEM10/10 at a density of 1.0 × 10⁶ cells/ml, and 300 μl were seeded onto each well of 12-well MEA neurochips (Axion Biosystems Inc., Atlanta, GA, USA). Each well contains an array of 64 embedded platinum electrodes resulting in a total of 768 channels. As non-electronic reference 24 well plates with 13 mm cover slips were plated with 100 μl at a density of 1.5 × 10⁶ cells/ml. For better adhesion, the neurochips were coated with poly-d-lysine and laminin before the preparation to ensure cell attachment within a confined adhesive region (5 mm diameter centered around the electrode area). Cultures were kept at 37°C in a 10% CO2 atmosphere for 4 weeks and fed twice a week with DMEM containing 10% horse serum (Figure 1A). The developing co-cultures were treated at day 5 in vitro with 5-fluoro-2′-deoxyuridine to prevent glial proliferation and overgrowth.
Alternating Magnetic Field Stimulation
The extremely low electromagnetic field (ELEMF) signal used in this study was generated by the stimulation device MegaWave MW150 (MegaWave GmbH, Bad Wörishofen, Germany), which is an accredited medicine product according to the medicine product guideline 93/42/EWG. It has a high-frequency oscillator stage that generates a fixed carrier frequency of 150 MHz. A low-frequency oscillator stage generates an adjustable lower frequency as the modulation frequency. Settings used in this study are depicted in Figure 2. The stimulation parameters as well as the distance between cortical cultures and stimulation probe were chosen from pilot study data (data not shown). The durations of the cycles were set to 100 or 62.5 ms (equivalent to 10 or 16 Hz) with modulation setting to 50% cycle time. The 50% stimulation rhythm (50 or 31.25 ms) was followed by 50% silence phase (50 or 31.25 ms) (Figure 2B). The power level was set to 3 resulting in a power output of 0.240 mW ± 15%. The magnetic induction pulses at the applied settings equaled a maximum magnetic flux density of 0.125 pT (125 E-15 Vs/m2). The distance between the applicator probe (cross section diameter 70 mm) and the cortical cultures was set to 83 mm (Figure 2A). Plastic ware empty multiwell plates were used as spacer. The cortical network cultures on Axion 12-well MEAs and 24-well plates were successively exposed from 4 to 28 days in vitro twice a week in a designated
2
July 2015 | Volume 6 | Article 158
Gramowski-Voß et al.
Enhancement of cortical neurogenesis by ELEMF stimulation
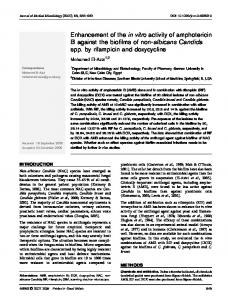
FIGURE 1 | Multichannel electrophysiological Axion electrode array of the 12-well plate for extracellular recording of cortical network activity. (A) Electrode area with cortical culture at 12 days in vitro (scale:
30 μm electrode diameter); (B) Spike activity heat map of frontal cortex activity (28 div) cultures in an Axion 12-well MEA with 64 electrodes per well.
FIGURE 2 | Extremely low-electromagnetic field exposure set up scheme. (A) Experimental stimulation set up in the incubator. (B) Waveform scheme of the extremely low-electromagnetic field studied here:
a 150-MHz carrier frequency signal is pulse modulated with 50% time modulation burst (100 or 62.5 ms) repeated for modulating frequencies 10 and 16 Hz.
incubator under constant conditions (10% CO2, 37°C) first to 30 min of a modulating frequency of 10 Hz followed by 30 min at 16 Hz. The control group (separate Axion 12-well MEAs and 24-well plates) was handled with the same procedure, except for the EMF exposure.
(Figure 1B). The neuronal networks were recorded after 14 and 28 days in vitro, respectively.
Multiparametric Data Analysis
Each unit represents the activity originating from one neuron recorded at one electrode. Units are separated at the beginning of the recording. We analyzed the stable activity phase of the last 30 min. Action potentials (spikes) were recorded as spike trains, which are clustered in so-called bursts. Bursts were quantified via direct spike train analysis using the standard interspike interval (ISI) method in NPWaveX (NeuroProof GmbH, Rostock, Germany). Bursts are defined by the following parameters: maximum ISI to start a burst: 40 ms, minimum ISI to end a burst: 200 ms, minimum interval between bursts: 100 ms, minimum duration of burst: 10 ms, and min number of spikes in a burst: 2.
Multichannel Recording
In principle, electrophysiological studies were performed as described by Gramowski et al. (26). Recordings were executed with the Maestro recording system by Axion Biosystems Inc. (Atlanta, GA, USA) providing 1200× amplification, sampling at 12.5 kHz, filtering, and spike detection, delivering whole channel neuronal spike data. For extracellular recordings, MEAs were maintained at 37°C and a pH of 7.4 through a continuous filtered and humidified airflow with 10% CO2. Recordings were made in DMEM with 10% horse serum. The network response was recorded for at least 1 h
Frontiers in Neurology | www.frontiersin.org
3
July 2015 | Volume 6 | Article 158
Gramowski-Voß et al.
Enhancement of cortical neurogenesis by ELEMF stimulation
Cross Validation and Similarity Analysis
With a multiparametric high-content analysis of the network activity patterns, we extract 204 activity-describing spike train parameters and thereby obtain a precise description of activity changes in the four categories as follows: general activity, burst structure, synchronicity, and oscillatory behavior. Changes in general activity parameters describe the effects on action potential firing rate (spike rate), burst rate, and burst period as the time between the bursts. Burst structure parameters define not only the internal structure of spikes within a high-frequency spiking phase (burst), e.g., spike frequency in bursts, spike rate in bursts, and burst spike density, but also the overall structure of the burst, such as duration, area, and plateau. Oscillatory parameters quantify the regularity of occurrence or structure of bursts, which is calculated by coefficients of variation of primary activity parameters describing the variability of parameters (general activity, burst structure) within experimental episodes (31). Higher values indicate less regular burst structure or less regular general activity (e.g., spiking, bursting). As a measure of synchronicity in the spike trains, CVnet parameters reflect synchronization among neurons within the network (31). CVnet is the coefficient of variation over the network. Large CVnet values imply a wide range of variation in the activity across the network, meaning less synchronization. Twelve out of 204 parameters were visualized as the most describing ones divided into the four categories as follows: general activity, burst structure, oscillation, and synchronization. The definitions for these 12 parameters are as follows: spike rate: number of spikes per second, averaged over all spike trains recorded per 60 s bin; burst rate: number of bursts per second, a measure for burstiness of units, averaged over all units recorded per 60 s bin; spike contrast: describes the occurrence or absence of spikes in neighboring time segments of the spike train, reflecting the variability in burstiness of units within experimental episodes; burst duration: mean lengths of bursts (milliseconds) based on ISI method; burst amplitude: bursts are mathematically superimposed with an integral function. The integral is defined by spike peak density in bursts and number of spikes. Burst amplitude is the peak amplitude of the integrated burst reflecting the fraction of the bursts with highest spike density; burst spike density: mean frequency of spikes within bursts (Hertz), defined by the average of all interspike intervals in a burst. Burst spike density increases if the number of spikes in burst increases or burst duration decreases; burst rate SD: SD of burst rate across 60 s bins, indicating the variability of burstiness of units within temporal episodes; Syn All: average distance of bursts within a population burst from population burst center, a measure for the strength of synchronicity of a network; Syn share: average fraction of units involved in population bursts, with higher values reflecting a higher degree of synchronicity between the units; burst rate CVnet: coefficient of variation of burst rate, reflecting spatial variation of burst rate over the network during experimental episodes; event rate: number of burst events per second, with an event defined as synchronous burst activity of at least 50% of all units in a network within a time frame of 300 ms; hamming factor: or hamming distance between two spike trains is the number of positions at which corresponding burst events are different. Here, the hamming factor is calculated for all corresponding spike trains with a binning of 10 s.
Frontiers in Neurology | www.frontiersin.org
Training data sets with all 204 spike train parameters were calculated for control and treatment groups. The respective data records of the two groups (exposure treatment and control) were classified using methods of pattern recognition (software package PatternExpert, NeuroProof GmbH, Rostock, Germany). As previously describes (26, 32), an artificial neuronal network was trained with the data using a multi-layer feed forward perceptron neural network and back propagation algorithm without hidden units and a resilient-propagation learning algorithm. There were as many input knots as there were parameters (204) and 4 output nodes, 1 for each classified group. Non-usage of hidden layers was justified by the relatively high variation of the data. The performed cross-validation indicates the functional similarity/dissimilarity of the treatment group and the control. χ2 analysis was performed on the cross-validation data to test for significant effects.
Immunocytochemistry
The recorded cortical cultures on Axion 12-well MEAs, as well as concurrently cultured cortical networks on 24-well plates with 11 mm glass cover slips from the different treatment groups were further analyzed by immunocytochemistry, fluorescence microscopy, and semi-automatic quantitative image analysis. The cells were initially washed with PBS and fixed with 4% paraformaldehyde for 30 min, followed by the addition of a PBS-based blocking solution containing 1% BSA, 2% goat serum, and 0.05% TWEEN20. Cells were immunostained with primary antibodies for neurites with anti-tubulin beta-III (1:750; Sigma-Aldrich, Germany), neuronal soma with anti-Hu C/D (1:500; neuronal-specific RNA-stabilizing protein present in neuronal cell bodies) (Invitrogen, Germany), synapses with anti-synapsin-1 (1:200; Cell Signaling, Germany), GABAergic neurons with anti-GABA (1:500; Sigma-Aldrich), and nuclei with the DNA dye Hoechst/Bisbenzimide (1 μg/ml; SigmaAldrich, Germany). Cortical networks were embedded with Prolong antifade gold (LifeTechnologies, Germany) and analyzed with an upright fluorescence microscope (Nikon Eclipse E800, Nikon AG, Japan). Images were analyzed using a semi-automatic image quantification tool (ImageJ2x, Rawak Software, NIH, USA). The following parameters were quantified per image: cell number, neuron number, neurite number, synapse number, % neurons, neurites per neuron, synapses per neurite, and number of GABAergic neurons.
Statistical Analysis
For the data and statistical analysis, all recorded networks in each treatment group were used with no exception. Results from primary analysis are expressed as series means ± SEM. The absolute parameters’ distributions were tested for normality. The level of significance after exposure treatment was assessed by using Student’s t-test and p