R E S E A R C H A N D A N A LY S I S
Environmental Impact Assessment of Household Consumption Diana Ivanova, Konstantin Stadler, Kjartan Steen-Olsen, Richard Wood, Gibran Vita, Arnold Tukker, and Edgar G. Hertwich
Keywords: environmentally extended multiregional input-output (EE-MRIO) analysis expenditure elasticity footprint analysis household environmental impacts industrial ecology regression analysis
Supporting information is available on the JIE Web site
Summary We analyze the environmental impact of household consumption in terms of the material, water, and land-use requirements, as well as greenhouse gas (GHG) emissions, associated with the production and use of products and services consumed by these households. Using the new EXIOBASE 2.2 multiregional input-output database, which describes the world economy at the detail of 43 countries, five rest-of-the-world regions, and 200 product sectors, we are able to trace the origin of the products consumed by households and represent global supply chains for 2007. We highlight the importance of environmental pressure arising from households with their consumption contributing to more than 60% of global GHG emissions and between 50% and 80% of total land, material, and water use. The footprints are unevenly distributed across regions, with wealthier countries generating the most significant impacts per capita. Elasticities suggest a robust and significant relationship between households’ expenditure and their environmental impacts, driven by a rising demand of nonprimary consumption items. Mobility, shelter, and food are the most important consumption categories across the environmental footprints. Globally, food accounts for 48% and 70% of household impacts on land and water resources, respectively, with consumption of meat, dairy, and processed food rising fast with income. Shelter and mobility stand out with high carbon and material intensity, whereas the significance of services for footprints relates to the large amount of household expenditure associated with them.
Introduction Scientists have investigated the resource use required to support household consumption in an effort to understand the relationship between humans and nature (Wackernagel and Rees 1996; Fischer-Kowalski et al. 2014; Herendeen and Tanaka 1976). They have investigated the emissions caused by the production, use, and disposal of products in final use to target efforts to reduce environmental impacts and assess trade-offs (Dietz et al. 2009; Hertwich 2011; Tukker et al. 2010). Traditionally, the analysis of household environmental impacts was based on national statistics and production systems, treating imported goods as if they had been produced in the country where they
are consumed (Lenzen et al. 2006; Hertwich 2011; Tukker and Jansen 2006). The energy and emissions intensities of products produced in different countries can be quite different, reflecting a combination of differences in the structure and efficiency of economies and in the product mix being produced. Including the technology of important trade partners as proxies for imports to Norway, Peters and Hertwich (2006) demonstrated a striking impact of technology differences: The foreign production of products consumed by Norwegian households accounted for 13 million tonnes carbon dioxide (CO2 ), whereas using domestic production as a proxy would give only 5 million tonnes. Weber and Matthews (2008) found significant effects also for the United States, which is less trade exposed. As a result, global
Address correspondence to: Diana Ivanova, Industrial Ecology Programme and Department of Energy and Process Engineering, Sem Sælands vei 7, Norwegian University of Science and Technology (NTNU), NO-7491 Trondheim, Norway. Email:
[email protected] © 2015 by Yale University DOI: 10.1111/jiec.12371
Editor managing review: Kuishuang Feng
Volume 20, Number 3
526
Journal of Industrial Ecology
www.wileyonlinelibrary.com/journal/jie
R E S E A R C H A N D A N A LY S I S
multiregional input-output (MRIO) models were developed to trace the environmental impacts associated with consumption. Hertwich and Peters (2009) provided the first analysis of the carbon footprint of different nations, identifying the role of households, public consumption, and investments, and specifying the role of different consumption categories as a function of income. These calculations have been reproduced and updated (Davis and Caldeira 2010) and extended to other pollutants, materials, land use, and water consumption (Wiedmann et al. 2015; Kanemoto et al. 2014; Steen-Olsen et al. 2012). In recent work, however, consumption is addressed more broadly, not focusing on understanding households, but rather looking at entire nations. In this article, we analyze the environmental impact of household consumption of different countries in terms of the material, water, and land-use requirements, as well as greenhouse gas (GHG) emissions, associated with the production and use of products and services consumed by these households. We do so using the newly established EXIOBASE 2.2 MRIO database, which describes the world economy in 2007 consisting of 43 countries, five rest-of-the-world (RoW) regions, and 200 product sectors (Wood et al. 2015). The land footprint reported here is an unweighted land use as opposed to the productivity weighting applied by Wackernagel and Rees (1996). The other indicators are water footprint (Hoekstra 2003), carbon footprint (Wiedmann and Minx 2008), and material footprint (Wiedmann et al. 2010). The concept of footprint family has been tested against criteria such as policy relevance, indicator coverage, and their complementary properties (Galli et al. 2012). The motivation behind the recent focus on national footprints is the importance of emissions embodied in international trade to climate policy (Wyckoff and Roop 1994; Munksgaard and Pedersen 2001; Peters and Hertwich 2008). Time series of national carbon footprints show that increasing imports from developing countries have contributed significantly to the continued rise of the national carbon footprint of developed countries, even though many of these countries have managed to stabilize and even reduce their territorial GHG emissions (Kanemoto et al. 2014; Peters et al. 2011). Whereas the national focus is appropriate for national and international policy making, an understanding of household footprints can provide insights into the social determinants of environmental impacts and can inform household actions directed toward reducing footprints. Household consumption has a strong relation with consumer behavior, lifestyles, and daily routines and a potential resistance to change owing to social and cultural embeddedness (Caeiro et al. 2012). Households have a relatively large degree of control over their consumption, but they often lack accurate and actionable information on how to improve their own environmental performance (Gardner and Stern 2008), and household footprint calculations can provide such information. The novelty of our study is that it uses an integrated methodological framework across the set of footprint indicators to evaluate household environmental performance based on a database with a higher level of environmental detail. This integrative approach allows us to assess and compare environmental impacts
of household consumption across indicators, regions, and consumption categories directly and with lower uncertainty. It can further be used to identify where mitigation of certain impacts, for example, emission reductions, would come at the expense of other impact categories, such as higher levels of water, land, and material consumption (Tukker et al. 2013).
Methods and Data Household environmental impacts are derived from an environmentally extended MRIO (EE-MRIO) model constructed using the high-resolution EXIOBASE database (Wood et al. 2015). The core of the model is an input-output table representing the flow of goods and services throughout the global economy for the reference year 2007. All emissions and resources required for the production of output are allocated to goods and services purchased by final consumers (Hertwich 2011). The analysis is based on version 2.2 of EXIOBASE, which features a higher level of detail on environmentally relevant sectors (e.g., agriculture, energy, and manufacturing) and environmental extensions (e.g., emissions, resource use, and pollutants) in comparison to other MRIO databases (Wood et al. 2015). EXIOBASE has a major advantage in providing much greater product disaggregation (200 product sectors) in an integrated framework within the system of environmental-economic accounting guidelines. It accommodates information about 43 countries, which, together, account for approximately 89% of global gross domestic product (GDP) and between 80% and 90% of the trade flow by value within Europe (Stadler et al. 2014). The MRIO table is supplemented with information on the environmental load intensities of economic sectors. Economic accounts were coupled with data on resource use and emissions sourced from databases with information on primary resource extractions, emission factors and activity variables, and agricultural and forestry activities (Food and Agriculture Organization of the United Nations Statistics Division, the International Energy Agency database, and so on) (Tukker et al. 2013). The global warming potential (GWP) metric is used to convert greenhouse gases (CO2 , methane, nitrous oxide, and sulfur hexafluoride) to equivalent amounts of CO2 by weighting their radiative properties for a time horizon of 100 years. Land use reflects use of cropland, pasture land, and forest land. The material footprint relocates the domestic extraction of raw materials (primary crops, crop residues, fodder crops, grazing, wood, aquatic animals, metal ores, nonmetallic minerals, and fossil fuels) from production to consumption in a mutually exclusive way, including only materials that are directly used by an economy. Our water footprint indicator includes blue (fresh surface and groundwater) water consumption embodied in agriculture and livestock products, manufactured products, electricity, and direct demand from households. The national environmental footprint is calculated as a function of the footprint multiplier, capturing the intensity of household purchases (e.g., amount of GHG emissions per euro [EUR] of household expenditure), and the product quantity demanded in monetary terms.
Ivanova et al., Environmental Impact Assessment of Household Consumption
527
R E S E A R C H A N D A N A LY S I S
Table 1 Environmental impact by final demand category Carbon footprint Households NPISH Governments Gross capital formation Changes in inventories
65 1 7 24 3
± ± ± ± ±
Land footprint
7% 1% 3% 7% 2%
70 1 5 19 5
± ± ± ± ±
Material footprint
11% 1% 3% 10% 5%
51 1 7 37 4
± ± ± ± ±
8% 1% 3% 9% 3%
Water footprint 81 1 5 10 3
± ± ± ± ±
7% 1% 3% 6% 2%
Note: The mean and standard deviation estimates respond to the sample of 43 countries included in the EXIOBASE with the deviation caused by the different distribution of final demand categories across countries. Environmentally relevant requirements are linked to final demand by households, nonprofit institutions serving households (NPISH), governments, gross capital formation, and changes in inventories. Changes in inventories occur when prices prevailing when goods are withdrawn differ from prices when production takes place (SNA 2008).
Following the convention of national accounts, final demand is the estimate obtained by summing household, nonprofit organization, and government spending as well as capital formation and changes in inventories and valuables in a given year (SNA 2008). In order to isolate the environmental impacts of households, we only take into account household expenditure across product sectors. This approach allows us to estimate the magnitude of indirect GHG emissions and resource use embodied in the global supply chains of household purchases subject to certain limitations discussed later. In addition, households generate environmental stress directly through their use of some products, for example, when driving or using fuel to heat their homes. In EXIOBASE, household direct impacts are aggregated into a total for each region. We distribute direct carbon emissions between personal transport and residential fuel use following the GTAP 7 database (Lee 2008). Using GTAP, we allocated CO2 emissions from coal, crude oil, and gas to housing (i.e., shelter) and those from petroleum products to transport. Direct water use was allocated to shelter under the consideration of previous observations (see Vewin 2012; Vickers 2001; EEA 2001). Direct noncommercial use of land and materials by households was neglected. Finally, by applying the concept of expenditure elasticity, we are able to evaluate changes in the environmental footprints resulting from changes in household expenditure (Baiocchi et al. 2010; Kerkhof et al. 2009; Weber and Matthews 2008). Household expenditure elasticity, ε, measures the percentage change in the quantity of environmental impacts with respect to a 1% rise in the total household demand (measured in monetary units) (equation 1): εi = (∂ f i /∂ y)/( f i /y)
(1)
where y represents per capita yearly expenditure and f represents per capita footprint for each of the footprint indicators i. Model (1) can be transformed using natural logarithm transformation resulting in a set of univariate regressions for each footprint indicator, where a and ɛ are constants and u is the error term (equation 2): ln f i = a i + εi ln y + u i
528
Journal of Industrial Ecology
(2)
Results Carbon Footprint The global carbon footprint associated with household consumption in 2007 was 22 gigatonnes (Gt) carbon dioxide equivalent (CO2 -eq) including direct impacts and impacts embodied in household purchases. This amounts to 65% of the total emissions generated that year. The average allocation of environmental impacts across final demand categories is presented in table 1. GHG emissions were unevenly distributed across regions with households in four major economies, namely, the United States, China, Japan, and Russia, contributing to roughly half of the global impacts from household consumption. Households in the United States alone contributed to a quarter of global emissions, or 5.6 Gt CO2 -eq. The most significant contribution is from the consumption of energy-intensive services and electricity produced from coal. The household carbon footprint of the European Union (EU) amounted to 4.9 Gt CO2 -eq. On a per capita basis, carbon footprints of households vary widely (figure 1). The United States contributes to 18.6 tonnes (t) CO2 per capita (CO2 -eq/cap). The world average is 3.4 t CO2 -eq/cap, suggesting a 5.5-factor difference. In terms of the total final demand, the United States contributes to 4.9 times higher GHG emissions than the world average from a consumption perspective and to only 3.9 times higher emissions from a production perspective. Thus, the United States are a net importer of GHG embodied in traded goods, largely owing to household consumption, 74% of the country’s final demand. A strong positive correlation between GDP per capita based on purchasing power parity (PPP) and per capita carbon footprints is signaled by the correlation coefficient of 0.87. Several Western economies, such as Sweden (8.7 t CO2 -eq/cap), France (8.8 t CO2 -eq/cap), and Japan (9.0 t CO2 -eq/cap) stand out with lower impacts than countries with similar income related to the prevalence of nuclear and hydro power (EEA 2013). Hence, a significant portion of household impacts from Sweden and France are embodied in imports, 65% and 51%, respectively (figure 2), owing to their higher carbon intensity compared to domestic production. The distribution of GHG emissions from household activity on domestic goods and imports varies largely across countries.
R E S E A R C H A N D A N A LY S I S
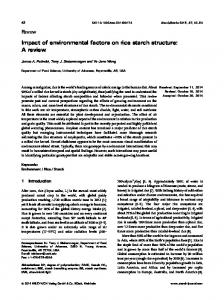
Countries World average Austria Belgium Bulgaria Cyprus Czech Republic Germany Denmark Estonia Spain Finland France Greece Hungary Ireland Italy Lithuania Luxembourg Latvia Malta Netherlands Poland Portugal Romania Sweden Slovenia Slovakia United Kingdom United States Japan China Canada South Korea Brazil India Mexico Russia Australia Switzerland Turkey Taiwan Norway Indonesia South Africa
Carbon Footprint(tCO2-eq) Land Footprint (1000 m2) Material Footprint (t) Water Footprint (m3) 3.4 10.0 4.9 209 11.3 18.1 17.4 298 12.2 28.1 17.8 492 5.4 6.9 8.1 182 10.9 9.2 12.4 278 9.4 9.2 11.8 174 11.9 20.0 16.0 347 12.2 20.9 16.8 453 10.9 20.9 15.6 258 8.1 21.0 14.2 561 13.6 27.4 17.9 304 8.8 22.3 14.2 396 13.4 26.9 18.3 700 5.9 8.2 7.3 194 12.9 22.1 17.1 297 9.6 19.1 13.6 407 6.5 12.5 9.1 180 18.5 44.4 27.6 816 6.2 22.9 10.8 181 9.2 14.9 14.8 628 11.8 35.5 17.2 575 7.8 9.2 10.3 130 6.8 18.0 11.5 509 4.6 9.4 12.2 325 8.7 18.8 15.7 322 10.1 20.2 13.4 262 8.3 14.5 11.9 287 13.3 21.9 17.9 456 18.6 23.0 18.4 651 9.0 11.2 9.2 290 1.8 5.4 3.1 130 14.6 40.6 18.1 510 8.7 13.8 10.4 340 1.8 22.0 8.2 159 0.8 2.1 2.0 261 3.8 16.6 5.9 277 7.6 69.6 9.3 331 17.7 160.8 26.3 660 11.3 26.5 15.7 396 4.7 13.0 7.7 388 8.6 9.2 7.7 308 10.3 37.2 18.6 474 1.3 2.6 2.7 81.5 5.5 21.5 6.6 165
Figure 1 Environmental footprints of household consumption across countries. The figure includes the world average and 43 selected countries from EXIOBASE, ordered alphabetically by country codes. The world average includes all 43 countries and the five rest-of-the-world regions.
Ivanova et al., Environmental Impact Assessment of Household Consumption
529
R E S E A R C H A N D A N A LY S I S
Carbon footprint
Land footprint
China
Material footprint
Russia
South Africa
Australia
India
India
Indonesia
Indonesia
China
Brazil
South Africa
Russia
India
India
Brazil
United States
Water footprint
China
Brazil
Indonesia
United States
South Africa
Turkey
Poland
Greece
Brazil
China
Mexico
Indonesia
Australia
Mexico
Australia
South Africa
Canada
United States
Taiwan Poland
United States
Mexico
Mexico
Russia
Australia
Turkey
Turkey
Japan
Poland
Canada
France
Turkey
Sweden
Greece
Poland
Canada
Norway
Sweden
Sweden
South Korea
Greece
France
Canada
France
Norway
Norway
Greece United Kingdom
United Kingdom
Germany
Germany
Switzerland
Netherlands
Germany
France
South Korea
Sweden
0%
Indirect domestic
40%
60%
Indirect foreign
80%
100%
Direct
0%
United Kingdom
Japan
Netherlands 20%
Germany
Switzerland
Taiwan
Switzerland
Taiwan
United Kingdom
Japan
Norway
Russia
Japan
South Korea
Switzerland
Netherlands
South Korea
Taiwan 20%
40%
Indirect domestic
60%
80%
100%
Indirect foreign
Netherlands 0%
20%
40%
Indirect domestic
60%
80%
Indirect foreign
100%
0%
20%
Indirect domestic
40%
60%
Indirect foreign
80%
100%
Direct
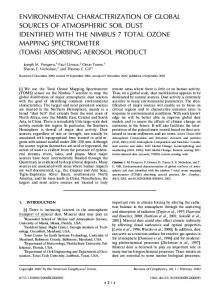
Figure 2 Indirect versus direct environmental impacts of household consumption across 23 selected countries. The figure separates household consumption footprint on direct (pressures that are emitted directly by consumption activities), indirect domestic (embodied in domestically produced products and services), and indirect foreign (embodied in imported products and services) across selected countries available in EXIOBASE. Households are not accountable for direct environmental impacts in relation to land and material use in EXIOBASE. Countries have been ordered by their share of indirect domestic impacts. Check the supporting information available on the Web for an overview of all 43 countries.
Luxembourg stands out with a low share of domestic indirect emissions, approximately 1.4 t CO2 -eq/cap in 2007 or 8% of the country’s carbon footprint (figure 2). China, on the other hand, relies strongly on domestic production to satisfy local household demand, with indirect domestic impacts accounting for 92% of the country’s total footprint. Households emitted 4.4 Gt CO2 -eq directly through activities involving combustion of fuel amounting to roughly 20% of global GHG emissions from household activity. On average, direct carbon emissions originate from the use of transport (73%) and household fuel (27%). The share of direct GHG emissions is largest for households in France and Belgium, more than 28%. The larger fraction of carbon impacts occurs in the form of emissions embodied in purchases, as opposed to direct impacts. On a global scale, GHG emissions embodied in household purchases are driven by consumption of services (27%), shelter (25%), manufactured products (17%), mobility (15%), and food (13%). Figure 3 presents an analysis of the carbon intensity of different consumption categories of EU households. Mobility has the highest amount of emissions per unit of household expenditure within the EU, 3.4 kg CO2 -eq/EUR (figure 3). Through driving own vehicles, EU households emit roughly half of the GHG emissions related to mobility directly, a total of 0.7 Gt CO2 -eq. The remaining mobility-related emissions are indirect emissions, in particular, consumption of gasoline and diesel (0.4 Gt CO2 -eq) and motor vehicles (0.2 Gt CO2 -eq). Shelter is similarly significant for the carbon footprint of EU households, comprising 26% of their impacts. This consumption category has a lower carbon intensity, 0.9 kg CO2 -eq/EUR, though it is associated with a higher share of household expenditure. Of of
530
Journal of Industrial Ecology
the six consumption categories, services are least carbon intensive; however, 45% of household expenditure is directed toward consumption of services, hence, the category’s contribution of 17% from the total carbon impacts within EU. Land Footprint Almost 65 million square kilometers (km2 ) of global land use was required to meet household demand in 2007. As a result, roughly 70% of the global land use was embodied in household purchases, with the ratio reaching up to 94% for Russia and South Africa. Other countries with developed resourceintensive forestry sectors, such as Canada and Finland, rely strongly on wood products for domestic construction and investments, hence, their lower relative importance of households (figure 2). Together, the purchases of households in Russia, China, the United States, Brazil, and Australia account for more than 48% (31 million km2 ) of total land resources embodied in household consumption in 2007. The EU contributed 15% (9.6 million km2 ). GDP correlates weakly with household land requirements, with a correlation coefficient of 0.38. Australia has the most extensive per capita land footprint, 0.16 km2 /cap, more than 16 times higher than the global average of 0.01 km2 /cap. Russia has the second largest impact per capita at 0.07 km2 /cap. The two countries are also the ones with the highest share of household impacts embodied in domestic production, equivalent to more than 93% of land use. Australian land use is embodied in household purchases of food products, whereas shelter requirements dominate the land footprint of Russian households. Other forestry-rich countries, such as Norway and
R E S E A R C H A N D A N A LY S I S
8
4
3
Mobility
Food
Manufactured Products
Clothing and Footware
7
Shelter Clothing and Footware
Shelter
6
Food
Services
Services
Mobility
2.5
5
2
4
1.5
3
1
4.3% 26.2%
3.5%
2 12.8%
9.5% 0.5
17.2%
0 0
5000
2.625
10000
EXPENDITURE PER CAPITA (EUR)
0
0
Clothing and Footware 60.7%
Manufactured Products
Clothing and Footware 2.25
Services 0.15
Shelter
Mobility
Services 1.875
Shelter 0.125
20.3% 9.5% 4.7%
1.5
0.1
1.125
0.075
19.7%
0.75
5.0%
0.05 19.7%
0.375 16.4%
0.175
Mobility
13.4%
1
Food
Manufactured Products
Manufactured Products
3
16.6%
0.2 Food
26.0%
51.1%
MATERIAL FOOT PRINT MULTIPLIER (KG/EUR)
3.5 27.0%
10.7%
0.025
18.5%
2.0%
10000 5000 EXPENDITURE PER CAPITA (EUR)
0 0
5000
10000
EXPENDITURE PER CAPITA (EUR)
0
0
5000
2.0%
3.1%
10000
EXPENDITURE PER CAPITA (EUR)
Figure 3 Contribution of consumption categories to the carbon, land, material, and water footprint of EU households. The contribution of consumption categories to the total environmental footprints can be split into two parts: the quantity of products within the category bought, measured by expenditure per capita in EUR, and the footprint intensities measured by footprint multipliers—the environmental impact per EUR of expenditure in the category. Consumption categories in the legend have been ordered by their environmental intensity (by magnitude of multipliers). The footprint multipliers are measured in kg CO2 -eq/EUR for carbon, m2 /EUR for land, kg/EUR for material, and m3 /EUR for water. The percentage labels describe the share of a category’s footprint from the total footprint of household consumption within EU. The lighter shaded parts of “Shelter” and “Mobility” columns denote direct GHG emissions and water use by households. Check the supporting information on the Web for a breakdown of countries’ footprint across consumption categories. EU = European Union; EUR = euro; kg CO2 -eq = kilograms carbon dioxide equivalent; m2 = square meters; m3 = cubic meters; GHG = greenhouse gas.
Finland, similarly have a significant portion of land use linked to purchases of wood and other forestry products. Smaller EU economies face geographical restrictions and limited resources encouraging them to satisfy a larger share of household demand through imports from the developing world. As depicted in figure 2, households in Luxembourg, the Netherlands, and Belgium give rise to the highest land footprint per capita within the EU, although only a negligible fraction of that reflects domestic land use, between 1% and 3%. A significant share of the land impacts of the countries is owing to imports of crops and seeds from Brazil, China, and the United States. The Netherlands, for example, relies strongly on imported feed for its developed livestock industry (Tukker et al. 2014). On a global scale, 46% of the land use occurs to meet household demand for food, followed by shelter and services, contributing 26% and 15%, respectively. Food has the largest land multiplier within the EU, with 7.2 square meters (m2 )/EUR spent on food. Household consumption of nonclassified food items entails a significant fraction of resource use across EU countries, around 2.6 km2 . Clothing is the second most land-intensive of consumption categories (figure 3), though it is associated with only 4% of the land use by EU households. Mobility is the least land-intensive consumption category requiring 0.5 m2 /EUR. Area covered by roads and other transportation infrastructure are not included in the estimate. Material Footprint The global material footprint of households amounted to 32 Gt in 2007, which is equivalent to 48% of the total raw materials that were extracted and used that year (table 1). Two
fifths of the total material use fulfills consumption requirements of households in the United States, China, India, and Brazil. In 2007, households from the United States alone contributed to the largest material footprint in absolute values, 5.5 Gt or 17% of the global material impacts. More than one quarter of this amount was used to enable local consumption of products of meat cattle, processed food, and hotel and restaurant services. In comparison, the EU has a household material footprint of 7.1 Gt. On a per capita basis, Luxembourg and Australia stand out with high levels of material footprint, 27.6 and 26.3 t/cap, respectively. Other developed economies show similar levels of household material impacts, hence, the correlation of 0.87 between national GDP and material footprint. In comparison, the global average amounts to 4.9 t/cap. Across the selected 43 countries, India has the lowest value of material impacts per capita, 2 t/cap. Forty percent of global household material impacts (13 Gt) can be linked to internationally traded commodities across the 43 countries and five RoW regions. For Luxembourg, only 2% of the material footprint results from domestic extraction of materials, equivalent to a total of 0.2 million tonnes (Mt) in 2007. The rest of the material footprint, a total of 13 Mt, can be linked to household consumption of foreign products with highest environmental impacts embodied in imports of raw materials (e.g., crude oil, sand, and clay) from Russia and China and chemicals (e.g., fertilizers) from India. In the case of Australia, 58% of households’ total material footprint in 2007, around 322 Mt, is linked to extraction of raw materials from the domestic natural environment. The material footprint embodied in imports is dominated by industrial
Ivanova et al., Environmental Impact Assessment of Household Consumption
531
R E S E A R C H A N D A N A LY S I S
materials (e.g., sand and clay, and coal) from China. Norway has the third largest material footprint per capita. More than three fourths of the embodied material impacts relate to foreign extraction, especially imports from China and Russia. The country is a net exporter of materials such as stone and crude oil. Globally, 36% of the material footprint arising from household activity can be attributed to food consumption, followed by services (23%) and manufactured products (17%). A comparison of the material intensities of consumption categories in the EU (figure 3) shows food to have the highest material multiplier, with 2.8 kilograms (kg) of extracted materials embodied per EUR. More than 11% of EU households’ material footprint is embodied in consumption of processed food and dairy products (0.8 Gt). Consumption of manufactured products is the second largest contributor to the material footprint of EU households, with 20% (1.8 kg/EUR). Water Footprint In 2007, the global blue water footprint associated with household consumption is 1,386 cubic kilometers (km3 ). Thus, households accounted for 81% of the total use of fresh water resources, followed by fixed capital formation (10%) and demand from governments (5%). A total of 670 km3 or 48% of global water impacts is embodied in household activity from India, the United States, and China. The per capita footprint is smallest in Indonesia, with 82 m3 /cap, and largest in Luxembourg, with 820 m3 /cap, with a global average of 210 m3 /cap. Again, the GDP level correlates positively with household freshwater use, with a coefficient of 0.74. Our choice of environmental indicator, however, could potentially influence the findings. Blue water consumption does not take into account the variation of crop water needs owing to the climate with dry warm climates, such as Spain, requiring much irrigation (Steen-Olsen et al. 2012). On average, less than 5% of total household water footprint is in the form of direct consumption of water resources. Russia, Canada, the United States, and Norway stand out among the countries, with the largest per capita direct water use by households ranging between 28 and 25 m3 /cap. With regard to water use embodied in global supply chains, consumption of agriculture and livestock products required a total of 975 km3 of water resources, or 74% of the indirect water footprint. The second largest contributor to blue water footprint is the services sector demanding approximately 18% of global household footprint. South Korea has the largest contribution of services to water use: 34% of the total footprint or 5.3 km3 . Hotel and restaurant services have the highest water intensity. Water footprint multipliers are ranked similar to the land footprint multipliers within the EU, with food being most intensive (0.17 m3 /EUR), followed by clothing (0.05 m3 /EUR) and manufactured products (0.02 m3 /EUR). Approximately 27% of household water footprint was embodied in imports (370 km3 ). Luxembourg has the highest fraction of impacts embodied in imports amounting to 99% with 532
Journal of Industrial Ecology
high importance of food imports, such as seeds, grains, vegetables, and fruits. Greece has the second highest per capita footprint, approximately 700 m3 , which is relatively equally distributed across domestic extraction (57%) and imports (41%) of indirect water resources, with the latter largely linked to food and agricultural products. Emerging economies such as the Brazil, Russia, India and China (BRIC) countries, are selfsustained when it comes to their water consumption. The environmental impacts of household consumption are strongly correlated with consumer expenditure as listed in table 2. The expenditure elasticity of carbon is positive and significant at the 1% level, meaning that as household income levels rise, the carbon footprint increases by 66% for each doubling of household spending. The land and water footprint further have a positive statistical association with household expenditure, though differences in the expenditure variable explain a much lower fraction of the variation of the resource use across countries. Elasticity of food and shelter have the lowest R2 , likely reflecting the relevance of other determinants of land and water use such as natural resource availability and other geographical conditions (Hertwich and Peters 2009). A further breakdown of expenditure elasticities on a sectoral level shows that environmental impacts from staple food purchases (e.g., wheat, cereal grains, seeds, and nonclassified crops) do not increase significantly with household expenditure, unlike the footprint of dairy and meat products. The share of emissions and resources use for production of nonprimary consumption items, such as some services, manufactured products, and clothing consumed by households, is much smaller in emerging economies and strongly driven by rising levels of disposable income and expenditure. This is reflected in the higher elasticities coefficients of those consumption categories across the footprint indicators (table 2).
Discussion and Conclusions This study provides a comprehensive insight into the global environmental impacts by households. It highlights the significance of environmental pressure arising from households, with their consumption giving rise to more than 60% of global GHG emissions and between 50% and 80% of total resource use. A significant portion of the emissions and resource use are embodied in internationally traded commodities. The regression analysis introduces household expenditure as a positive and highly significant determinant of household environmental impacts, with an elasticity coefficient varying between 0.40 for water and 0.66 for carbon. National income is also positively correlated with the footprints, which is consistent with our expectations that higher disposable income of households reflects more purchases of products, hence, higher levels of embodied impacts. The correlation coefficient describing the relationship between GDP and household land use is smaller than the coefficients regarding the other footprints, suggesting the importance of other factors for the variation of land use. For example, previous studies have investigated the
R E S E A R C H A N D A N A LY S I S
Table 2 Elasticity of footprints with respect to total household expenditure, by footprint and consumption category Carbon footprint ɛ
Land footprint
Material footprint
Water footprint
R2
ɛ
R2
ɛ
R2
ɛ
R2
0.40***
0.54
0.20* —
0.07 —
0.75*** 0.30*** 0.67*** 0.54*** 0.72*** 0.69***
0.60 0.35 0.62 0.38 0.77 0.51
Total
0.66***
0.83
0.56***
0.49
0.54***
0.85
Direct impact Shelter Mobility
0.70* 0.80***
0.08 0.83
— —
— —
— —
— —
Indirect impact Shelter Food Clothing Mobility Manufactured products Services
0.58*** 0.41*** 0.58*** 0.77*** 0.75*** 0.75***
0.44 0.62 0.63 0.79 0.86 0.81
0.45** 0.49*** 0.76*** 0.80*** 0.88*** 0.91***
0.20 0.41 0.65 0.68 0.69 0.69
0.73*** 0.29*** 0.63*** 0.76*** 0.75*** 0.71***
0.54 0.46 0.62 0.81 0.87 0.81
Note: Expenditure elasticity of consumption measures the effect of changes in per capita expenditure on the environmental footprints. The “Total” row shows the estimated coefficients when using the total per capita footprints as dependent variables that are regressed on household expenditure per capita. To compare coefficients across consumption categories, additional regressions are run separately where dependent variables are the environmental footprints of the different categories. The land and material footprints are associated with no direct impacts by households. The symbols *, **, and *** denote significance levels, α, of 10%, 5%, and 1%, respectively.
influence of resource availability on the national land-use footprints (Wiedmann et al. 2015; Weinzettel et al. 2013). We also find the largest consumers of land, Russia (forest land) and Australia (arable and pasture land), to have the highest share of domestic land impacts, suggesting that households tend to consume more resources when they are readily available. It should be noted that our land indicator currently does not capture any potential differences in the land’s fertility across countries; how the choice of indicator affects results should be investigated further. We confirm earlier conclusions about mobility, shelter, and food being the most important consumption categories (Hertwich and Peters 2009). Though their environmental relevance varies across footprint indicators, the three categories consistently make up between 55% and 65% of the total impacts. Food has the highest land, material, and water multipliers, hence, switching a EUR of expenditure from food to clothing in the EU, for example, results in a reduction of 5.1 m2 of land resources, 1.0 kg of extracted materials and 0.1 m3 of fresh water. At the same time, any redirecting expenditure from the food category to any other services would cause increases in GHG emissions. This brings attention to an important implication for any policy targeting reductions of household footprints in absolute terms, particularly, what is the environmental opportunity cost of reducing impacts in a certain category. Conversely, a redirection of household expenditure toward less resource-intensive services is more straightforward given that it results in impact reduction across all footprint indicators. Nevertheless, one should always regard a certain degree of nonsubstitutability of consumption items and categories in the redesign of household expenditure patterns. Further, GHG emissions and resource use from food consumption rise with income, though at a lower rate than nonprimary consumption categories. The result is mainly driven by
rising importance of dairy and meat products, processed food, and tobacco products at high household expenditure. The large footprints of nonclassified food items necessitate further investigation. Mobility has the largest carbon footprint in the EU, with household impact roughly evenly distributed between direct tailpipe emissions from driving private cars and emissions embodied in purchases of fuel, transport services, and vehicles. The magnitude of direct emissions is also strongly determined by total household expenditure, with a doubling of the total expenditures resulting in an 80% rise of direct transport emissions. The results draw attention to potential limitations of policy measures to reduce GHG emissions related to transportation. For starters, if the sole effect of rising purchasing power on mobility demand was to switch to more fuel-efficient vehicles, we would have found a negative coefficient on direct emissions. Instead, our results can be explained by other effects taking place as well. For instance, low-income households are generally characterized by lower car ownership rates; hence, they are more likely to resort to low-carbon alternatives, such as public transportation and cycling (Steen-Olsen et al. 2016). Further, the more efficient use of own vehicles potentially gives rise to rebound effects that could be direct (driving more owing to increased affordability of fuel) and indirect (switching purchasing power to other goods). Nevertheless, we show that mobility has the largest carbon multiplier in the EU context, according to which a redirection of 1 euro of household expenditure to the second most carbon-intensive category, manufactured products, would result in a carbon cut of 2.4 kg CO2 -eq. This is rather encouraging for residential GHG mitigation programs, especially in areas with high motor vehicle emissions. In 2007, shelter, more particularly, the consumption of electricity, wood products, housing fuel, and real estate services,
Ivanova et al., Environmental Impact Assessment of Household Consumption
533
R E S E A R C H A N D A N A LY S I S
contributed to 26% of the carbon, 13% of the land, and 20% of the material footprints within the EU, with average impact intensity relative to other consumption categories. Statistical analyses indicate insignificant elasticity coefficients on direct shelter impacts and significant, though smaller, coefficients on indirect ones. As a basic need, shelter is relatively more important at low income; in contrast, we expect the importance of nonprimary categories to increase at a higher rate with rising consumer purchasing power. Our model assigns environmental impacts according to household expenditure on products and services; hence, the model potentially leaves out relevant consumption financed by the government and investment. The implications are twofold. First, potential differences might occur across countries in terms of which goods and services households cover directly, thus, imposing limitations to the comparative analysis. For example, the sector of health and social work services has the second largest carbon footprint out of all industrial sectors in the United States, whereas its lower relative importance in other countries relates to health-related expenditures often being covered by governments or employers (Hertwich 2011; Ferguson and MacLean 2011; Weber and Matthews 2008). Second, the model falls short when it comes to endogenizing capital, such as residential buildings and road infrastructure used by household and underestimates household impacts related to shelter and mobility. Actual and imputed rent is included in the calculation of environmental impacts from real estate services, which contributed to 4% of global carbon and material footprints by households in 2007. A significant fraction of household footprints in the developed world depends on impacts embodied in imports from poorer countries. This limits developed countries’ ability to decouple impacts from wealth (and expenditure) through technology and efficiency improvements. Our study further has some limitations regarding the macro-level expenditure elasticities. The cross-country regression results need to be interpreted cautiously in the absence of corresponding expenditure elasticities at the micro level (Baiocchi et al. 2010; Hubacek et al. 2014). For example, we have no way of observing potential changes in the expenditure-footprint relationship across countries and socioeconomic groups. Further, previous studies have signaled for the benefits of spatial aggregation in relation to the calculation of environmental impacts embodied in trade (Su and Ang 2010). Our study provides a comprehensive insight about the environmental consequences of household purchasing decisions and informs mitigation strategies about the consumption categories with the highest environmental relevance. This work goes beyond presenting a snapshot of household emissions and resource use and provides a different perspective on footprint determinants and strategies for environmentally driven reallocation of household spending. Ultimately, a behavioral change may have a significant potential to balance economic growth with environmental performance.
534
Journal of Industrial Ecology
Acknowledgments This work is part of the GLAMURS project financed by the European Union’s seventh framework program (contract 613420). EXIOBASE 2.2 was constructed in the CREEA project, financed by the same program (contract 265134).
References Baiocchi, G., J. Minx, and K. Hubacek. 2010. The impact of social factors and consumer behaviour on carbon dioxide emissions in the United Kingdom. Journal of Industrial Ecology 14(1): 50– 72. http://doi.wiley.com/10.1111/j.1530-9290.2009.00216.x. Accessed 19 August 2014. Caeiro, S., T. B. Ramos, and D. Huisingh. 2012. Procedures and criteria to develop and evaluate household sustainable consumption indicators. Journal of Cleaner Production 27: 72–91. http://linkinghub.elsevier.com/retrieve/pii/S0959652611005671. Accessed 12 July 2014. Davis, S. J. and K. Caldeira. 2010. Consumption-based accounting of CO2 emissions. Proceedings of the National Academy of Sciences of the United States of America 107(12): 5687–5692. www. pubmedcentral.nih.gov/articlerender.fcgi?artid=2851800&tool= pmcentrez&rendertype=abstract. Accessed 15 July 2014. Dietz, T., G. T. Gardner, J. Gilligan, P. C. Stern, and M. P. Vandenbergh. 2009. Household actions can provide a behavioral wedge to rapidly reduce US carbon emissions. Proceedings of the National Academy of Sciences of the United States of America 106(44): 18452– 18456. www.pubmedcentral.nih.gov/articlerender.fcgi?artid= 2767367&tool=pmcentrez&rendertype=abstract. Accessed 13 October 2015. EEA (European Environment Agency). 2001. Indicator fact sheet signals 2001. Chapter households. www.eea.europa.eu/data-andmaps/indicators/household-energy-consumption/householdwater-consumption. Accessed 13 October 2015. EEA (European Environment Agency). 2013. Environmental pressures from European consumption and production. Copenhagen: EEA. Ferguson, T. M. and H. L. MacLean. 2011. Trade-linked Canada— United States household environmental impact analysis of energy use and greenhouse gas emissions. Energy Policy 39(12): 8011–8021. http://linkinghub.elsevier.com/retrieve/pii/ S0301421511007452. Accessed 31 July 2014. Fischer-Kowalski, M., F. Krausmann, and I. Pallua. 2014. A sociometabolic reading of the Anthropocene: Modes of subsistence, population size and human impact on Earth. The Anthropocene Review 1(1): 8–33. http://anr.sagepub.com/lookup/ doi/10.1177/2053019613518033. Accessed 3 November 2014. Galli, A., T. Wiedmann, E. Ercin, D. Knoblauch, B. Ewing, and S. Giljum. 2012. Integrating ecological, carbon and water footprint into a “footprint family” of indicators: Definition and role in tracking human pressure on the planet. Ecological Indicators 16: 100– 112. www.oneplaneteconomynetwork.org/resources/programmedocuments/WP8_Integrating_Ecological_Carbon_Water_ Footprint.pdf. Accessed 23 July 2014. Gardner, G. T. and P. C. Stern. 2008. The short list: The most effective actions US households can take to curb climate change. Environment 50(5): 12–25. Herendeen, R. and J. Tanaka. 1976. Energy cost of living. Energy 1(2): 165–178.
R E S E A R C H A N D A N A LY S I S
Hertwich, E. G. 2011. The life cycle environmental impacts of consumption. Economic Systems Research 23(1): 27–47. www. tandfonline.com/doi/abs/10.1080/09535314.2010.536905. Accessed 16 July 2014. Hertwich, E. G. and G. P. Peters. 2009. Carbon footprint of nations: A global, trade-linked analysis. Environmental Science & Technology 43(16): 6414–6420. www.ncbi.nlm.nih.gov/pubmed/19746745. Accessed 13 October 2015. Hoekstra, A. Y. 2003. Virtual water trade: Proceedings of the International Expert Meeting on Virtual Water Trade. www.waterfootprint.org/Reports/Report12.pdf. Accessed 13 October 2015. Hubacek, K., K. Feng, J. C. Minx, S. Pfister, and N. Zhou. 2014. Teleconnecting consumption to environmental impacts at multiple spatial scales. Journal of Industrial Ecology 18(1): 7–9. http:// doi.wiley.com/10.1111/jiec.12082. Accessed 7 October 2014. Huijbregts, M., E. Hertwich, A. H. Strømman, and C. Solli. 2007. Postgraduate school of industrial ecology—Life cycle assessment. Bratislava, Slovakia: NTNU. Kanemoto, K., D. Moran, M. Lenzen, and A. Geschke. 2014. International trade undermines national emission reduction targets: New evidence from air pollution. Global Environmental Change 24: 52–59. http://linkinghub.elsevier.com/retrieve/ pii/S095937801300160X. Accessed 27 October 2014. Kerkhof, A. C., S. Nonhebel, and H. C. Moll. 2009. Relating the environmental impact of consumption to household expenditures: An input-output analysis. Ecological Economics 68(4): 1160–1170. http://linkinghub.elsevier.com/retrieve/pii/S0921800908003595. Accessed 12 July 2014. Lee, H. 2008. The combustion-based CO2 emissions data for GTAP Version 7 database. Taipei, Taiwan: Department of Economics, National Chengchi University. Lenzen, M., M. Wier, C. Cohen, H. Hayami, S. Pachauri, and R. Schaeffer. 2006. A comparative multivariate analysis of household energy requirements in Australia, Brazil, Denmark, India and Japan. Energy 31(2–3): 181–207. http://linkinghub. elsevier.com/retrieve/pii/S0360544205000113. Accessed 11 October 2014. Munksgaard, J. and K. A. Pedersen. 2001. CO2 accounts for open economies: Producer or consumer responsibility? Energy Policy 29(4): 327–334. http://linkinghub.elsevier.com/retrieve/ pii/S0301421500001208. Accessed 13 October 2015. Peters, G. and E. Hertwich. 2008. CO2 embodied in international trade with implications for global climate policy. Environmental Science & Technology 42(5): 1401–1407. Peters, G. P. and E. G. Hertwich. 2006. The importance of imports for household environmental impacts. Journal of Industrial Ecology 10(3): 89–109. http://doi.wiley.com/10.1162/jiec.2006.10.3.89. Accessed 13 October 2015. Peters, G. P., J. C. Minx, C. L. Weber, and O. Edenhofer. 2011. Growth in emission transfers via international trade from 1990 to 2008. Proceedings of the National Academy of Sciences of the United States of America 108(21): 8903–8908. www.pubmedcentral.nih.gov/articlerender.fcgi?artid =3102371&tool=pmcentrez&rendertype=abstract. Accessed 18 October 2014. SNA. 2008. System of National Accounts. http://unstats.un.org/ unsd/nationalaccount/docs/SNA2008.pdf. Accessed 13 October 2015. Stadler, K., K. Steen-Olsen, and R. Wood. 2014. The “Rest of the World”—Estimating the economic structure of missing regions in global multi-regional input-output tables. Economic
Systems Research 26(3): 303–326. www.tandfonline.com/doi/abs/ 10.1080/09535314.2014.936831. Accessed 11 March 2015. Steen-Olsen, K., J. Weinzettel, G. Cranston, A. E. Ercin, and E. G. Hertwich. 2012. Carbon, land, and water footprint accounts for the European Union: Consumption, production, and displacements through international trade. Environmental Science & Technology 46(20): 10883–10891. www.ncbi. nlm.nih.gov/pubmed/23013466. Accessed 13 October 2015. Steen-Olsen, K., R. Wood, and E. G. Hertwich. 2016. The Carbon Footprint of Norwegian household consumption 1999– 2012. Journal of Industrial Ecology 20(3): 582–592. Su, B. and B. W. Ang. 2010. Input-output analysis of CO2 emissions embodied in trade: The effects of spatial aggregation. Ecological Economics 70(1): 10–18. http://linkinghub.elsevier. com/retrieve/pii/S092180091000340X. Accessed 6 March 2015. Tukker, A., T. Bulavskaya, S. Giljum, A. De Koning, S. Lutter, M. Simas, K. Stadler, and R. Wood. 2014. The global resource footprint of nations: Carbon, water, land and materials embodied in trade and final consumption. http://creea.eu/index. php/documents2/cat_view/16-creea-booklet. Accessed 13 October 2015. Tukker, A., M. J. Cohen, K. Hubacek, and O. Mont. 2010. The impacts of household consumption and options for change. Journal of Industrial Ecology 14(1): 13–30. http://doi.wiley. com/10.1111/j.1530-9290.2009.00208.x. Accessed 23 July 2014. Tukker, A. and B. Jansen. 2006. Environmental impacts of products: A detailed review of studies. Journal of Industrial Ecology 10(3): 159– 182. http://doi.wiley.com/10.1162/jiec.2006.10.3.159. Accessed 13 October 2015. Tukker, A., A. de Koning, R. Wood, T. Hawkins, S. Lutter, J. Acosta, J. M. Rueda Cantuche, et al. 2013. EXIOPOL— Development and illustrative analyses of a detailed global MR EE SUT/IOT. Economic Systems Research 25(1): 50–70. www. tandfonline.com/doi/abs/10.1080/09535314.2012.761952. Accessed 13 July 2014. Vewin. 2012. Dutch drinking water statistics. www.vewin.nl/SiteCollectionDocuments/Publicaties/English _publications/Vewin_ Dutch_Drinking_water_statistics_2012.pdf. Accessed 13 October 2015. Vickers, A. 2001. Handbook of water use and conservation. In Handbook of water use and conservation: Homes, landscapes, businesses, industries, farms. Amherst, MA, USA: WaterPlow. Wackernagel, M. and W. Rees. 1996. Our ecological footprint: Reducing human impact on the Earth. Gabriola Island, British Columbia, Canada: New Society. Weber, C. L. and H. S. Matthews. 2008. Quantifying the global and distributional aspects of American household carbon footprint. Ecological Economics 66(2–3): 379–391. http://linkinghub.elsevier. com/retrieve/pii/S0921800907004934. Accessed 16 July 2014. Weinzettel, J., E. G. Hertwich, G. P. Peters, K. Steen-Olsen, and A. Galli. 2013. Affluence drives the global displacement of land use. Global Environmental Change 23(2): 433–438. http://linkinghub. elsevier.com/retrieve/pii/S0959378012001501. Accessed 10 July 2014. Wiedmann, T. and J. Minx. 2008. A definition of “carbon footprint.” In Ecological economics research trends: Chapter 1, pp. 1–11. Hauppauge NY, USA: Nova Science. www.censa.org.uk/docs/ISAUK_Report_07-01_carbon_footprint.pdf. Accessed 13 October 2015. Wiedmann, T., R. Wood, J. C. Minx, M. Lenzen, D. Guan, and R. Harris. 2010. A carbon footprint time series of the
Ivanova et al., Environmental Impact Assessment of Household Consumption
535
R E S E A R C H A N D A N A LY S I S
UK—Results from a multi-region input-output model. Economic Systems Research 22(1): 19–42. www.tandfonline.com/ doi/abs/10.1080/09535311003612591. Accessed 13 July 2014. Wiedmann, T. O., H. Schandl, M. Lenzen, D. Moran, S. Suh, J. West, and K. Kanemoto. 2015. The material footprint of nations. Proceedings of the National Academy of Sciences of the United States of America, 112(20): 6271–6276. www.ncbi.nlm.nih. gov/pubmed/24003158. Accessed 10 July 2014. Wood, R., K. Stadler, T. Bulavskaya, S. Lutter, S. Giljum, A. de Koning, J. Kuenen, et al. 2015. Global sustainability accounting— Developing EXIOBASE for multi-regional footprint analysis. Sustainability 7(1): 138–163. Wyckoff, A. W. and J. M. Roop. 1994. The embodiment of carbon in imports of manufactured products: Implications for international agreements on greenhouse gas emissions. Energy Policy 22(3): 187–194.
About the Authors Diana Ivanova is a Ph.D. candidate, Konstantin Stadler is a senior researcher, Kjartan Steen-Olsen is a researcher, Richard Wood is a senior researcher, and Gibran Vita is a researcher, all at the Industrial Ecology Programme at the Norwegian University of Science and Technology (NTNU) in Trondheim, Norway. Arnold Tukker is a professor and the director of the Center for Environmental Science of Leiden University in Leiden, the Netherlands. Edgar Hertwich was the director of the Industrial Ecology Programme and a Professor at the Department of Energy and Process Engineering at NTNU at the time this article was written. He is now a professor in the School of Forestry and Environmental Studies at Yale University, New Haven, CT, USA.
Supporting Information Additional Supporting Information may be found in the online version of this article at the publisher’s web site: Supporting Information S1: This supporting information provides information about household environmental footprints including total and per capita absolute values across countries and RoW regions and consumption categories; information about total household expenditure, population, and national GDP (purchasing power parity; PPP); version of figure 2 depicting all 43 countries; and further description of the database.
536
Journal of Industrial Ecology