Energies 2011, 4, 845-877; doi:10.3390/en4060845 OPEN ACCESS
energies ISSN 1996-1073 www.mdpi.com/journal/energies Review
Environmental Impacts and Costs of Hydrotreated Vegetable Oils, Transesterified Lipids and Woody BTL—A Review Kathrin Sunde 1,⋆ , Andreas Brekke 2 and Birger Solberg 1 1
Department of Ecology and Natural Resource Management, Norwegian University of Life Sciences, ˚ Norway; E-Mail:
[email protected] Sørhellinga, Høgskoleveien 12, 1430 As, 2 Østfoldforskning AS, Gamle Beddingv. 2B, 1671 Kr˚akerøy, Norway; E-Mail:
[email protected] ⋆
Author to whom correspondence should be addressed; E-Mail:
[email protected]; Tel.: +47-64965759; Fax: +47-64965001.
Received: 1 February 2011; in revised form: 30 March 2011 / Accepted: 19 May 2011 / Published: 25 May 2011
Abstract: This article reviews and compares assessments of three biodiesel fuels: (1) transesterified lipids, (2) hydrotreated vegetable oils (HVO), and (3) woody biomass-to-liquid (BTL) Fischer-Tropsch diesel and selected feedstock options. The article attempts to rank the environmental performance and costs of fuel and feedstock combinations. Due to inter-study differences in goal and study assumptions, the ranking was mostly qualitative and intra-study results are emphasized. Results indicate that HVO made from wastes or by-products such as tall oil, tallow or used cooking oil outperforms transesterified lipids and BTL from woody material, both with respect to environmental life cycle impacts and costs. These feedstock options are, however, of limited availability, and to produce larger volumes of biofuels other raw materials must also be used. BTL from woody biomass seems promising with good environmental performance and the ability not to compete with food production. Production of biofuels from agricultural feedstock sources requires much energy and leads to considerable emissions due to agrochemical inputs. Thus, such biodiesel fuels are ranked lowest in this comparison. Production of feedstock is the most important life cycle stage. Avoiding detrimental land use changes and maintaining good agricultural or forestry management practices are the main challenges to ensure that biofuels can be a sustainable option for the future transport sector.
Energies 2011, 4
846
Keywords: biodiesel; HVO; BTL; biofuels; LCA; bioenergy; forestry; energy; security; climate; mitigation; transport
1. Introduction Biofuels is the common name for a large portfolio of fuels produced from biomass. Although some biofuel critics regards biofuels for climate mitigation purposes as a dead end, biofuels are also regarded as contributors to energy security in order for future societies to be less reliant on (import of) fossil resources [1]. The fossil reserves are unknown, but estimates claim that peak oil will occur somewhere between 2008 and 2040 [2,3]. The longevity of the reserves depends on usage rate, technology development and economy. Furthermore, a few oil and gas producing countries possess a large share of the total oil and gas production in the world, with consequences for both access to energy and distribution of wealth. Biofuels are thus also promoted as a means to create rural development and improve trade balance [4,5]. In a resource perspective, biofuels cannot be the sole solution to the future transport sector, simply because the world cannot produce enough biomass to both feed and transport mankind without compromising sustainability, but they can represent a part of the solution. According to Smeets et al. [6], with improved agricultural technology and geographically optimized use of land, the land area needed for food production can be reduced by 72%, hence releasing more area for other purposes. In a biomass resource assessment it was estimated that biomass could supply between 20%–50% of the transport demand in 2030 in EU27 [7,8]. In an environmental perspective, the promotion of biofuels have trade-offs in terms of land and water use, competition for food resources, reduction of biodiversity and impacts related to other pollutants than greenhouse gas (GHG) emissions. As the biofuel discussion is mostly triggered by climate mitigation goals and reduction of GHG emissions, the expansion of native feedstock production for biofuels have been criticized for not taking into account impacts related to direct and indirect land use changes. Soil carbon emissions may create a carbon debt (i.e., GHG emissions which may eventually be accumulated in new biomass), with payback times potentially exceeding the climate mitigation goals [9]. Therefore, the EU renewable energy directive and EU fuel quality directive [10,11] sets environmental requirements for biofuels for the future, namely that biofuels must demonstrate at least a 35% reduction in GHG emissions and must not impose damage to sensitive ecosystems. Life cycle assessment (LCA), a tool for assessing the environmental impacts from products and services, is under development to integrate the complex issue of soil emissions, and LCAs undertaken up to date demonstrate that biofuels done right may have benefits for the environment, but also that biofuels done wrong, may have negative impacts on the environment. Moreover, one may question whether biomass for biofuel purposes is the best use of the limited biomass resources, in a climate mitigation perspective, as alternative uses of the biomass have greater climate mitigation potential. Decision-makers responsible for regulations or investments in biofuels need input on the environmental and financial viability of biofuels. The main objective of this article is to provide a literature review in order to rank three kinds of biodiesel fuels, namely transesterified lipids,
Energies 2011, 4
847
biomasss-to-liquid (BTL) and hydrotreated vegetable oils (HVO), combined with selected feedstock sources in an environmental and cost perspective. The three chosen fuel types can be made from different feedstocks with large variations in environmental characteristics and costs. The study is limited to a selection of current feedstocks relevant for northern Europe. This implies that many relevant and promising future (non-edible) feedstock options are excluded, such as jatropha and algae. The perspective of the article is to determine, if possible, which of the chosen biodiesel and feedstock combination will be most viable, and not to determine whether biofuel is the most viable use of biomass. Therefore, alternative biomass sources are explored, but alternative uses of the biomass is outside the scope of the article. In order to make informed choices about which biodiesel technology and feedstock combination to possibly pursue, their performance will be presented parallel to statistics on resource availability to indicate their potential to fulfill fuel needs of the future. A biofuel made from a waste resource may, for instance, show good environmental properties and low costs, but still be present in such low quantities that its presence in the market becomes negligible. Moreover, some biodiesel feedstock sources may have higher GHG emissions compared to fossil fuels. Biodiesel with such characteristics do not meet one of the main criteria for substituting fossil fuels. The next section describes how the study is undertaken with a overview of chosen fuel and feedstock sources. Thereafter, the results of the feedstock and fuel ranking, together with numbers on fuel costs and feedstock availability, are presented in Section 3, where also the results are discussed, with a special emphasis on the complex issue of climate change. Finally, concluding remarks are presented in Section 4. 2. Methodology: Dimensions and Sources for Comparison The goal of the study is to compare and rank three biodiesel fuel technologies that are available in the short and medium term and combine them with the best feedstock options available in the short and medium term, based on environmental assessments presented in literature. Biodiesel fuels were chosen due to the fact that diesel engines have a more favorable fuel economy than petrol fuels as compression ignition is far superior to spark ignition in a fuel efficiency perspective. This may prove important for a future transport sector with limited resource access. Furthermore, a diesel deficit is expected in Europe by 2015 [12], and the development of viable alternative diesel fuels may also prove important for a European diesel fuel sector in urgent need for diesel refinery upgrading. However, diesel engines have demonstrated tailpipe emission drawbacks compared to gasoline motors, and local air pollution (due to N Ox emissions) may be a problem connected to the expanded use of diesel engines. Easily igniting compounds such as straight chain hydrocarbons (paraffins) are preferred in diesel motors [13]. HVO and BTL are paraffinic diesel fuels with several fuel advantages over transesterified lipids. HVO and BTL have higher cetane number, implying easier ignition and more efficient combustion, lower cloud point, better storage stability, better cold properties, less tailpipe N Ox emissions, have higher renewability fraction of the fuel (97%–98% renewable mass inputs versus 90% renewable mass inputs of transesterified lipids) and can theoretically be used in existing vehicles up to 100%, but in order to fulfill EN590, up to 30% can be blended into diesel [14], compared to only 7% of transesterified lipids. A drawback for HVO is that lubricity is poorer [5].
Energies 2011, 4
848
The three fuels have different properties such as lower heating values, and in production the fuel yield vary considerably, as shown in Table 1. Table 1. Fuel properties [15–18].
Fuel composition Typical Volumetric yield (%) Typical Mass yield (%) Density (kg/L) Lower heating value (MJ/kg) Cetane number By product yield (mass)
HVO Alkanes 88–99 75–85 0.78 44 70–90 5–14%
Transesterified Lipids Esters 100 96 0.88 37–38 50–65 10%
BTL Alkanes 12–22 (wet input-30%) 0.77 44 >75 1–13%
Transesterified lipids are produced in a process where lipids and alcohol (typically methanol, but also ethanol) are blende with a catalyst (acid, base or enzyme), and fatty acid methyl ester (FAME) or fatty acid ethyl ester (FAEE) are formed. Glycerol is a byproduct [19]. Inputs are oils, fats or fatty acids, steam, electricity, catalyst and methanol [19,20]. The fuel quality depend on the parent oil or fat, the fraction of unsaturated fatty acids versus saturated fatty acids and the length of the fatty acid chain [21]. The environmental impacts from using so-called transesterified lipids from vegetable oils have been discussed for a while, and second generation biofuels from lignocellulosic biomass have been launched as an even better alternative for the transport sector, as this does not compromise food production, have lower feedstock production impacts and higher fuel quality. BTL is produced via Fischer–Tropsch (FT) synthesis, where lignocellulosic materials such as wood is turned into fuel via gasification. The product gas is then cleaned and processed to form synthesis gas. The synthesis gas is then converted into long-chain hydrocarbons with the FT synthesis. Hydrocracking or hydrotreatment is required as a final refining step to produce the desired fuel. The process yield significant amounts of byproduct energy, and fuel energy yield is therefore relatively low (45%–60%). The mass fuel yield per mass input is low compared to the two other biofuels considered. The process is still in early stages of development and there are no commercial scale production plants established in Europe due to high plant investment costs, but several companies have launched interest in producing BTL from wood. While profitability of BTL is investigated, HVO has been introduced as a feasible alternative to make high quality (paraffinic), high cetane biofuels from the same lipid feedstocks used for transesterified lipid production. HVO is a range of petrodiesel-like (paraffinic) fuels derived from biological sources, where double bonds and oxygen are converted to hydrocarbons by saturation of the double bonds and removal of oxygen (decarboxylation, decarbonylation, dehydration) [22]. The reaction may require hydrogen, and saturated fats requires less consumption of hydrogen than unsaturated fats. Byproducts are light petroleum gas, propane and naptha that can be used internally for energy production. The main constituent of such petrodiesel-like fuels are alkanes. At present, HVO is produced in several countries, such as Finland (Neste Oil), Sweden (SunPine), Ireland (Conoco Phillips), Australia (British Petroleum) and Italy (UOP/Eni Ecofining). Transesterified lipids and HVO may employ the same feedstock sources. There are several feedstock candidates, but here restricted to rapeseed, palm oil, tallow, used cooking oil (waste oil) and tall
Energies 2011, 4
849
oil. Rapeseed can be cultivated in Northern Europe and is the most popular crop for transesterified lipids production in Europe. In addition, palm oil from Asia (Malaysia or Indonesia) is included as a possible feedstock. Tall oil, used cooking oil and tallow are wastes or byproducts that can be used for transesterified lipids and HVO production instead of higher priced refined vegetable oils. These feedstock sources have higher amounts of so-called free fatty acids and water, and may need pre-treatment before processing. For BTL production, different kinds of wood material can be used, hence BTL is different from the two other fuels with respect to feedstock. It is important to emphasize that results for BTL production are preliminary since the technology is still in early stages. There are few studies comparing all three biofuels scrutinized here, and most studies compare only two of the fuels. No studies included all the chosen fuels and feedstock combinations. The ranking of the biodiesel fuels is mainly qualitative, based on individual studies where either different biofuel technologies or feedstock options are compared in several dimensions. Some studies compare only one fuel technology with different feedstocks, and from these studies a feedstock ranking can be attempted. Other studies compare technologies, and from these studies a technology ranking can be attempted. Combining information from these two kind of studies can give an indication on the best feedstock and fuel technology combination. As the feedstock has the greatest influence on the environmental feasibility, the studies that compare technologies cannot be solely used for the benchmarking. Furthermore, the availability and economic feasibility of a specific feedstock will be an important criterion when opting for a specific biofuel, and may limit the attractiveness of a specific biodiesel and feedstock combination. Even if individual studies differ in important methodological aspects such as goal of the study and choice of system boundaries, which may reduce the reliability of inter-study comparisons, a numerical comparison of GHG emissions across studies has been attempted. Many LCA studies report GHG emissions, energy use and possible savings in total and non-renewable energy, and it is demonstrated that different energy indicators correlates well with most environmental life cycle impact categories [23]. Where studies lack a full range of environmental indicators, the GHG and energy balances will have to serve as proxy measures for the environmental performance of the different fuels in order to perform a ranking. The fossil energy use does not correlate well with impacts due to land use, land use changes and toxicity impacts that may be important in biological systems, and detailed LCA studies are preferable. In the results section, GHG emissions are in focus, but other impacts are also reported. There are, however, reasons to be concerned whether GHG emission savings from substituting biofuels for fossil fuels come at the expense of other environmental impacts such as acidification and eutrophication. Moreover, no matter how environmentally friendly a product is, the market will not respond if the retail price is too high compared to alternatives. Hence, costs are important to reveal in order to secure that a specific biofuel and feedstock combination is a viable alternative. Production systems often lead to generation of co-products, waste and by-products. This creates difficulties in allocating and assigning environmental loads to the outputs of the system and introduces complications in life cycle assessments. The definitions of byproduct, co-product and waste may differ from study to study. A co-product is generally considered a product produced along with the main product in comparable value as the main product. A byproduct is a product with lower economic value than the main product. Waste is defined as an output with little or no economic value and may turn into a byproduct if its economic value increases. Regarding life cycle assessment, the definitions are
Energies 2011, 4
850
very important as a waste is often considered free of environmental charges, while for byproducts and co-products it is common to allocate the environmental burdens between different non-waste output streams. Byproducts and wastes may be recycled within the same production system, often referred to as close-loop recycling, or they may be recycled in alternative production systems, referred to as open-loop recycling. The latter alternative introduces difficulties in determining the quality of the raw material and whether it is able to replace virgin materials. The assessment was undertaken as follows: First, the chosen feedstocks (palm oil, rapeseed oil, tallow, used cooking oil/waste oils and tall oil) for transesterified lipids and HVO were qualitatively ranked. Then transesterified lipids and HVO technologies were qualitatively compared based on the few LCA studies that compare these fuels. Next, studies that include woody BTL were compared to results for HVO and transesterified lipids. Lastly, an overview of GHG emissions per MJ of reported fuel and feedstock combinations is presented, as well as fuel costs. 3. Results and Discussion 3.1. Feedstock Comparison and Ranking In this section, ranking and comparison of the feedstock sources used for transesterified lipids and HVO production are attempted, based on available information in LCA studies that compares the same biofuels from different feedstock sources. Table 2 displays how a range of studies ranks different feedstock options for the production of transesterified lipids and HVO. Studies vary with respect to which feedstock sources they assess and which environmental impacts they cover. Table 2. Qualitiative ranking of feedstocks based on LCA studies that rank different feedstocks. Study [14]
Year 2010
[24]
2010
[25]
2007
Indicator GWP Total Energy Use Fossil Energy Use Acidification Eutrophication Ozone Depletion Acidification Eutrophication Photochemical Smog Land Use GWP Biodiversity GHG UBP 06 Non Renewable Energy Smog Eutrophication Ecotoxicity Acidification Respiratory Diseases Eco Indicator 99 Land Use
Rape oil 2 2 2 1 2 2 2 2 2 2 2 Scenario dependent 3 3 Similar 2 3 2 3 2 3 2
Palm oil 1* 1* 1* 2 1* 1 1 1 1 1 (in 3 of 5 scenarios) 1 (in 4 of 5 scenarios) Scenario dependent 2 2 Similar 3 2 3 2 3 2 3
Tallow
Tall oil
Waste oil
1 1 1 1 1 1 1 1 1 1
Energies 2011, 4
851
Table 2. Cont. Study [26]
Year 2009
[18,27]
2008
[28]
2009
[29]
2008
[30] [31]
2004 2010
[32] [33] [34]
2007 2010 2010
Indicator Net energy yield/ha GHG GHG Fossil energy use Cumulative energy demand GHG Energy use GHG Fossil energy use Total energy use Footprint Energy Demand GHG GHG GHG GHG Primary Energy Saving
Rape oil 2 2 2 or 3 3 2 2 2 Allocation dependent Allocation dependent 2 3
4 2 2 2
Palm oil 1 1 2 or 3 2 3
Tallow
Tall oil
Waste oil
1 1 1 1 1
Allocation dependent Allocation dependent 3
2* 1* 1 1
1 1 1 2 2 2 3
1 1 1 1
Waste feedstock sources ranks better than native feedstock options due to small upstream impacts, and used vegetable oil performs better than tallow since tallow production includes one more step in terms of the rendering process, which is accountable for about 30%–50% of the total CO2 emissions form tallow transesterified lipids [31,44]. In an LCA, it must be decided whether tallow is a waste or byproduct from agriculture [29–31,45]. If livestock production is included, the net energy ratio will be lower than 1, and as much as 80% of the total energy consumption may be traced back to livestock production [46]. With system boundaries where animal leftovers are free of environmental load, the net energy ratio of tallow is 3.5–5.7 [45,46]. For waste cooking oil (typically oily residues from catering establishment, restaurants, industry and domestic houses [41,47]), the overall energy demand is low and related to collection of the oils and pretreatment. Pretreatment of used cooking oil only accounts for 3% of the total GHG emissions of transesterified used cooking oil [31]. Using lipid waste materials for fuel production is a case of open-loop recycling. Land use and biodiversity effects using waste oil are small or positive, as waste oil usage prevents the expansion of native oil production and avoids waste handling of fat. One study has reported findings that tall oil (a fatty acid byproduct that can be extracted from the black liquor of the pulp Kraft process) is environmentally preferable to rapeseed in an energy and GHG perspective [28], with GHG emissions from transesterified tall oil being only 5%–20% of those from production of transesterified rapeseed oil. As seen in Table 3, the ranking based on GHG emissions makes tall oil the most feasible feedstock, followed by used vegetable or cooking oil. Since tall oil is a byproduct or waste from the main process of pulp production, tall oil only carries the environmental loads related to the treatment of black liquor. All environmental loads related to previous operations such as forestry etc. are allocated to the main product. One could also allocate a fraction of the total environmental loads from the pulp to black liquor according to mass, energy or economic value since tall oil have a market value. The tall oil will then carry a part of the environmental loads related to forestry. For used vegetable or cooking oil, the transesterification process contributes to 68% of GHG emissions [41] and one could assume that tall oil and used vegetable oil processing would be in the same
Energies 2011, 4
852
order. The pretreatment of these two feedstock sources is probably also in the same order [48], and the difference in impacts lies in the raw material impacts they carry. Used cooking oil is considered a waste in most studies. Tall oil (fatty acids) may have very low or even negative impacts due to allocation of impacts over all product fractions from black liquor or crude tall oil. For fuels from refined vegetable oils such as rapeseed and palm oil, the largest share of energy consumption (up to 90%) lies in the production of feedstock [49], and GHG emissions are mostly due to soil emissions and fertilizer production [50]. N2 O emissions from soil account for more than half of the GHG emissions of HVO [14] from native feedstock sources. The ranking between the native feedstocks demonstrates that palm oil mostly performs better than rapeseed oil. Palm oil cultivated with best practice on fallow or degraded land without soil carbon losses may have favorable environmental profile compared to other vegetable oils due to high oil yields [51]. Rapeseed oil may however perform better in cases where palm oil production is related to high soil carbon emissions or when the palm oil production processes are not environmentally optimized. The rapid increase in demand for palm oil has resulted in clearing of rainforests to establish palm oil plantations with ecological impacts due to loss of rainforest biodiversity and pollution [52]. Clearing of rainforests or usage of peaty soil for palm oil production may create large soil carbon debts that may take decades to pay off [53,54]. Moreover, the use, handling and allocation of palm oil by-products such as press cake, palm oil mill effluent, palm kernel oil and mulch also determines the overall environmental performance of palm oil. Palm oil mill effluent can severely pollute water and the internal energy production from simple combustion of waste and residues often exceed local air pollution limits [29,55]. Landfilling and anaerobic degradation of process waste should be avoided and used for clean internal energy production instead [14,24,56,57]. Rapeseed scores high on a ranking of nitrogen input for bioenergy crops [58], and nitrogen input is important for the rapeseed yield. Increased N fertilization may however outweigh the GHG and energy gains from increased yield [59] and add to other impacts. Using rape straw for energy production will greatly enhance the environmental feasibility of rapeseed as feedstock [38], but will increase the need for fertilizer. The chosen allocation method between main products and byproducts is very important for the overall environmental performance of rapeseed oil [38,39,42,60]. As an example, allocation by energy content attributes almost half the greenhouse gas emissions to rape cake (a co-product) and thereby improves the GHG emissions profile of transesterified rapeseed oil [38]. It is demonstrated that without allocation of environmental burdens to co-products, the production of transesterified rapeseed oil will have an unfavorable energy balance [49]. Table 3 shows GHG emissions from producing transesterified lipids from the chosen feedstock sources, and demonstrates that waste feedstock sources such as used cooking oil, tall oil and tallow have a lower GHG emissions than the virgin vegetable oils, where all upstream impacts are included. Including woody BTL in the comparison, the GHG emissions ranges for biofuels produced from used cooking oil, tall oil fuels overlap to a certain extent with woody BTL. Transesterified tall oil have the narrowest range including the lowest emissions, while BTL and transesterified used cooking oil show similar performance in GHG emissions. Lastly, there are studies that report that some native feedstocks may not be suitable for transesterified lipids or HVO production in a GHG perspective, due to overall larger GHG emissions than fossil diesel. Both palm oil and rapeseed production practices can in some
Energies 2011, 4
853
cases contribute to more GHG emissions compared to fossil diesel [33,54,56,61] due to land use changes and high emissions of N2 O. Table 3. Comparison of GHG emissions (CO2 emissions (g)) from producing 1 MJ of transesterified lipid and BTL from different feedstock sources.
Reference [11] [35] [36] [18] [37] [28] [30] [29] [25] [26] [38] [31] [39] [40] [41] [27] [42] [33] [34] [43] Range
Year
Woody BTL
2008 2008 2009 2009 2009 2004 2008 2007 2009 2010 2010 2004 2003 2010 2008 2008 2010 2006 2009
30 18 8 10
Transesterified Tall Oil
Transesterified Rapeseed Oil
Transesterified Palm Oil
Transesterified Tallow
Transesterified Used Cooking Oil
Fossil Diesel 83.8
2–9
44 18 33–74 50–70 62 48
34–49 45 39
16–68 *** 10–15
35–54 31–88 39–43 40–45 60–65 55–100 30–60 **
23–26 11–15 8
30–55
7–20
30–698 **** 23–38 *
5–25 8–30 2–9 30–100 23–698 16–68 7–26 * Excluding land use changes; ** HVO; *** No allocation; **** Land use changes included.
83.8
3.2. Fuel Technology Ranking In the previous section, feedstock sources were ranked and in this section transesterified lipids are compared to HVO and woody BTL, regardless of feedstock, in order to rank the technologies. First HVO is compared to transesterified lipids. Then, woody BTL, from different woody resources, is compared to transesterified lipids and HVO. 3.2.1. Ranking of Transesterified Lipids vs. HVO In this section we have compared the fuel production technology for HVO vs. transesterified lipids by assessing studies that compare these. The two biodiesel fuels can be produced from the same feedstock sources, but there are differences in processing of the feedstock. The main differences in the environmental performance between these fuels can be found in the production process and in the fuel quality, but also in byproducts. While transesterified lipids have glycerin as a byproduct, the HVO have energy products as byproducts, and the preferable allocation method may be different for these two fuels. Table 4 displays the results and ranking from the studies that compare transesterified lipids and HVO.
Energies 2011, 4
854
According to Huo et al. [20], transesterification has larger input of energy and chemicals than HVO production, but gives a slightly lower energy yield. Two studies [21,22] explain that the energy balance between transesterified lipids and HVO mostly depend on the difference in production of hydrogen for HVO and alcohol and catalyst for transesterified lipids. Highly saturated fatty feedstock sources (such as tallow and palm oil) require less hydrogen than more unsaturated feedstock options (such as rapeseed). Both hydrogen and alcohols can be very energy intensive in production, and the renewability fraction of the final fuels depend on the feedstock used to synthesize these two materials, as they can be produced from both renewable and fossil feedstock sources. In one of the studies that compare transesterified lipids and HVO [22], the major environmental difference between the fuels was found in the production of methanol from natural gas. According to Kalnes et al. [62], fossil energy use in HVO production can be reduced by producing H2 from byproducts instead of a fossil resource. Alkanes have higher heat of combustion than esters, and this justifies that HVO may require more feedstock in processing, which is again offset by the higher energy content in the fuel. Transesterified lipid processing may thus have slightly higher mass yields than HVO, depending on which transesterification method that is used [18]. In Kalnes et al. [18,27], HVO show lower fossil energy consumption and lower GHG emissions over the life cycle compared to transesterified lipids. In Huo et al. [20], the ranking between transesterified lipids and HVO was so dependent on allocation method and technology choices that no clear winner appeared in the impact categories GWP (global warming potential), total energy and fossil energy use. Arvidsson et al. [14] mainly ranked feedstock sources, but also made an effort to compare technologies across different studies. However, they did not manage to produce clear results, due to large differences in N2 O and soil emission and allocation assumptions between the different studies. Overall, from the studies reviewed in Table 4, there are indications that HVO performs better than transesterified lipids when assessing the same feedstock, and the fuel quality may be the greatest advantage of HVO over transesterified lipids. This is also claimed by Neste Oil [63], who states better GHG performance for HVO than transesterified lipids from the same feedstock, also supported by Marker et al. [64]. Other studies claim similar performance of transesterified lipids and HVO [5]. 3.2.2. Ranking of BTL vs. Transesterified Lipids and/or HVO In this section we have included studies that assess woody BTL, in order to compare and rank the environmental feasibility of woody BTL to the other fuel and feedstock combinations. We have already seen that from a certain lipid feedstock, the preferable fuel technology is likely HVO, and waste feedstock sources are likely preferable to a native feedstock, and it is of interest to rank woody BTL among the other fuel and feedstock combinations. Table 4 shows the ranking results from the studies reviewed.
2009
2010
2007
2007
2008
2010 2010
2008
[18]
[14]
[22]
[62]
[35]
[65] [33]
[27]
Rape/Palm/Tallow
Soy Rape/Palm
Different
Soy
NA
Palm and Rape
Rape
Feedstock Soy
NA
Displacement
Displacement and allocation
Allocation Displacement and allocation
Cradle to grave
System boundary
Indicator Total Energy Fossil Energy Use GHG CED Fossil energy savings GHG GHG savings per ton feedstock GHG Fossil energy use Total Energy Use Acidification Impact points GHG Total Energy Demand Fossil energy Demand GHG GWP UBP 06 ** EI99 *** GWP GWP
Transesterified Lipids No clear winner No clear winner No clear winner 2 3 3 2 2 1 2 1 2 2 No clear winner 2 2 1 (UCO), 3 (palm and rape oil) 1 (UCO), 3 (palm and rape oil) 1 (UCO), 3 (palm and rape oil) 2 1 2 (palm and rape oil)
HVO No clear winner No clear winner No clear winner 1 2 2 1 3 2 1 2 1 1 No clear winner 1 1
BTL NA NA NA 3 1 1 3 1 NA 3 NA NA NA NA NA NA 2 (forest wood) 2 (forest wood) 2 (forest wood) 1 NA 1
GWP**** 2 1 Cumulative energy demand 2 1 [64] 2005 NA Single score 2 1 CO2 emissions 2 1 * Technology and allocation dependent results; ** UBP06 is an LCA weighing method also called Ecological Scarcity 06; *** EI99 means Eco Indicator 99, which is an LCA impact assessment method; **** GWP means global warming potential.
Year 2008
Study [20] *
Table 4. Ranking of transesterified lipids vs. HVO vs. BTL.
Energies 2011, 4 855
Energies 2011, 4
856
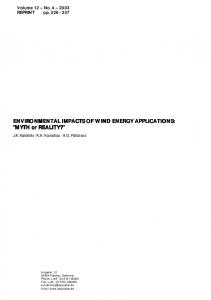
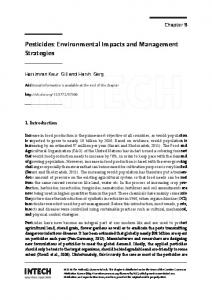
Jungbluth et al. [35] compared BTL from forest wood and BTL from short rotation forestry with transesterified lipids from used cooking oil and pure vegetable oils and found that transesterified used cooking oil performed better than woody BTL regarding GHG emissions and two aggregated environmental indicators. BTL from forest wood (not short rotation forestry) scored better than transesterified lipids from native vegetable oils such as palm oil and rapeseed oil regarding both GHG savings and the aggregated indicators, as shown in Table 4. For some short rotation BTL routes, the impacts were higher than for transesterified lipids from palm oil and rapeseed oil. Wood feedstock impacts such as GHG emissions, acidification and aggregated impacts are the highest for short rotation forestry, followed by forest wood, and minimized by using woody waste [16,35,37]. Due to its byproduct or waste nature, forest residues (and thinnings) have a lower land use and soil organic carbon impact than most agricultural crops. In fact, forest residues as a feedstock may have 10 fold lower GWP, AP and EP impact than oilseed rape in in a feedstock production perspective [50]. For biofuel purposes, woody waste is a part of a cascade, where the woody material have already been used for its original purpose as material. Forest residues can also be regarded as a byproduct from forestry operations/industry with a fraction of the total environmental loads from forestry operations. BTL from woody waste performs better than both HVO and transesterified lipids from native feedstock sources in a GHG perspective (per MJ fuel produced) [18,63]. In a mass perspective though, producing a ton of HVO consumes much less biorenewable feedstock compared to woody BTL, with over twice the GHG savings as BTL syndiesel when calculated per ton of biorenewable feedstock [18,55], under the assumption that 1.2 ton of vegetable oil and/or tallow is needed for the production of 1 ton of HVO and that 2.5 ton (dry mass) of forest biomass is needed for the production of 1 ton of BTL. On the other hand, GHG savings per hectare are twice as high for BTL than for transesterified rapeseed oil [66]. For transesterified palm oil however, the picture could change, since the energy yield per hectare of palm oil is more than 3 times higher than for rapeseed oil [58,67]. Total energy use for transesterified lipids from pure vegetable oils (or HVO) and woody BTL is in the same order (3–4 MJ/km) [66]. Fossil energy input for transesterified lipids is reported to be 0.5–1 MJ/km, while for woody BTL the fossil energy input is in the range 0.02–0.09 MJ/km and makes the fossil energy fraction of total energy use very low, but this will depend on woody feedstock, whether a waste, from (semi) natural forest of from short rotation forestry. In conclusion, most woody BTL will likely perform better than both HVO and transesterified lipids from native feedstocks as shown in Figures 1 and 2, but when waste feedstocks are used for HVO or transesterified lipids production, the GHG impacts seems to be in the same order, as shown in Table 3. It should be noted that woody BTL impacts depend largely on whether a native forest, short rotation coppice or waste feedstock is used, but also due to the low fuel yield of the Fischer–Tropsch (FT) process, which ranks woody BTL lower than HVO and transesterified lipids from lipid waste feedstocks. Moreover, BTL is not a single process technology. There are several production processes under this label, with differences in yield and environmental performance [35,68].
Energies 2011, 4
857
Figure 1. GHG emission comparison between fossil diesel, transesterified lipids, HVO and woody BTL [18]. GD = HVO; RSO = Rapeseed Oil; SBO = Soybean oil; Biodiesel = Transesterified lipids.
Figure 2. GHG savings per ton of feedstock when comparing the three technologies involved [18]. GD = HVO; Biodiesel = Transesterified lipids.
Using forest biomass for fossil fuel displacement is debated. Which strategy is the better, to use forest biomass to replace fossil fuels or to leave the forest standing to accumulate carbon in the biomass, depend on forest growth rate, fossil C displacement factor and the carbon balance time frame [69]. However, most studies show that the largest carbon benefits are obtained when using sustainably managed forest to substitute materials or fuels with high fossil carbon emission factors [70–72]. 3.2.3. Discussion of the Environmental Impacts of Biodiesel Fuels Production and use of biomass for biofuel production are associated with many complex environmental issues and trade-offs which is discussed in this section. Especially, there are inherent uncertainties in results for GHG emissions from production systems based on biomass, where three of them are discussed here. First, there are uncertainties related to the global warming potential (GWP) induced when imposing a land use change, both related to soil carbon emission issues and changes in biogeophysical forcings (immediate or short term chemical and physical effects of a land cover change, like albedo and heat fluxes). Second, nitrogen from fertilization may react to form N2 O, a
Energies 2011, 4
858
very potent climate gas, and estimating the amounts of N2 O emission from agricultural systems is not straightforward. Third, the payback time for carbon sequestration when harvesting biomass can be difficult to calculate or even include in assessment methods. 3.2.4. Climate Change Imposed by Land Use Changes Each soil or land type has a carbon-carrying capacity, and changing land use may release or accumulate carbon, which should be accounted for in a climate budget for biofuels. Disregarding these effects may give incorrect estimates of the climate change effects of producing biofuels. There are both direct and indirect land use changes, where the direct are those who are related to the specific production chain in question. Indirect effects, on the other, hand are controversial, debated and hard to estimate, as these are market mediated land use changes not related to the specific production chain in question [73]. IPCC has reported soil organic carbon values and vegetation carbon for different land types, which may be useful for estimation of carbon releases or carbon accumulation from a land transformation [74]. According to a review by Guo and Gifford [75], there are only a few land use changes that accumulates carbon in soil, and these are changing forests to pasture, changing crops to plantations, changing crops to secondary forests and changing crops to pasture. The reverse actions will likely release soil carbon until new equilibrium is reached. Peaty soils are not included in the Guo and Gifford study. The largest flux of carbon from land-use change is from conversion of natural ecosystems to cropland because a hectare of trees holds more carbon than a hectare of crops [76,77]. Clearing of forest for other land uses seems to have the largest impacts on total GHG emissions of all land use changes and should be avoided [78,79], but pasture land seem to be an exception, since the soil organic carbon stocks are often higher in grassland than in forest soils [75]. Any land use change disturbs the carbon equilibrium in the soil and vegetation, and high carbon losses or fluxes can be compensated by high annual carbon backflows (carbon uptake) [79]. The relationship between carbon loss (carbon debt) and carbon uptake determines the payback time of the carbon debt. According to Muller-Wenk and Brandao [79], a typical land use change with a short payback time (31 years) is transforming tropical forest to cropland, due to large backflow rates, while a long payback time (219 years) is estimated when boreal forests are being transformed to artificial land, due to small backflow rates. As a reference, fossil carbon is considered an average occupation time of 157 years in the atmosphere. If there are subsequent land transformation, the payback time can be prolonged. The climate change effect will then have to be allocated between the subsequent crops. Loss of soil carbon also degrades soil and water quality and reduces yield [80]. Soil quality however can be improved by environmentally benign methods as adding biochar to the soil [81] or using manure and sludge instead of artificial fertilizers. In addition, multi-cropping instead of monocultures as well as no-tillage practices can add positively to soil carbon. Production of oilseed rape releases soil carbon during production and use of the land. The extent depends on whether the straw is used for energy or tilled back into the soil, the extent of soil tillage and temperature. Removing the straw may increase soil carbon changes but these emissions may be offset by energy generation from straw [50]. Reijnders and Huijbregts [61] investigated the biogenic emissions from European rapeseed oil production and estimate that N2 O emissions per year contribute to 0.73 to
Energies 2011, 4
859
2.44 ton CO2 /ha and that total biogenic CO2 emission per year is in the range of 2.2 to 3.1 tons/ha. In comparison, the yearly fossil emissions in rapeseed oil lifecycle is 2.4 tons CO2 /ha [61]. Transforming native forests or peatland to palm oil plantations will create a carbon debt for the palm oil production that is in the order of decades to centuries [51,53,82] due to the release of 163–1300 tons of carbon per hectare [51,83]. Reijnders and Huijbregts [54] estimated the GHG effects of land use changes versus fossil energy use over the lifecycle of palm oil production. While fossil energy use contributed to approximately 1 ton CO2 per year per ton of palm oil, the GHG emissions from land use changes were in the range 1.4–5.6 tons CO2 per ton palm oil for aboveground carbon and 0.05–11.2 tons CO2 per year per ton palm oil for belowground carbon. The lowest estimates are when the timeframe is 100 years and the highest estimates are when the timeframe is 25 years, which is the lifetime (planting time) of a plantation. The largest belowground emissions comes form peaty soil. According to Fargione et al. [53], converting lowland tropical rainforest in Indonesia and Malaysia to palm transesterified lipids creates in a biofuel carbon debt of 610 Mg of CO2 /ha and a payback time of 86 years. Corresponding payback time for conversion of peatland to palm plantations is 840 years. Forests contain large parts of the carbon stored on land, in the form of aboveground biomass and soil organic matter. Changing forests to crop land decreases carbon stocks in soils and vice versa [75]. This means that establishment of short rotation woody crops on agricultural land will accumulate soil carbon. Forest land use changes and forests management regimes may release or sequester carbon and change carbon pools and fluxes. Land use changes in a forestry management context may imply increased logging, increased planting, afforestation, deforestation, denser planting, shorter or longer rotations, fertilization, removal of litter or thinning regime changes, etc. For instance, traditional thinning produces trees with wider stems but less biomass in total and changes in thinning regimes may affect total productivity and soil carbon. Harvesting and species mix also influences soil carbon [84,85]. Residues may increase the C stock and the logging disturb the soil structure which may leads to soil C loss. In a study on selected European forestry practices, Kowalski et al. [86] concluded that harvesting turned forests into a C sources. This is closely related to changes in rotation length which affect the long-term average amount of carbon in trees and soil due to litter generation and soil carbon disturbances. Clearcutting or not will also determine soil carbon content as well as removal or not of litter or slash. When assessing the local or regional feasibility of biofuels, it is of importance to assess which land use changes that takes place. For instance, changes in demand or production patterns may also introduce market induced indirect land use and production changes that add to the impacts. Indirect effects are hard to estimate, but can add to the overall impacts to such a degree that many biofuels turns out to be worse than fossil fuels. [9,87]. It is debated whether or not indirect land-use changes should be included in a climate budget for a specific agricultural product chain [73] as the mechanisms and assumptions behind are diverse. Ideally abandoned or degraded land should be used for expansion of crop production, but increased efficiency in existing agriculture may release the most land for bioenergy crops. Average European emissions from arable land is 0.84 tons C/ha year while conversions of arable land to grassland sequester 0.44 tons C/ha year [88]. In addition to potential carbon releases from soil, changing land cover may affect biogeophysical forcings such as the earths albedo, roughness and evapotranspiration. Changing albedo and evapotranspiration rates may affect local and regional climates. For instance, crops generally have
Energies 2011, 4
860
higher albedo and higher evapotranspiration than coniferous forests. Coniferous trees are half as reflective and have half the transpiration rate as broadleaf trees [89]. Increased albedo decreases surface temperature and leads to reduction in evapotranspiration. Reduction in evapotranspiration will leave more sensible heat to warm the surface again. Different regions respond differently to the balance between albedo and evapotranspiration, but in boreal regions the albedo cooling effect seems to dominate [90]. Evapotranspiration rate also affects cloud formation. Vegetation increases the roughness or friction or the land surface and affects wind speed and direction [89]. According to Strengers et al. [90] anthropogenic land-use change (i.e., deforestation) had a stronger effect on climate than the natural vegetation’s response to climate change. 3.2.5. Climate Change Imposed by Fertilization Nitrogen added to soil for fertilization may react to form N2 O, which is an extremely potent GHG. Moreover, fertilizers add to climate change due to high inputs of (fossil) energy in the production process. Janulis [91] reported that 58% of the energy demand of agricultural production was embedded in fertilizer production. Quantification of N2 O emissions from different agricultural practices is very important for the correct estimation of total GHG emissions from a biofuel system. Estimation of N2 O varies from study to study, and can significantly affect the reported GHG balance of biofuels. In fact, somewhere between 1%–5% of the applied nitrogen could react to form N2 O [31]. [92]. Within this range, the GHG balance may change from being beneficial to being not [93]. Several studies point to N2 O and ammonia emissions being highly important for the overall GHG balance for crops [14,39]. This implies a need for a differentiation between carbon neutrality and climate neutrality in biological production systems. Achieving carbon neutrality does not necessarily mean no GHG emissions. 3.2.6. Climate Change and the Timing of GHG Emissions and Carbon Uptake Some biofuel pathways have carbon debts which may take decades or centuries to pay off, either due to the size of the carbon debt or due to slow payback time. An example of large debts is palm oil produced on land that is converted from peaty soil to palm oil plantation. Due to the large soil carbon debt, even with large installments, the payback time may be long. An example of slow payback time is BTL produced from logged long rotating forests. The long rotation periods and long carbon payback times may exceed climate mitigation goals [55]. The carbon debt is not only created due to soil carbon emissions but due to the fact that biomass combustion releases more carbon into the atmosphere per energy unit than most fossil fuels. For rapid growing feedstocks without soil carbon debts, this debt is repaid very quickly, while for feedstock with a long recycling time of the biogenic carbon, the installments are small and the payback time may be long. Thus, if biomass is used solely for climate mitigation purposes, feedstock with short payback times should be used. This may leave us with few viable options within a short time frame for climate mitigation purposes, but we must also bear in mind that the debt eventually will be paid off and that biofuels may also be promoted for other reasons.
Energies 2011, 4
861
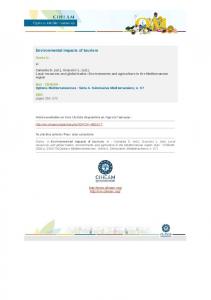
3.2.7. Land Use, Biodiversity and Water Use Land use is not only associated with GHG emissions and climate change. Land is a limited resource, and feedstocks that can produce the most energy per hectare are preferred. In a study by Miller [58], palm oil production proved to be the most energetically efficient feedstock per hectare of those investigated. Rapeseed production had the lowest energy production per hectare, and short rotation forestry/birch production laid in between, as shown in Figure 3. Figure 3. Land use intensity per 1000 GJ produced for different bioenergy feedstock sources [58].
Biodiversity loss is related to the loss of high quality habitat and species richness. Changing a land area, habitat quality may change and species richness may decrease. Conversion of natural land to agricultural land is the largest threat to global biodiversity loss. Since tropical forests host 70% of the planets plant and animal species, deforestation in these areas pose the single biggest global threat to biodiversity loss [94]. Increased logging for biofuels may have a negative effect on biodiversity as 48% of endangered species (Norway) lives in forests or woodlands [95]. Forest residues also have an ecological function in the forest as a nutritional source, and removal of forest residues may lead to reduced forest productivity [96–98]. Eggers et al. [99] evaluated the biodiversity impacts of arable and woody biofuel crops in a European context. An increase in biofuel production in EU27 indicates that overall more species are lost when changing from semi-natural land to cropland. However, careful selection of crops may counterbalance this as annual monocrops generally have lower biodiversity than perennial crops. For instance, woody crops may be beneficial for biodiversity by providing shelter for birds and mammals instead of cereal production [100,101]. Also, cultivation of monocultures represent a possibility of genetransfer to wild species. Palm oil biodiversity has been investigated in several studies [52,83,102]. Species richness is always lower in palm oil plantations than in primary or secondary forests and existing cropland and according to Fitzherbert et al. [52], on average of all species, a palm oil plantation host only 16% of the species found in a natural tropical forest. Even if palm oil production is a land sparing option in terms of high yields per hectare, the consequences of clearing native forest or peatlands are severe.
Energies 2011, 4
862
Water use is also critical for the sustainability of biofuels. Both water use and water availability must be assessed. While crops generally rely on irrigation for feedstock production, natural forests only relies on rainfall. In general, water use of biofuels is several times higher than petroleum based fuels [103]. Water use can be divided into water withdrawal and water consumption, where consumption is an example of using but not returning the water, while in water withdrawal, the water is used and returned, but not necessarily with the same quality [33]. As freshwater is a limited resource, the freshwater use should also be included in sustainability assessments. Wastewater generation is an important measure for water usage. For each ton of crude palm oil that is produced, 57.5 tons of water are required [104]. The process water use is somewhat less for HVO (25 kg per toe) than for transesterified lipids (30–40 kg per toe) [29,105]. Transesterified lipids production is usually very water intensive in processing due to the need for repeated washing to remove glycerol and other impurities, while HVO needs cooling water in the refinery. For transesterified lipids produced from European rapeseed, the average water footprint is 2608–3914 m3 /toe. For Palm oil produced in Indonesia/Malaysia, the average water footprint is 3453–3678 m3 /toe. Voinov and Cardwell [106] reports that the water amount required to produce one liter of Fischer–Tropsch liquid product varies between 4.6 liters to 6.8 liters, while the corresponding number for fossil diesel production in the refinery is 0.5–1 liter. 3.2.8. Other Impacts Imposed by Agriculture and Forestry Agricultural and silvicultural practices may pollute soil, water and air which may reduce habitat quality further. Improving management practices may reduce further habitat loss, especially due to eutrophication. Agrochemicals as fertilizer and pesticides add nitrogen and pollutants to the soil which may further leak to watersheds. The nitrogen may also leak to watersheds and cause eutrophication. The nitrogen efficiency of a feedstock is therefore an important measure of the environmental feasibility of the feedstock. Rapeseed has a large nitrogen input, while short rotation forestry as willow may have a nitrogen input that is 10–15 times lower [58]. Palm oil nitrogen input is in between these two and semi-natural forests will in most cases not be fertilized. Pesticides are toxic to many organisms and a large part of the applied pesticides do not reach the target and consequently pollute surroundings. For palm oil production, the palm oil mill effluent from palm oil plantations contain solids, oils and grease which should not leak or be disposed into natural waterways as it will be highly polluting [104]. Short rotation coppices can provide soil filter services and thereby reduce toxicity potentials. Establishment of short rotation coppices can also reduce erosion and protect watersheds. Clear cutting of natural forests may influence watersheds by increased soil erosion, increased sludge transportation and increased nutritional runoff. The effects of this may be reduced water oxygen content and increased eutrophication with a corresponding change in the aquatic environment. Forests also act as buffer zones by riverbeds and removal of these may have important ecological impacts [107]. 3.2.9. Health and Safety Issues In a health perspective, fuels with the lowest emissions of regulated emissions will be preferred. Of the fuels assessed, BTL and HVO show similar tailpipe emissions, while transesterified lipids perform
Energies 2011, 4
863
differently, with higher N Ox emissions. Increased N Ox emissions have been related to adverse health effects [108] and transesterified lipid combustion is under investigation [108–110]. The three fuels are all free from sulphur and aromatic, and for all regulated emissions except N Ox , transesterified lipids show better performance than fossil diesel [111]. Compared to HVO, transesterified lipids performs better than HVO in terms of PM and CO exhaust emissions, while HVO shows an advantage regarding N Ox and HC exhaust emissions [21,112]. Transesterified lipids are biodegradable [113] and Knothe [21] finds it reasonable to assume that also HVO (and BTL) will have biodegradability properties like transesterified lipids. Compared to spills of fossil fuels, spills of biodegradable fuels likely pose a smaller threat to the environment. 3.3. Economic Assessment and Resource Availability The overall feasibility of a certain fuel and feedstock combination will depend on economics and resource availability. These issues are further scrutinized in this section. By 2030 between 22 and 65 million hectares of cultivated land could be used for bioenergy feedstock production in EU27 without compromising food and feed, by modernization and restructuring. Around 24 million hectares of pasture land could be used for herbaceous and lignocellulosic biomass production [7,8]. Bright and Strømman predicts that a 25% woody biofuel scenario in 2050 in Northern Europe, will require 53% of the available resource base. Lindfelt et al. [1] conclude that the biomass potential alone is not enough to cover the needs of industry, food and energy (heat, electricity and transport fuels) in Sweden, but 25%–50% of the fuel demand could be met by biofuels. Total production of transesterified lipids in Europe in 2009 was approximately 9 million tons [114], and most was produced from rapeseed oil. Transesterified lipids are used as an example of potential production. The yield of transesterified lipids from waste oils and tallow depends on FFA content and water content. For pure vegetable oils 1 kg oil yields approximately 1 kg transesterified lipids. For crude tall oil, 1 kg yields 0.65 kg transesterified lipids, and it is assumed that 1 kg tallow and used cooking oil each yields 0.85 kg of transesterified lipids. Energy conversion efficiency can be assumed to be 50% for BTL production. Data on current feedstock costs and availability are listed below: • According to FAO [115], total world production of palm oil in 2009 was approximately 41 million tons, where 0.5–0.6 tons were imported to EU for transesterified lipids production. Thus, 41 million tons of palm oil transesterified lipids could theoretically be produced from current production, but a large part of the world palm oil production is used for food and cosmetics. Palm is available at 450–547 USD/ton [22,116–118]. • European rapeseed oil in 2009 was approximately 21 million tons [119], of which more than 50% was destined for transesterified lipids production. This implies that 21 million tons of rapeseed oil transesterified lipids could be produced, but as for palm oil transesterified lipids, rapeseed oil has competing uses. Rapeseed oil is available at 650–824 USD/ton [22,116–118]. • In Europe, about 0.5 million tons/year of crude tall oil are produced [120]. Around 0.35 million tons crude tall oil diesel could theoretically be produced. Crude tall oil is available at 100–400 USD/ton [64,121,122].
Energies 2011, 4
864
• Waste cooking oil production has been estimated in the US to be approximately 4–5 kg per capita per year [123]. With a population of approximately 500 million, the available waste oil could be 2–2.5 million tons per year in EU27. In UK, a potential of 1 million tons waste is estimated, which means that up to 16 kg waste oils per capita can be generated [124]. Using these numbers for the EU27 population, a range between 2–8 million tons of waste oils could be collected for transesterified lipids production, which implies a theoretical biodiesel production between 1.7–6.8 million tons. Waste oils are available at 100–300 USD/ton [116,125,126]. • In 2005, around 2.5 million tons of fats from the rendering industry was produced in EU17 [127], which means a theoretical production of 2.1 million tons of tallow transesterified lipids. Tallow has other uses, such as for food, pet food, chemicals and energy. Tallow is available at ∼200–550 USD/ton [45,64,121]. • A European study concluded that around 1270–1750 PJ/year of forest residues and forest industrial waste could be exploited for energy purposes in EU15. Energy crops could add an extra 1150 PJ/year. This could yield in total 1210–1450 PJ of BTL or 27.5–33 million tons BTL. This biomass must however compete with stationary uses and Edwards et al. [66] estimate that 824 PJ (18 million tons) syn-diesel could be produced annually, which constitutes 5.6% of the current (2007) fossil fuel use in EU25. Woody biomasss is available at 20–100 USD/ton (65%–70% dry mass) [15,128]. The availability of the best environmentally and economically performing feedstock options is thus much lower than for sources originating from agriculture and forestry. Feedstock prices can change rapidly according to changes in demand or supply, and the numbers presented are therefore only indicative of the relative prices between feedstock sources. The numbers on availability is based on numbers that report the whole production volume and does not take into account the share of the feedstock that is used or may be used for biofuel purposes. In theory the whole supply could be used for biofuel purposes if consumers demonstrates willingness to pay. 3.3.1. Costs of Producing Transesterified Lipids The key factors for the economic feasibility of a transesterified lipid plant are raw material price, plant capacity, byproduct prices and capital cost [17,36,126,129–132]. Raw material costs can account for more than 80% of the total costs of a transesterified lipids plant when virgin or refined vegetable oils are used [126,130,132,133]. According to de Wit et al. [134], first generation feedstock sources are available at 5–15 EUR/GJ. In West et al. [131], the direct manufacturing costs of waste canola (rapeseed) oil transesterified lipids production constitute approximately 72% of the total production costs. For a plant based on pure rapeseed vegetable oils, the raw material costs were 75%–90% of overall costs [130]. Refined oils can be 2–3 times more costly than waste oils, but a plant operating with pure refined oils with base catalyst have lower investment costs than a plant with pretreatment units [126]. Economics of transesterified lipids depends on the byproduct glycerin and its market price, which can reduce total costs by 6%–14% [126,131,132]. However, increased transesterified lipids production will likely decrease market price for glycerol [64]. Changes in feedstock costs will therefore affect the transesterified lipids production costs to a large extent. Palm oil has risen from approximately
Energies 2011, 4
865
450 USD/ton in 2006 to approximately 800 USD/ton in 2010, and the price of rapeseed oil in 2010 was approximately 1000 USD/ton, which means that palm oil currently has a 20% lower cost. Costs of waste oils are reported to be in the range of 0%–50% of virgin oils [47,126,133,135], but using waste oils often requires more capital costs than virgin oils due to extra processing steps. In addition, slightly lower yields (2%–5%) can be expected [135]. According to Babcock et al. [121], crude tall oil price is fairly half the price of palm oil, and tallow is reported to have 40% lower price than palm oil. Tornvall et al. [28] report crude tall oil prices in the order of 50% of the rapeseed oil prices. Plant capacity will largely influence the economic feasibility of transesterified, and in van Kasteren et al. [129], they demonstrated that in a processing plant for waste coking oils, the production cost per liter transesterified lipids in a 125,000 tons/year plant was approximately 1/3 of the production costs in a 8000 tons/year plant. The effect on plant capacity and glycerol when using refined vegetable oils will be somewhat less, since feedstock costs constitute a larger fraction of total costs than in a plant for waste oils. Figure 4 illustrates the relationship between transesterified rapeseed oil production cost and plant capacity in Greece. Figure 4. Illustration of correlation between RME production cost and plant capacity [130].
3.3.2. Costs of Producing HVO The costs of the hydroprocessing are in some studies stipulated to be about 50% of the (trans)esterification processing costs [64,136], but in Kalnes et al. [18,62] they state that investment and operating costs for HVO and transesterified lipids are in the same order, and overall economics will depend on feedstock costs and byproduct revenues. While costs of transesterified lipids can be reduced due to the by-product glycerol, propane is not as versatile, and may not lower the costs of HVO to the same extent. By locating the plant at an existing petroleum refinery, overall capital cost is minimized, according to Holmgren et al. [137]. In this study, HVO capital costs were around half of the transesterified lipids plant investment costs. Petroleum refiners claim that modification of existing refinery modules to produce HVO requires little capital investment. Operating costs will also be of importance for overall economics of HVO compared to transesterified lipids. The inputs to production are catalyst and hydrogen. Aatola et al. [112] indicate that HVO production investments are higher than for transesterified lipids.
Energies 2011, 4
866
3.3.3. Costs of Producing BTL BTL production costs show strong economy of scale effects [138,139]. In Van Vliet et al. [36], the conversion costs accounts for 47%–50% of the total costs, and forest farming costs (Eastern European Salix) for 35%–50% of total BTL costs. Syngas production accounts for almost half of the production costs, while biomass costs account for the largest to second largest cost share depending on scale. Feedstock costs for wood chips or forest residues are reported to be in the range of 2–5 EUR/GJ [128,134,140]. Bright et al. [128] reports that the investment costs per liter BTL fuel are moderate (∼15%), while feedstock contributes to 25%–30% of overall costs, operating costs are approximately 25% of overall costs, and taxes also contribute significantly to overall costs (25%–35%). Bridgwater [17] reports that by using waste chipboard, waste MDF or demolition waste, the feedstock costs may be reduced by 25%–40% compared to forest residues, but the liquid yield may be up to 5% lower than with wood chips. The same study concludes that the most sensitive cost element is yield, which has the greatest effect on production cost, and that improving process performance should be a priority. According to Bright et al. [128], the most sensitive cost elements are investment costs, capacity factor and interest rate of return. 3.3.4. Summary of Fuel Costs Table 5 reports findings on fuel production cost per liter. Retail prices are higher. Despite differences in mass energy density of the fuels, the volumetric energy density is very similar. Costs per liter fuel may not reflect the costs of driving if the fuels are used neat, even if the fuels have similar volumetric energy density. Transesterified lipids have higher oxygen content, which will reduce fuel efficiency compared to the other two fuels when used neat [64]. However, used in accordance with fuel standards, this will not significantly affect fuel consumption. No cost estimates were found for the production of fuels from crude tall oil, but it is reasonable to believe that they will be in the same order or slightly higher than for transesterified lipids from waste oils due to similar feedstocks costs, but presumably lower yields. Table 5 show no cost estimates for HVO as none were found in literature, but based on qualitative statements [62,64,136], HVO may have lower production costs than transesterified lipids from the same feedstock. The table reveals that production costs are largely dependent on production scale and feedstock. Pure and refined vegetable oils have high feedstock costs compared to waste oils and waste animal fats as tallow. Likewise, forest residues and woody waste have lower feedstock costs than dedicated woody crops and timber. Waste feedstocks are most economically feasible, demonstrated in practice by Argent Energy (UK) [141], who makes road fuel from tallow and used cooking oil, producing 1 million liters per week. BTL shows the highest production cost estimates, but some future cost estimates are quite optimistic and approaches the current costs of transesterified lipids when improved technology and low biomass costs are taken into account [15]. Market predictions estimate that transesterified lipids will likely have the largest market share of the three fuels for several years to come. Of the total diesel pool, transesterified lipids may hold 4%–5%, while the two others will likely add in the years to come. BTL is predicted to enter the market around 2014, and in 2018, BTL may hold 3% of the total diesel pool. HVO may hold in 2010 around 1% of the total diesel pool and in 2018, HVO may hold 4% of the total
Energies 2011, 4
867
diesel pool in 2018. The same study predicts that in 2018, a total of 12% of the diesel pool may be bio-based [112]. When technology improvements can lower the cost of BTL production, the market fraction will likely increase. Table 5. Review of fuel production costs per liter. Reference
Scale
[130] [130] [39] [39] [116] [116] [116] [116] [118] [45] [133] [129] [129] [36] [36] [36] [15] [128] [142] [142]
5 kton/year 140 kton/year Large Small 143 million liter/year 60 million liter/year 137 million liter/year 6 million liter/year 100 kton/year 113.4 million liter/year 36 kton/year 125 kton/year 8 kton/year 80 MWth 400 MWth 2000 MWth 106–118 kton/year 500 MWth 120 kton/year 1200 kton/year
Transesterified Rapeseed Oil 0.88 EUR 0.76 EUR 0.4 EUR 0.8 EUR
Transesterified Palm Oil
Transesterified Tallow
Transesterified Used Cooking Oil
Transesterified Tall Oil
Woody BTL
0.82 USD 0.88 USD 0.60 USD 0.85 USD 0.94 USD
0.70 USD 0.22–0.56 USD 0.45 USD 0.17 USD 0.52 USD 1.12 EUR 0.85 EUR 0.70 EUR 0.65–1.05 EUR 0.95–1.24 USD 1.02 EUR 0.82 EUR
4. Concluding Remarks Based on the dimensions presented above, the most feasible biodiesel technology and feedstock combination, in an environmental and cost perspective, is likely to exhaust wastes and byproducts for HVO production first. These are the best ranked in all dimensions scrutinized here. Unfortunately, they have limited availability. To expand biofuel production and use, the next preferable feedstock is likely residual woody biomass for BTL. Its relatively poor performance regarding costs can probably be remedied through technological advancements. Both the ability to not compete with food production and its environmental performance makes it a likely better option than most agricultural feedstocks. Thus, finally one should revert to agricultural feedstock options such as rape and palm oil. Looking at the lifecycle environmental impacts of the fuels, HVO do in most cases outperform transesterified lipids when assessing the same feedstock. Comparing HVO from different lipid feedstocks with woody BTL, the largest differences appear due to the fuel yield of the processes and the feedstock used. If HVO is produced from waste feedstocks with low upstream impacts, the high conversion efficiency of the HVO production process will make HVO the preferred fuel to BTL from any woody feedstock, even woody waste. Fuel yield and energy efficiency is low in BTL production. When native feedstocks as palm oil and rapeseed oil is used for HVO production, BTL is mostly superior due to low feedstock impacts and high energy yields per hectare of most non-waste woody feedstocks. On the other hand, using short rotation forestry for BTL production may in some cases make HVO from native feedstock with high yields, such as palm oil, more feasible. This is due to a combination of
Energies 2011, 4
868
low energy efficiency and higher feedstock impacts of short rotation forestry than wood from waste and forestry. In a resource perspective, woody biomass is the most abundant biomass resource in Europe and in particular in Northern Europe, where large forest resources are located. Waste feedstocks available for HVO are sparse, but the availability and potential of agricultural feedstocks are higher. For HVO and transesterified lipids, improvements in agricultural practices may improve the overall environmental impacts for native feedstocks, and will be key to successful implementation of these. All the challenges and uncertainties brought up in the discussion reduce the confidence in presented results. Many of them are often presented as methodological challenges that can be overcome by using standardized methods for, for instance, carbon releases associated with land use changes. There are, however, reasons to advocate precautions in a belief that any assessment tool will be able to present a correct figure for GHG emissions. Every forest or cropland, or even tree or plant, is specific and categorization can only give rough estimates. Impacts on biodiversity or land use are even more difficult to standardize and quantify for the very same reason. Together with the challenges related to how to allocate environmental burdens between products, byproducts and wastes, how to set system boundaries and how to choose the right inventory data, one can lose faith in ever getting trustworthy answers to what can be a sustainable path. When including as many aspects as possible in a study and using conservative estimates for the benefits, such as many of the studies presented here are examples of, conclusive results will give a strong indication of the right choices. Hence, using HVO produced from used cooking oil, tall oil and tallow or BTL from forest residues are wise environmental measures for the transport system in a short term. HVO or transesterified lipids from agricultural crops, as well as BTL from short rotation coppice, must be investigated in each specific case to ensure that food production is not compromised and that GHG emission savings are real even when land use change is included. In order to fully evaluate the sustainability or environmental feasibility of a biofuel feedstock, possible reference or alternative uses for the feedstock should also be evaluated. The difference between impacts in the use for biofuel purposes and alternative purposes should ideally be added or subtracted to the overall environmental impacts. Often there are several alternative routes for a waste or byproduct, and determining the most likely alternative use can be challenging and introduce large uncertainties. Furthermore, LCAs will have to adapt to the three-dimensional structure of sustainability evaluation to include social and economic aspects, and to address the challenge of “how can we in the future produce more with less” [143,144]? References 1. Lindfeldt, E.G.; Saxe, M.; Magnusson, M.; Mohseni, F. Strategies for a road transport system based on renewable resources-the case of an import-independent Sweden in 2025. Appl. Energy 2010, 87, 1836–1845. 2. Tsoskounoglou, M.; Ayerides, G.; Tritopoulou, E. The end of cheap oil: Current status and prospects. Energy Policy 2008, 36, 3797–3806. 3. Aleklett, K.; Hook, M.; Jakobsson, K.; Lardelli, M.; Snowden, S.; Soderbergh, B. The peak of the oil age-analyzing the world oil production reference scenario in world energy outlook 2008. Energy Policy 2010, 38, 1398–1414.
Energies 2011, 4
869
4. de Fraiture, C.; Giordano, M.; Liao, Y. Biofuels and implications for agricultural water use: Blue Impacts of green energy. Water Policy 2008, 10 (Suppl. 1), 67–81. 5. Hoekman, S.K.; Gertler, A.; Broch, A.; Robbins, C. Investigation of Biodistillates as Potential Blendstocks for Transportation Fuels; CRC Report No. AVFL-17; Coordinating Research Council, Inc.: Alpharetta, GA, USA, 2009. 6. Smeets, E.M.; Faaij, A.P.; Lewandowski, I.M.; Turkenburg, W.C. A bottom-up assessment and review of global bio-energy potentials to 2050. Prog. Energy Combust. Sci. 2007, 33, 56–106. 7. Fischer, G.; Hizsnyik, E.; Prieler, S.; van Velthuizen, H. Assessment of Biomass Potentials for Biofuel Feedstock Production in Europe: Methodology and Results; Technical Report for REFUEL project sponsored by the European Commission under the Intelligent Energy Europe programme; International Institute for Applied Systems Analysis: Laxenburg, Austria, 2007. 8. Fischer, G.; Prieler, S.; van Velthuizen, H.; Lensink, S.M.; Londo, M.; de Wit, M. Biofuel production potentials in europe: Sustainable use of cultivated land and pastures. Part I: Land productivity potentials. Biomass Bioenergy 2010, 34, 159–172. 9. Gallagher, E. The Gallagher Review of the Indirect Effects of Biofuels Production; Technical Report for Renewable Fuels Agency: St Leonards-on-Sea, UK, 2008. 10. European Commission (EC). Directive 2009/28/EC of the European Parliament and of the Council of 23 April 2009 on the Promotion of the Use of Energy from Renewable Sources and Amending and Subsequently Repealing Directives 2001/77/EC and 2003/30/EC. European Commission: Brussels, Belgium, 2009. 11. European Commission (EC). Directive 2009/30/EC of the European Parliament and of the Council of 23 April 2009 amending Directive 98/70/EC as Regards the Specification of Petrol, Diesel and Gas-Oil and Introducing a Mechanism to Monitor and Reduce Greenhouse Gas Emissions and Amending Council Directive 1999/32/EC as Regards the Specification of Fuel Used by Inland Waterway Vessels and Repealing Directive 93/12/EEC. European Commission: Brussels, Belgium, 2009. 12. Jamieson, A. The Long and Short of It: European Product Imbalances and Their Implications; Wood Mackenzie Report; Wood Mackenzie: Edinburgh, UK, 2005. 13. Petrus, L.; Noordermeer, M. Biomass to biofuels, a chemical perspective. Green Chem. 2006, 8, 861–867. 14. Arvidsson, R.; Persson, S.; Froling, M.; Svanstrom, M. Life cycle assessment of hydrotreated vegetable oil from rape, oil palm and Jatropha. J. Clean. Prod. 2010, 19, 129–137. 15. Anonomous. Biomass to Liquid BTL Implementation Report; Technical Report for the German Energy Agency: Berlin, Germary, 2006. 16. Baitz, M.; Binder, M.; Degen, W.; Deimling, S.; Krinke, S.; Rudloff, M. Comparative Life Cycle Assessment for SunDiesel (Choren Process) and Conventional Diesel Fuel, Executive Summary; Technical Report by DaimlerChrysler AG/Volkswagen AG; PE-Europe GmbH: Leinfelden-Echterdingen, Germany, 2004. 17. Bridgwater, A. Technical and Economic Assessment of Thermal Processes for Biofuels; Technical Report for COPE Ltd.: Shetland, UK, 2009.
Energies 2011, 4
870
18. Kalnes, T.N.; Koers, K.P.; Marker, T.; Shonnard, D.R. A technoeconomic and environmental life cycle comparison of green diesel to biodiesel and syndiesel. Environ. Prog. Sustain. Energy 2009, 28, 111–120. 19. Gerpen, J.V. Biodiesel processing and production. Fuel Process. Technol. 2005, 86, 1097–1107. 20. Huo, H.; Wang, M.; Bloyd, C.; Putsche, V. Life-cycle assessment of energy use and greenhouse gas emissions of soybean-derived biodiesel and renewable fuels. Environ. Sci. Technol. 2009, 43, 750–756. 21. Knothe, G. Biodiesel and renewable diesel: A comparison. Prog. Energy Combust. Sci. 2010, 36, 364–373. 22. Holmgren, J.; Gosling, C.; Marinangeli, R.; Marker, T.; Faraci, G.; Perego, C. New developments in renewable fuels offer more choices. Hydrocarb. Process. 2007, 86, 67–74. 23. Huijbregts, M.; Rombouts, L.; Hellweg, S.; Frischknecht, R.; Hendriks, J.; van de Meent, D.; Ragas, M.J.; Reijnders, L.; Struijs, J. Is cumulative fossil energy demand a useful indicator for the environmental performance of products? Environ. Sci. Technol. 2006, 40, 641–648. 24. Schmidt, J.H. Comparative life cycle assessment of rapeseed oil and palm oil. Int. J. Life Cycle Assess. 2010, 15, 183–197. 25. Zah, R.; Boni, H.; Gauch, M.; Hischier, R.; Lehmann, M.; Wager, P. Life Cycle Assessment of Energy Products: Environmental Assessment of Biofuels-Executive Summary; Technical Report by Technology and Society Lab, Swiss Federal Laboratories for Materials Testing and Research (EMPA): St. Gallen, Switzerland, 2007. 26. Thamsiriroj, T.; Murphy, J. Is it better to import palm oil from thailand to produce biodiesel in ireland than to produce biodiesel from indigenous irish rape seed? Appl. Energy 2009, 86, 595–604. 27. Kalnes, T.N.; Marker, T.; Shonnard, D.R.; Koers, K.P. Green diesel production by hydrorefining renewable feedstocks. Biofuels Technol. 2008, 4, 7–11. 28. Tornvall, U.; Borjesson, P.; Tufvesson, L.M.; Hatti-Kaul, R. Biocatalytic production of fatty epoxides from rapeseed & tall oil derivatives: Process & environmental evaluation. Ind. Biotechnol. 2009, 5, 184–192. 29. Nikander, S. Greenhouse gas and energy intensity of product chain: Case transport biofuel. Master’s Thesis, Department of Civil and Environmental Engineering, Faculty of Engineering and Architecture, Helsinki University of Technology, Helsinki, Finland, 2008. 30. Niederl, A.; Narodoslawsky, M. Life Cycle Assessment Study of Biodiesel from Tallow and Used Vegetable Oil; Technical Report by Institute for Resource Efficient and Sustainable Systems, Graz University of TechnologyInstitute for Resource Efficient and Sustainable Systems Process Evaluation (Graz University of Technology): Graz, Austria, 2004. 31. Thamsiriroj, T.; Murphy, J. The impact of the life cycle analysis methodology on whether biodiesel produced from residues can meet the eu sustainability criteria for biofuel facilities constructed after 2017. Renew. Energy 2011, 36, 50–63. 32. Beer, T.; Grant, T.; Campbell, P.K. The Greenhouse and Air Quality Emissions of Biodiesel Blends in Australia; Technical Report by CSIRO (Commonwealth Scientific and Industrial Research Organization): Clayton South, Australia, 2007.
Energies 2011, 4
871
33. Stratton, R.; Wong, H.; Hileman, J. Life Cycle Greenhouse Gas Emissions from Alternative Jet Fuels; Massachusetts Institute of Technology: Cambridge, MA, USA, 2010. 34. Gartner, S.O.; Helms, H.; Reinhardt, G.; Rettenmaier, N. An Assessment of Energy and Greenhouse Gases of NExBTL; Technical Report by ifeu-Institute for Energy and Environmental Research Heidelberg GmbH: Heidelberg, Germany, 2006. 35. Jungbluth, N.; Busser, S.; Frischknecht, R.; Tuchschmid, M. Life Cycle Assessment of Biomass-to-Liquid Fuels; Technical Report by ESU-Services Ltd.: Uster, Switzerland, 2008. 36. Van Vliet, O.P.; Faaij, A.P.; Turkenburg, W.C. Fischer-tropsch diesel production in a well-to-wheel perspective: A carbon, energy flow and cost analysis. Energy Convers. Manag. 2009, 50, 855–876. 37. Haase, M.; Skott, S.; Frohling, M. Ecological Evaluation of Selected 1st and 2nd Generation Biofuels-FT Fuel From Wood and Ethanol From Sugar Beets. In Challenges for Sustainable Biomass Utilisation; Proceedings of the Chilean-German Biociclo Workshop, Karlsruhe, Germany, March 2009; Universit¨at Karlsruhe Universit¨atsbibliothek: Karlsruhe, Germany, 2009. 38. Thamsiriroj, T.; Murphy, J.D. Can rape seed biodiesel meet the european union sustainability criteria for biofuels? Energy Fuels 2010, 24, 1720–1730. 39. Bernesson, S.; Nilsson, D.; Hansson, P.A. A limited LCA comparing large- and small-scale production of rape methyl ester (RME) under swedish conditions. Biomass Bioenergy 2004, 26, 545–559. 40. Elsayed, M.; Matthews, R.; Mortimer, N. Carbon and Energy Balances for a Range of Biofuels Options; DTI Publication URN 03/836; DTI Publication, Inc.: London, UK, 2003. 41. Peiro, L.T.; Lombardi, L.; Mendez, G.V.; Durany, X.G. Life cycle assessment (LCA) and exergetic life cycle assessment (ELCA) of the production of biodiesel from used cooking oil (UCO). Energy 2010, 35, 889–893. 42. Stephenson, A.; Dennis, J.; Scott, S. Improving the sustainability of the production of biodiesel from oilseed rape in the UK. Process Saf. Environ. Prot. 2008, 86, 427–440. 43. Broch, A.; Hoekman, S.K.; Gertler, A.; Robbins, C.; Natarajan, M. Biodistillate transportation fuels 3-life cycle impacts. SAE Int. J. Fuels Lubr. 2009, 2, 233–261. 44. Niederl-Schmidinger, A.; Narodoslawsky, M. Life cycle assessment as an engineer’s tool? J. Clean. Prod. 2008, 16, 245–252. 45. Nelson, R.G.; Schrock, M.D. Energetic and economic feasibility associated with the production, processing and conversion of beef tallow to a substitute diesel fuel. Biomass Bioenergy 2006, 30, 584–591. 46. Lopez, D.E.; Mullins, J.C.; Bruce, D.A. Energy life cycle assessment for the production of biodiesel from rendered lipids in the united states. Ind. Eng. Chem. Res. 2010, 49, 2419–2432. 47. Gaya, J.C.A.; Patel, M.K. Biodiesel from Rapeseed Oil and Used Frying Oil in European Union; Technical Report by Copernicus Institute for Sustainable Development and Innovation, Utrecht University: Utrecht, The Netherlands, 2003. 48. Stigsson, L. Diesel Range Fuels from Carboxylic Acids with Plant Origin. Sweden Patent WO/2009/011639/PCT/SE2008/000457, 2009.
Energies 2011, 4
872
49. Bernesson, S. Life Cycle Assessment of Rapeseed Oil, Rape Methyl Ester and Ethanol as Fuels—A Comparison between Large and Smallscale Production; Technical Report by Department of Biometry and Engineering, Swedish University of Agricultural Sciences: Uppsala, Sweden, 2004. 50. Brandao, M.; Mila i Canals, L.; Clift, R. Soil organic carbon changes in the cultivation of energy crops: Implications for GHG balances and soil quality for use in LCA. Biomass Bioenergy 2011, in press. 51. Germer, J.; Sauerborn, J. Estimation of the impact of oil palm plantation establishment on greenhouse gas balance. Environ. Dev. Sustain. 2007, 10, 697–716. 52. Fitzherbert, E.B.; Struebig, M.J.; Morel, A.; Danielsen, F.; Bruhl, C.A.; Donald, P.F.; Phalan, B. How will oil palm expansion affect biodiversity? Trends Ecol. Evol. 2008, 23, 538–545. 53. Fargione, J.; Hill, J.; Tilman, D.; Polasky, S.; Hawthorne, P. Land clearing and the biofuel carbon debt. Science 2008, 319, 1235–1238. 54. Reijnders, L.; Huijbregts, M. Palm oil and the emission of carbon-based greenhouse gases. J. Clean. Prod. 2008, 16, 477–482. 55. Soimakallio, S.; Antikainen, R.; Thun, R. Assessing the Sustainability of Liquid Biofuels from Evolving Technologies; Technical Report by VTT Technical Research Centre of Finland: Espoo, Finland, 2009. 56. Reinhardt, G.; Rettenmaier, N.; Gatner, S. Rain Forest for Biodiesel? Ecological Effects of Using Palm Oil as a Source of Energy; Technical Report by WWF Germany: Frankfurt am Main, Germany, 2007. 57. Wicke, B.; Dornburg, V.; Junginger, M.; Faaij, A. Different palm oil production systems for energy purposes and their greenhouse gas implications. Biomass Bioenergy 2008, 32, 1322–1337. 58. Miller, S. Minimizing land use and nitrogen intensity of bioenergy. Environ. Sci. Technol. 2010, 44, 3932–3939. 59. Rathke, G.W.; Christen, O.; Diepenbrock, W. Effects of nitrogen source and rate on productivity and quality of winter oilseed rape (Brassica napus L.) grown in different crop rotations. Field Crop. Res. 2005, 94, 103–113. 60. Halleux, H.; Lassaux, S.; Renzoni, R.; Germain, A. Comparative life cycle assessment of two biofuels ethanol from sugar beet and rapeseed methyl ester. Int. J. Life Cycle Assess. 2008, 13, 184–190. 61. Reijnders, L.; Huijbregts, M. Biogenic greenhouse gas emissions linked to the life cycles of biodiesel derived from european rapeseed and brazilian soybeans. J. Clean. Prod. 2008, 16, 1943–1948. 62. Kalnes, T.; Markery, T.; Shonnardz, D.R. Green diesel: A second generation biofuel. Int. J. Chem. React. Eng. 2007, 5, 1–9. 63. Neste Oil Website. Available online: http://www.nesteoil.com (accessed on 24 May 2011). 64. Marker, T.; Petri, J.; Kalnes, T.; McCall, M.; Mackowiak, D.; Jerosky, B.; Reagan, B.; Nemeth, L.; Krawczyk, M.; Czernik, S.; et al. Opportunities for Biorenewables in Oil Refineries; Final Technical Report submitted to U.S. Department of Energy; UOP: Des Plaines, IL, USA, 2005.
Energies 2011, 4
873
65. Garrain, D.; Herrera, I.; Lago, C.; Lechon, Y.; Saez, R. Renewable diesel fuel from processing of vegetable oil in hydrotreatment units: Theoretical compliance with european directive 2009/28/EC and ongoing projects in Spain. Smart Grid Renew. Energy 2010, 1, 70–73. 66. Edwards, R.; Griesemann, J.; Lariv, J.F.; Mahieu, V. Well-to-Wheels Analysis of Future Automotive Fuels and Powertrains in the European Context, Version 2c; Technical Report for EUCAR and CONCAWE and JRC; European Comission: Brussels, Belgium, 2007. 67. Yee, K.F.; Tan, K.T.; Abdullah, A.Z.; Lee, K.T. Life cycle assessment of palm biodiesel: revealing facts and benefits for sustainability. Appl. Energy 2009, 86, 189–196. 68. Jungbluth, N.; Frischknecht, R.; Emmenegger, M.; Steiner, R.; Tuchschmid, M. Life Cycle Assessment of BTL-fuel production: Life Cycle Impact Assessment and Interpretation; Technical Report of ESU-Services Ltd.: Uster, Switzerland, 2007. 69. Marland, G.; Schlamadinger, B. Forests for carbon sequestration or fossil fuel substitution? A sensitivity analysis. Biomass Bioenergy 1997, 13, 389–397. 70. Werner, F.; Taverna, R.; Hofer, P.; Thurig, E.; Kaufmann, E. National and global greenhouse gas dynamics of different forest management and wood use scenarios: A model-based assessment. Environ. Sci. Policy 2010, 13, 72–85. 71. Pingoud, K.; Pohjola, J.; Valsta, L. Assessing the integrated climatic impacts of forestry and wood products. Silva Fenn. 2010, 44, 155–175. 72. Perez-Garcia, J.; Lippke, B.; Comnick, J.; Manriquez, C. An assessment of carbon pools, storage, and wood products market substitution using life-cycle analysis results. Wood Fiber Sci. 2005, 37, 140–148. 73. Kim, H.; Kim, S.; Dale, B.E. Biofuels, land use change, and greenhouse gas emissions: Some unexplored variables. Environ. Sci. Technol. 2008, 43, 961–967. 74. Watson, R.T.; Noble, I.R.; Bolin, B.; Ravindranath, N.H.; Verardo, D.J.; Dokken, D.J. Land Use, Land-Use Change and Forestry; Technical Report by Intergovernmental Panel on Climate Change (IPCC): Geneva, Switzerland, 2000. 75. Guo, L.B.; Gifford, R.M. Soil carbon stocks and land use change: a meta analysis. Global Change Biol. 2002, 8, 345–360. 76. Houghton, R. Effects of land-use change on the carbon balance of terrestrial ecosystems. In Ecosystems and Land Use Change; Geophysical Monograph Series 153; Amer Geophysical Union: Washington, DC, USA, 2004; pp. 85–98. 77. Majer, S.; Mueller-Langer, F.; Zeller, V.; Kaltschmitt, M. implications of biodiesel production and utilisation on global climate a literature review. Eur. J. Lipid Sci. Technol. 2009, 111, 747–762. 78. Anderson-Teixeira, K.J.; Delucia, E.H. The greenhouse gas value of ecosystems. Global Change Biol. 2010, 17, 425–438. 79. Muller-Wenk, R.; Brandao, M. Climatic impact of land use in lca-carbon transfers between vegetation/soil and air. Int. J. Life Cycle Assess. 2010, 15, 172–182. 80. Lal, R. Soil carbon sequestration impacts on global climate change and food security. Science 2004, 304, 1623–1627. 81. Lehmann, J.; Gaunt, J.; Rondon, M. Bio-char sequestration in terrestrial ecosystems a review. Mitigation and Adaptation Strategies for Global Change 2006, 11, 403–427.
Energies 2011, 4
874
82. Brinkmann, A. Greenhouse Gas Emissions from Palm Oil Production-Literature Review and Proposals from the RSPO Working Group on Greenhouse Gases; Technical Report by Brinkmann Consultancy: Hoevelaken, The Netherlands, 2009. 83. Danielsen, F.; Beukema, H.; Burgess, N.; Parish, F.; Bruhl, C.A.; Donald, P.; Murdiyarso, D.; Phalan, B.; Reijnders, L.; Struebig, M.; et al. Biofuel plantations on forested lands: Double jeopardy for biodiversity and climate. Conserv. Biol. 2008, 23, 348–358. 84. Jandl, R.; Lindner, M.; Vesterdal, L.; Bauwens, B.; Baritz, R.; Hagedorn, F.; Johnson, D.W.; Minkkinen, K.; Byrne, K.A. How strongly can forest management influence soil carbon sequestration? Geoderma 2007, 137, 253–268. 85. Nabuurs, G.J.; Masera, O.; Andrasko, K.; Benitez-Ponce, P.; Boer, R.; Dutschke, M.; Elsiddig, E.; Ford-Robertson, J.; Frumhoff, P.; Karjalainen, T.; et al. 2006 IPCC Guidelines for National Greenhouse Gas Inventories; Volume 4, Agriculture, Forestry and Other Land Use; Technical Report by IPCC: Geneva, Switzerland, 2006. 86. Kowalski, A.S.; Loustau, D.; Berbigier, P.; Manca, G.; Tedeschi, V.; Borghetti, M.; Valentini, R.; Kolari, P.; Berninger, F.; Rannik, U.; et al. Paired comparisons of carbon exchange between undisturbed and regenerating stands in four managed forests in Europe. Global Change Biol. 2004, 10, 1707–1723. 87. Searchinger, T.; Hamburg, S.; Melillo, J.; Chameides, W.; Havlik, P.; Kammen, D.M.; Likens, G.E.; Lubowski, R.N.; Obersteiner, M.; Oppenheimer, M.; et al. Fixing a critical climate accounting error. Science 2009, 326, 527–528. 88. Vleeshouwers, L.; Verhagen, A. Carbon emission and sequestration by agricultural land use: A model study for Europe. Global Change Biol. 2002, 8, 519–530. 89. Levis, S. Modeling vegetation and land use in models of the earth system. Wiley Interdiscip. Rev. Climate Change 2010, 1, 840–856. 90. Strengers, B.J.; Muller, C.; Schaeffer, M.; Haarsma, R.J.; Severijns, C.; Gerten, D.; Schaphoff, S.; van den Houdt, R.; Oostenrijk, R. Assessing 20th century climate-vegetation feedbacks of land-use change and natural vegetation dynamics in a fully coupled vegetation-climate model. Int. J. Climatol. 2010, 30, 2055–2065. 91. Janulis, P. Reduction of eenergy consumption in biodiesel fuel life cycle. Renew. Energy 2004, 29, 861–871. 92. Crutzen, P.J.; Mosier, A.R.; Smith, K.A.; Winiwarter, W. N2 O release from fertilizer use in biofuel production. Atmos. Chem. Phys. Discuss. 2007, 7, 11191–11205. 93. Prieur, A.; Bouvart, F.; Inra, B.G.; Lehuger, S. Well to Wheels Analysis of Biofuels vs. Conventional Fossil Fuels: A Proposal for Greenhouse Gases and Energy Savings Accounting in the French Context; Paper No. 2008-01-0673; SAE World Congress & Exhibition: Detroit, MI, USA, April 2008. 94. Donald, P.F. Biodiversity impacts of some agricultural commodity production systems. Conserv. Biol. 2004, 18, 17–39. 95. Climate and Pollution Agency. State of the Environment Norway. Climate and Pollution Agency, Norway. Available online: http://www.miljostatus.no (accessed on 22 November 2010).
Energies 2011, 4
875
96. Dahlberg, A.; Egnell, G.; Berg, J.; Rytter, L.; Westling, O. Milj¨oeffekter av Skogsbransleuttag och Ask˚aterforing i Sverige; Rapport ER2006:44; Statens Energimyndighet: Bromma, Sweden, 2006. 97. Hansen, K.H.; Clarke, N. O kologiske konsekvenser av hogstavfall til bioenergi. Glimt Skog Landskap 2009, 3. 98. Stupak, I.; Asikainen, A.; Jonsell, M.; Karltun, E.; Lunnan, A.; Mizaraite, D.; Pasanen, K.; Parn, H.; Raulund-Rasmussen, K.; Roser, D.; et al. Sustainable utilisation of forest biomass for energy–possibilities and problems: Policy, legislation, certification, and recommendations and guidelines in the nordic, baltic, and other european Countries. Biomass Bioenergy 2007, 31, 666–684. 99. Eggers, J.; Troltzsch, K.; Falcucci, A.; Maiorano, L.; Verburg, P.H.; Framstad, E.; Louette, G.; Maes, D.; Nagy, S.; Ozinga, W.; et al. Is biofuel policy harming biodiversity in Europe? Global Change Biol. Bioenergy 2009, 1, 18–34. 100. Schmidt, J.H. Development of LCIA characterisation factors for land use impacts on biodiversity. J. Clean. Prod. 2008, 16, 1929–1942. 101. Weih, M. Intensive Short Rotation Forestry in Boreal Climates: Present and future perspectives. Can. J. For. Res. 2004, 34, 1369–1378. 102. Koh, L.P.; Wilcove, D.S. Is oil palm agriculture really destroying tropical biodiversity? Conserv. Lett. 2008, 1, 60–64. 103. Carrillo, A.M.R.; Frei, C. Water: A key resource in energy production. Energy Policy 2009, 37, 4303–4312. 104. Ahmad, A.L.; Ismail, S.; Bhatia, S. Water recycling from palm oil mill effluent (pome) using membrane technology. Desalination 2003, 157, 87–95. 105. Kiwjaroun, C.; Tubtimdee, C.; Piumsomboon, P. LCA studies comparing biodiesel synthesized by conventional and supercritical methanol methods. J. Clean. Prod. 2009, 17, 143–153. 106. Voinov, A.; Cardwell, H. The Energy-Water Nexus: Why Should We Care? J. Contemp. Water Res. Educ. 2009, 143, 17–29. 107. Sverdrup-Thygeson, A.; Borg, P.; Lie, M. Landskapsøkologi i Boreal Skog-En Sammenstilling av Studier Innen Okologi og Friluftsliv med Relevans for Landskapsøkologisk Planlegging i Norsk Skogbruk; Norskog-rapport 2002-1; Norskog: Oslo, Norway, 2002. 108. Swanson, K.J.; Madden, M.C.; Ghio, A. Biodiesel exhaust: The need for health effects research. Environ. Health Perspect. 2007, 115, 496–499. 109. Bunger, J.; Krahl, J.; Munack, A.; Ruschel, Y.; Schroder, O.; Emmert, B.; Westphal, G.; Muller, M.; Hallier, E.; Bruning, T. Strong mutagenic effects of diesel engine emissions using vegetable oil as fuel. Arch. Toxicol. 2007, 81, 599–603. 110. Krahl, J.; Knothe, G.; Munack, A.; Ruschel, Y.; Schroder, O.; Hallier, E.; Westphal, G.; Bunger, J. Comparison of exhaust emissions and their mutagenicity from the combustion of biodiesel, vegetable oil, gas-to-liquid and petrodiesel fuels. Fuel 2009, 88, 1064–1069. 111. Wu, F.; Wang, J.; Chen, W.; Shuai, S. A study on emission performance of a diesel engine fueled with five typical methyl ester biodiesels. Atmos. Environ. 2009, 43, 1481–1485.
Energies 2011, 4
876
112. Aatola, H.; Larmi, M.; Sarjovaara, T.; Mikkonen, S. Hydrotreated Vegetable Oil (HVO) as a Renewable Diesel Fuel: Trade-off between NOx , Particulate Emission, and Fuel Consumption of a Heavy Duty Engine. In Proceedings of the Powertrains, Fuels and Lubricants Meeting, Chicago, IL, USA, October 2008. 113. Atadashi, I.; Aroua, M.; Aziz, A.A. High quality biodiesel and its diesel engine application: A review. Renew. Sustain. Energy Rev. 2010, 14, 1999–2008. 114. European Biodiesel Board. Available online: http://www.ebb-eu.org (accessed on 15 December 2010). 115. Food and Agriculture Organization of the United Nations. Available online: http://www.faostat. fao.org (accessed on 28 October 2010). 116. Demirbas, A. Political, economic and environmental impacts of biofuels: A review. Appl. Energy 2009, 86, 108–117. 117. Carter, C.; Finley, W.; Fry, J.; Jackson, D.; Willis, L. Palm oil markets and future supply. Eur. J. Lipid Sci. Technol. 2007, 109, 307–314. 118. Lam, M.K.; Tan, K.T.; Lee, K.T.; Mohamed, A.R. Malaysian palm oil: Surviving the food versus fuel dispute for a sustainable future. Renew. Sustain. Energy Rev. 2009, 13, 1456–1464. 119. Eurostat. Available online: http://epp.eurostat.ec.europa.eu/portal/page/portal/eurostat/home/ (accessed on 10 January 2011). 120. Crude Tall Oil (CTO) & Harmful Environmental Subsidies. Position Paper. Available online: http://www.harrpa.org (accessed on 7 January 2011). 121. Babcock, R.E.; Clausen, E.C.; Popp, M.; Schulte, W.B. Yield Characteristics of Biodiesel Produced from Chicken Fat-Tall Oil Blended Feedstocks; Completion Report Project Number MBTC-2092; Mack-Blackwell Rural Transportation Center: Fayetteville, AR, USA, 2007. 122. Lee, S.Y.; Hubbe, M.; Saka, S. Prospects for biodiesel as a byproduct of wood pulping-a review. BioResources 2006, 1, 150–171. 123. Wiltsee, G. Urban Waste Grease Resource Assessment; Technical Report by National Renewable Energy Laboratory: Lakewood, CO, USA, 1998. 124. Thornley, P.; Tomei, J.; Upham, P.; Panoutsou, C.; Yates, N. Theme 6 Resource Assessment Feedstock Properties; Technical Report by SUPERGEN Biomass and Bioenergy Consortium: Birmingham, UK, 2008. 125. Sakai, T.; Kawashima, A.; Koshikawa, T. Economic assessment of batch biodiesel production processes using homogeneous and heterogeneous alkali catalysts. Bioresour. Technol. 2009, 100, 3268–3276. 126. Zhang, Y.; Dube, M.A.; McLean, D.D.; Kates, M. Biodiesel production from waste cooking oil: 2. Economic assessment and sensitivity analysis. Bioresour. Technol. 2003, 90, 229–240. 127. European Fat Processors and Renderers Association. Available online: http://www.efpra.eu (accessed on 18 April 2011). 128. Bright, R.M.; Strømman, A.H. Incentivizing wood-based fischer-tropsch diesel through financial policy instruments: An economic assessment for Norway. Energy Policy 2010, 38, 6849–6859.
Energies 2011, 4
877
129. van Kasteren, J.; Nisworo, A. A process model to estimate the cost of industrial scale biodiesel production from waste cooking oil by supercritical transesterification. Resour. Conserv. Recycl. 2007, 50, 442–458. 130. Apostolakou, A.; Kookos, I.; Marazioti, C.; Angelopoulos, K. Techno-economic analysis of a biodiesel production process from vegetable oils. Fuel Process. Technol. 2009, 90, 1023–1031. 131. West, A.H.; Posarac, D.; Ellis, N. Assessment of four biodiesel production processes using HYSYS.Plant. Bioresour. Technol. 2008, 99, 6587–6601. 132. Haas, M.J.; McAloon, A.J.; Yee, W.C.; Foglia, T.A. A process model to estimate biodiesel production costs. Bioresour. Technol. 2006, 97, 671–678. 133. Marchetti, J.; Miguel, V.; Errazu, A. Techno-economic study of different alternatives for biodiesel production. Fuel Process. Technol. 2008, 89, 740–748. 134. de Wit, M.; Junginger, M.; Lensink, S.; Londo, M.; Faaij, A. Competition between biofuels: modeling technological learning and cost reductions over time. Biomass Bioenergy 2010, 34, 203–217. 135. Moser, B.R. Biodiesel production, properties and feedstocks. Vitro Cell. Dev. Biol. Plant 2009, 45, 229–266. 136. Stumborg, M.; Wong, A.; Hogan, E. Hydroprocessed vegetable oils for diesel fuel improvement. Bioresour. Technol. 1996, 56, 13–18. 137. Holmgren, J.; Marinangeli, R.; Marker, T.; McCall, M.; Petri, J.; Czernik, S.; Elliott, D.; Shonnard, D. Opportunities for Biorenewables in Petroleum Refineries; Technical Report by UOP-Honeywell: Des Plaines, IL, USA, 2006. 138. Boerrigter, H. Economy of Biomass-to-Liquids (BTL) Plants-An Engineering Assessment; Technical Report by ECN Biomass, Coal and Environmental Research: ZG Petten, The Netherlands, 2006. 139. Tijmensen, M.J.A.; Faaij, A.P.C.; Hamelinck, C.N.; van Hardeveld, M.R.M. Exploration of the possibilities for production of fischer-tropsch liquids and power via biomass gasification. Biomass Bioenergy 2002, 23, 129–152. 140. Vogel, A.; Mueller-Langer, F.; Kaltschmitt, M. Analysis and evaluation of technical and economic potentials of BTL-fuels. Chem. Eng. Technol. 2008, 31, 755–764. 141. Argent Energy. Available online: http://www.argentenergy.com (accessed on 8 November 2010). 142. Festel, G.W. Biofuels—Economic aspects. Chem. Eng. Technol. 2008, 31, 715–720. 143. DeSimone, L.; Popoff, F. Eco-Efficiency: The Business Link to Sustainable Development; The MIT Press: Cambridge, MA, USA, 2000. 144. Zamagni, A.; Buttol, P.; Buonamici, R.; Masoni, P.; Guinee, J.; Huppes, G.; Heijungs, R.; van der Voet, E.; Ekvall, T.; Rydberg, T. Calcas-D20 Blue Paper on Life Cycle Sustainability Analysis; Technical Report for Co-ordination Action for innovation in Life-Cycle Analysis for Sustainability. CML Leiden University: Leiden, The Netherlands, 2009. c 2011 by the authors; licensee MDPI, Basel, Switzerland. This article is an open access article ⃝ distributed under the terms and conditions of the Creative Commons Attribution license (http://creativecommons.org/licenses/by/3.0/).