Original Paper Neuroepidemiology 2012;38:154–163 DOI: 10.1159/000335701
Received: September 2, 2011 Accepted: December 5, 2011 Published online: March 29, 2012
© Free Author Copy – for perEpidemiological Study and Clinical sonal Profile of use only ANY DISTRIBUTION OF THIS Parkinson’s Disease in the Assiut Governorate, ARTICLE WITHOUT WRITTEN FROM S. KARGER Egypt: A Community-Based Study CONSENT AG, BASEL IS A VIOLATION
Eman M. Khedr a Ghada S. Al Attar b Mahmoud R. Noha Abo Elfetoh a Mohamed A. Ahmed a
OF THE COPYRIGHT. a Nageh permission to F. distribKandilWritten Kamel a
ute the PDF will be granted against payment of a permission fee, which is based a b Departments of Neurology and Public Health and Community Medicine, Assiut University Hospital, Assiut, Egypt on the number of accesses required. Please contact
[email protected]
Key Words Parkinson’s disease ⴢ Prevalence ⴢ Dementia ⴢ Nonmotor symptoms
Abstract Background: Few comprehensive epidemiological studies of the prevalence of Parkinson’s disease (PD) have been undertaken in Arab countries, and none has been carried out in Egypt. A community-based survey was conducted in the Assiut Governorate to estimate the prevalence and clinical profile of PD. Methods: A community-based study was carried out, with random sampling of 7 districts, involving 6,498 inhabitants. Out of this sample, 578 subjects dropped out, leaving 3,066 males (51.8%) and 2,854 females (48.2%). There were 3,660 urban residents (61.8%) and 2,260 (38.2%) from the rural community. Patients were evaluated using a screening questionnaire, the Unified Parkinson Disease Rating Scale and the Non-Motor Symptoms Scale for PD. Results: Thirty-nine subjects were found to have parkinsonism, giving a crude prevalence rate of 659/100,000 inhabitants. Of these subjects, 33 were diagnosed with PD (21 males), with a mean age of 66.9 8 8.4 years, a crude prevalence rate of 557/100,000 and an age-specific prevalence rate (650 years old) of 2,748/100,000. There were more males than females (3,395 vs. 1,989/100,000), but the difference was not signifi-
© 2012 S. Karger AG, Basel 0251–5350/12/0383–0154$38.00/0 Fax +41 61 306 12 34 E-Mail
[email protected] www.karger.com
Accessible online at: www.karger.com/ned
cant. The highest age-specific prevalence rate was recorded among subjects 70–79 years old (7,263/100,000). There was © Free Author Copy – for personal use only a significantly higher prevalence among rural than urban inANY(973 DISTRIBUTION OF THIS ARTICLEand WITHOUT WRITTEN CONSENT FROM KARGER AG, BASEL habitants vs. 301/100,000) among illiterate thanS.litWritten permission to distribute the PDF will be granted against payment of a permission fee, w erate persons (1,103 vs. 280/100,000). The clinical profile of our patients was similar to that of other populations but was characterized by a high prevalence of mood/cognition dysfunction and gastrointestinal symptoms; there were few reported perceptual problems. Conclusion: The overall prevalence of PD was high, especially in older adults. Copyright © 2012 S. Karger AG, Basel
Introduction
Parkinson’s disease (PD) is a common neurodegenerative disorder among elderly people that generates a substantial socioeconomic burden [1, 2]. The population in less developed regions is aging more rapidly than in the developed world; in these regions, the elderly population is expected to increase by a factor of 3 in the next four decades [3]. Consequently, the burden of PD will increase dramatically worldwide, and the most significant changes are expected to occur in healthcare systems of less developed countries.
Prof. Eman M. Khedr Department of Neurology Assiut University Hospital Assiut (Egypt) Tel. +20 88 2333 355, E-Mail emankhedr99 @ yahoo.com
Different methods have been used to estimate the prevalence of PD, such as screening of clinical records and certificates, two-phase door-to-door surveys in a specific community and drug tracer methodology, utilizing the consumption of L-dopa to calculate the prevalence of PD. Door-to-door surveys are accepted as the gold-standard design for estimation of the prevalence of PD, but such surveys are conducted with varying protocols, which limits their comparability. Nevertheless, prevalence obtained by door-to-door studies is greater than that derived from other approaches, since this method can detect previously undiagnosed cases. The drawbacks of a door-to-door study design are high costs and consequently a reduced study size. In door-to-door studies, the rate of crude PD prevalence was found to be as low as 15/100,000 in China [4] and as high as 657/100,000 in Argentina [5]. The disease occurs worldwide, with studies in Africa yielding hospital frequencies of 0.3–2.3% of neurological diseases [6]. In western Nigeria, the prevalence rate is between 50 and 90 per 100,000 of the population aged above 10 years [7]. A recent systematic review of PD in Arab populations [8] found only three epidemiological studies. In general, a lower prevalence rate of PD was recorded among Arab compared to European countries. Ashok et al. [9] reported a crude prevalence rate of 31.4/100,000 in Benghazi (northeastern Libya). Al Rajeh et al. [10], in a two-phase door-to-door study conducted in Thugbah, Saudi Arabia, found a crude prevalence rate of 22/100,000 [10], while Attia Romdhane et al. [11] found the prevalence of PD in Kelibia, Tunisia, to be close to that in the other two studies. Egyptian populations are characterized demographically by large family units, high birth rates and high rates of consanguineous marriages, yet very few data are available regarding the epidemiology of PD in Egypt. We therefore conducted a community-based survey to estimate the prevalence and clinical profile of PD in our locality (upper Egypt/Assiut Governorate), in which the population is a mixture of rural and urban inhabitants.
Subjects and Methods A cross-sectional community-based study was implemented. The Assiut Governorate is one of the Upper Egypt Governorates and lies 375 km south of Cairo. The Assiut Governorate consists of 11 districts by the Nile, and its estimated population in the last census in 2006 was 3,441,597. The districts are distributed northeast, northwest, southeast and southwest of the Nile, and the main capital of the governorate is Assiut district. Each outlying district
Prevalence of Parkinson’s Disease in Assiut, Egypt
consists of a group of villages representing the rural areas. Assiut central district was considered the urban area of the governorate. The sample size was based on an expected prevalence of 0.4% among adults, with 2 percentage points’ error and a 95% confidence interval, allowing for a 10% rate of refusal to participate. The study was conducted over a 1-year period from 1 January 2010 to 31 December 2010. The latter date was considered the prevalence day. So, any positive subject fulfilling the diagnostic criteria of parkinsonism prior to the prevalence day at any time of their lives was considered a prevalent case, and any subject who gave a history suggestive of parkinsonism developing during the year of the survey was considered an incident case of PD. Sampling Methodology Representative random sampling was used. First Stage: Selection of the Study Sites A simple random sample of 7 study sites in the Assiut Governorate was selected. Firstly, 4 sites were selected according to the geographical location of the districts. One district was selected from each of the following areas of the governorate: northeast, northwest, southeast and southwest. Then, 4 villages (1 in each district) were also selected by a simple random technique. Secondly, from Assiut district itself, 3 more areas were selected, namely Al-bisari, Al-walideya and Al-Hamaraa. Second Stage: Selection of the Households Systematic random sampling of households in the 7 areas was then performed by selecting every 3rd household in each of the 7 study sites. If a family refused to participate, we replaced them with the family next door. Third Stage Initial diagnosis was based upon a general two-part screening questionnaire, with part I recording sociodemographic details and part II involving a PD screening questionnaire [12] translated into Arabic. The screening questionnaire was pretested in an outpatient clinic on a sample of 25 PD patients and 25 age- and sexmatched family members who had joint arthritis without manifestations of PD. The sensitivity and specificity of the questionnaire were 95 and 85%, respectively. The screening questionnaire consisted of 8 questions, and each question had a yes or no answer. Question 1 inquired about tremors, questions 2, 5, 7 and 8 inquired about bradykinesia, question 6 inquired about balance and questions 3 and 4 asked about rigidity and changes in speech or writing quality (in educated participants) in the recent past. Subjects who screened positive were selected for the present study. The UK Parkinson’s Disease Society Brain Bank Criteria [13] were used to assign a diagnosis of parkinsonism/PD based on the questionnaire. These criteria require the presence of bradykinesia and at least one other feature of parkinsonism (rigidity, tremors or impaired balance). The survey team consisted of four social workers (at least 10 years of education) who administered the screening questionnaire, headed by a neurologist and psychiatrist (masters degree with at least 5 years of experience), who confirmed the diagnosis by readministering the screening questionnaire and referring the positive cases to hospital. The whole team received 2 weeks of training on how to carry out the protocol before the study commenced.
Neuroepidemiology 2012;38:154–163
155
Table 1. Crude prevalence rate of PD and other parkinsonism
Crude prevalence (number of cases/number of population)
Crude prevalence rate/100,000
95% CI
Parkinsonism (39/5,920) PD (33/5,920) Drug-induced parkinsonism (3/5,920) Post-stroke parkinsonism (2/5,920) Parkinsonism with dementia (1/5,920) PD according to gender Males (21/3,066) Females (12/2,854) PD according to residence Urban (11/3,660) Rural (22/2,260) PD according to education Illiterate (22/1,996) Literate (11/3,924) Crude incidence of PD (5/5,920) Crude incidence of PD in males (3/3,066) Crude incidence of PD in females (2/2,854)
659 557 51 34 17
452–866 367–748 0–108 0–81 0–50
685 421
392–978 183–658
301 973*
123–478 567–1380
1,103** 280 84 98 70
642–1564 115–446 10–158 0–209 0–167
CI = Confidence interval. * p ≤ 0.001; ** p ≤0.0001.
Fourth Stage This stage involved neurological examination of all positive cases after referral to the Neuropsychiatric Department of Assiut University Hospital by the principal investigator (first author). The field co-coordinator was responsible for setting the appointments with the department at a time that was convenient for the study subjects. Patients with secondary parkinsonism, e.g. drug-induced parkinsonism or post-stroke parkinsonism, were also included. Each case was scored using the following: the mini-mental state examination [14], the Unified Parkinson Disease Rating Scale III [15], Hoehn and Yahr (HY) [16] staging and the NonMotor Symptoms Scale (NMSS) [17]. Statistical Analysis Different scales were reviewed, and open-ended questions were coded and entered using a simple spreadsheet. Analysis was performed after data verification and correction. All data were analyzed with the aid of SPSS version 16 (www.spss.com). The results are expressed as means 8 SD.
Results
A total of 6,498 inhabitants were included in the study. Of these, 578 could not be examined (away from the governorate at the time of the survey), leaving a final total of 5,920 examinees (1,480 families). One hundred and nine families refused to participate; however, each was replaced by the next-door family. 156
Neuroepidemiology 2012;38:154–163
Of the study population, there were 214 inhabitants (3.6%) under 5 years, with 115 males and 99 females; 305 subjects (5.2%) were aged between 5 and 9 years, including 165 males and 140 females; 535 (9%) were aged 10–14 years, with 276 males and 259 females; 775 (13.1%) were aged 15–19 years, with 418 males and 357 females; 718 (12.1%) were aged between 20 and 24 years, including 416 males and 302 females; 525 (8.9%) were aged 25–29 years, with 262 males and 263 females; 406 (6.9%) were aged 30–34 years, with 196 males and 210 females; 395 (6.7%) were aged between 35 and 39 years, including 182 males and 213 females; 365 (6.2%) were aged 40–44 years, with 168 males and 197 females; 481 (8.1%) were aged 45–49 years, with 220 males and 261 females, and 1,201 (20.3%) were aged 650 years, with 648 males and 553 females (the latter group was further divided into 5-year age groups, as illustrated in table 2). With regard to education, 1,996 subjects were illiterate (33.7%); 361 (6.1%) were able to read and write; 623 (10.5%) had 6 years of education; 2,061 (34.8%) had 7–10 years education, and 879 (14.8%) had participated in higher education. With regard to occupation, 512 were farmers (8.6%); 1,579 (26.7%) were housewives; 671 (11.3%) were employers; 581 (9.8%) were professionals; 113 (1.9%) were technicians; 1,258 (21.3%) were students, and 1,206 (20.4%) did not work.
Khedr /Al Attar /Kandil /Kamel / Abo Elfetoh /Ahmed
Age group
Number of cases
Number of inhabitants (population at risk)
95% CI Percentage CPR/ of studied 100,000 population (n = 5,920)
≥50 years Total 33 1,201 20.28 Male 21 648 10.94 Female 12 553 9.34 Female/male ratio = 1/1.51 50–54 years 4.59 272 2 Total 2.58 153 0 Male 2.01 119 Female 2 55–59 years Total 3 277 4.68 Male 3 149 2.52 Female 0 128 2.16 60–64 years 4.49 266 6 Total 2.26 134 5 Male 2.23 132 Female 1 65–69 years 2.68 159 6 Total 1.67 99 4 Male 1.01 60 Female 2 70–74 years 2.14 127 10 Total 1.03 61 4 Male 1.11 66 Female 6 75–79 years 0.88 52 3 Total 0.59 35 2 Male 0.29 17 Female 1 80–84 years 0.56 33 2 Total 0.24 14 2 Male 0.32 19 Female 0 85+ years 0.25 15 1 Total 0.05 3 1 Male 0.2 12 Female 0
2,748 1,810–3,685 3,395 1,976–4,814 1,989 814–3,165
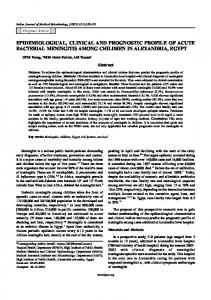
Total age-specific prevalence/100,000 10,000 8,000 6,000 4,000 2,000 0
735 0 1,681
0–1,754 0 0–4,010
1,083 2,013 0
0–2,309 0–4,292 0
2,256 3,731 758
451–4,061 461–7,002 0–2,242
3,774 4,040 3,333
754–6,793 81–8,000 0–7,953
7,8741 2,994–12,754 6,557 131–12,984 9,0912 1,817–16,365 5,769 5,714 5,882
0–12,298 0–13,634 0–17,412
6,061 14,286 0
0–14,460 0–34,085 0
6,667 33,3333 0
0–19,733 0–98,667 0
CPR = Crude prevalence rate; CI = confidence interval. The highest age-specific prevalence rate (p ≤ 0.0001). 2 The highest age-specific prevalence rate for males (p ≤ 0.0001). 3 The highest age-specific prevalence rate for females (p ≤ 0.0001). 1
Thirty-nine subjects were found to have parkinsonism, giving a crude prevalence of 659/100,000 inhabitants; of these, 33 patients were diagnosed with PD, with a crude prevalence of 557/100,000 inhabitants (all ages). The total age-adjusted prevalence rate of PD for all ages Prevalence of Parkinson’s Disease in Assiut, Egypt
12,000
Cases/100,000
Table 2. Crude age- and sex-specific prevalence rates of PD in the Assiut Governorate, Egypt
50–54 55–59 60–64 65–69 70–74 75–79 80–84 85–89 years years years years years years years years Age group
Fig. 1. Age-specific prevalence rate for PD in our community. The crude prevalence increased steadily with age until the age of 70–74 years and then decreased between 75 and 84 years of age.
was 562/100,000 among the total population. The ageadjusted prevalence rate for men was 777/100,000, and for women, it was 445/100,000. Three patients had drug-induced parkinsonism, which gives a prevalence rate of 51/100,000, and 2 patients had post-stroke parkinsonism, giving a prevalence rate of 33.8/100,000. One patient had early dementia, giving a prevalence rate of 17/100,000. In addition to these 39 cases, 3 cases were false positive, as they had been diagnosed by the social workers, but this was corrected by the neurologist (2 of them had spastic quadriparesis secondary to cervical spondylosis and 1 had osteoarthritis). Crude prevalence rates are given in table 1. As can be seen, PD was more common in males than in females but not significantly so; it was more common in rural than in urban areas (odds ratio = 3.26; p = 0.0013), and it was more common in illiterate individuals than in those who could read (odds ratio = 3.96; p = 0.00012). The age- and gender-specific prevalence rates of PD in the 5-year age groups are shown in table 2 and figure 1. In general, the prevalence rates increased with age for both genders. No cases of PD were found in subjects below 50 years, while the age-specific prevalence rate in elderly individuals (150 years) was 2,748/100,000. The highest age-specific prevalence rates were recorded among subjects 70–74 years old (7,263/100,000) and among those 185 years old (6,667/100,000). There were more males than females, with a male to female ratio of 1.5:1 for patients 650 years old. Neuroepidemiology 2012;38:154–163
157
The clinical and demographic data of the 33 PD patients are shown in table 3. The mean duration of illness was 6.17 8 5.9 years, ranging from 6 months to 25 years, with the majority of cases in stages I (10 patients, 30.4%), II (14, 42.4%) and III (4, 12.2%) and the remaining in stages IV and V of the HY classification. Five patients (15%) had a positive family history. During the survey, 12 patients received their first diagnosis from the study neurologists (all of them from rural areas). All of the patients had bradykinesia; resting tremors and rigidity were recorded in 90.9 and 84.8%, respectively. With regard to treatment, only 14 patients regularly received antiparkinsonian drugs; 14 patients received nonspecific drugs (analgesics, anabolics and muscle relaxants), and 5 patients received antiparkinsonian drugs on an irregular basis, whenever possible. The domains of the NMSS with the greatest frequency were gastrointestinal complaints, followed by sleep/fatigue as well as mood/cognition. Perceptual problems were the domain with the lowest frequency (table 4).
Discussion
The overall crude prevalence of PD in our locality (Assiut, Egypt) was high (557/100,000 for all ages and 2,748/100,000 for subjects 650 years) in comparison to other Arab areas (27–43/100,000; table 5). It should be noted that the study by Masalha et al. [18] in the Arab population of Israel applied a drug tracer methodology considering all anti-PD medications, including L-dopa compounds and all the dopamine agonists as well as anticholinergic agents and amantadine, to detect cases of PD. This methodology has disadvantages in comparison to a door-to-door study; the prevalence rates in door-todoor studies generally exceed those in other populationbased studies. In European countries, where a larger number of door-to-door studies have been performed, estimates of crude prevalence rates vary considerably, from 65.6/100,000 in Sardinia [19] to 12,500/100,000 for institutionalized patients in Germany [20] (table 5 lists most of the previous door-to-door studies). The higher prevalence figures recorded in the present study compared with other Arab countries and some European countries could be due to several factors, such as an increased risk of PD since most of the cases were recruited from rural areas, more inclusive diagnostic criteria, an increased incidence of genetic factors (15% of our cases had a positive family history) and more intensive case-finding efforts as the evaluation (by neurologists) 158
Neuroepidemiology 2012;38:154–163
Table 3. Demographic and clinical data of 33 PD patients1
Variable Age, years Range, years Duration of PD, years Range, years Symptoms Bradykinesia Resting tremors Rigidity Postural instability Total UPDRS score Range
66.9488.45 50485 6.1785.9 0.5425 33 (100%) 30 (90.9%) 28 (84.8%) 20 (60.6%) 22.03815.4 5458
Data are shown as means 8 SD or numbers of patients, as appropriate. UPDRS = Unified Parkinson Disease Rating Scale. 1 Twelve of these patients were newly diagnosed with PD.
Table 4. Frequency and percentage of occurrence of each domain of the NMSS
NMSS domain
Yes/no
Percentage of yes answers
Cardiovascular Sleep/fatigue Mood/cognition Perceptual problems Attention/memory Gastrointestinal Urinary Sexual function Miscellaneous Total NMSS
26/7 28/5 28/5 1/32 24/9 30/3 24/9 22/11 21/12 32/1
79.8 84.8 84.8 3 72.7 90.9 72.7 66.7 63.6 97
established a diagnosis in a large number of newly diagnosed cases (30%). From a practical viewpoint, this approach was attractive because it allowed the study neurologists to concentrate on those subjects most likely to have PD. In contrast, several other studies were performed by medical students or GPs. It is possible that in these instances there was an increased chance of falsenegative screening results, which would lead to an underestimation of the true disease incidence. Drug consumption studies have been performed in Arabic Israel [18], Italy, the Netherlands, Germany and Spain. This approach is influenced by multiple confounders, including treatment practices and time trends in drug policy, the introduction of new drugs and access to reimbursement Khedr /Al Attar /Kandil /Kamel / Abo Elfetoh /Ahmed
Table 5. Crude prevalence rate for PD among Arab, European and other countries Report/ country
Screening procedure
Diagnostic criteria
Total population/ Crude number of cases prevalence
Ashok et al. [9] Libya
not stated
the diagnosis of PD was based on 2 or more of the following cardinal signs: resting tremor, rigidity, hypokinesia, changes in postural/righting reflexes
518,745/163
31.4/105
50 years and older: 285.1/105
Al Rajeh et al. [10] Saudi Arabia
two-phase door-to-door study; a pretested questionnaire in a faceto-face interview
the presence of at least 2 of the cardinal features of parkinsonism
23,227/6
27/105
not stated
Attia Romdhane questionnaire, screening et al. [11] personnel: one question on Tunisia tremor and two relating to bradykinesia
not stated
34,874/15
43/105
not stated
Masalha et al. [18] Arabic Israel
all individuals who were on anti-PD medication were identified and examined by a neurologist to confirm the diagnosis
115,000/49
43.24/105
36–45: 13.6/105 46–55: 19/105 56–65: 132.2/105 66–75: 67.02/105 76–96: 290.2/105
de Rijk questionnaire, neurological et al. [21] examination; screening Rotterdam, personnel: neurologist The Netherlands
criteria according to the Europarkinson protocol; parkinsonism: if ≥2 cardinal signs in subjects not taking antiparkinsonian drugs or 1 sign in subjects taking drugs
6,969/97
1,400/105
55–64: 300/105 65–74: 1,000/105 75–84: 3,100/105 85–94: 4,300/105
Claveria questionnaire, neurological et al. [22] examination; screening Cantalejo, Spain personnel: 2 neurologists
parkinsonism: ≥2 out of 4 cardinal signs; PD calculated by using prevalence rates worldwide and pooled European cohort
3,503/20
1,280/105
60–69: 630/105 70–79: 1,300/105 80–89: 10,400/105 90+: 18,750/105
Bergareche et al. [23] Bidasoa, Spain
questionnaire, (periodic) neurological examination; screening personnel: trained nonphysician interviewers, neurologists
parkinsonism: >2 out of 4 cardinal signs or if 1 sign documented in history improved by antiparkinsonian treatment; PD: by exclusion of all other possible causes
2,000/18
1,500/105
65–74: 400/105 75–84: 4,700/105 85+: 2,900/105
Morgante et al. [24] Sicily, Italy
questions, test for tandem gait, clinical examination; screening personnel: medically trained neurologist
parkinsonism: ≥2 out of 4 signs present in individuals not receiving antiparkinsonian drugs or ≥1 sign in treated patients; PD or idiopathic parkinsonism: by exclusion of all other possible causes of parkinsonism
19,955/63
257.2/105
0–49: 0 50–59: 115.6/105 60–69: 621.4/105 70–79: 1,978.3/105 80–89: 3,055.0/105 90+
Munoz et al. [25] questionnaire, neurological Limousin region, examination; screening France personnel: medical students, neurologists
WHO definition, Bartel Index
1,562/5
328/105
not stated
Trenkwalder et al. [26] Germany
questionnaire, neurological examination; screening personnel: neurologically trained GPs, students, neurologist
PD: according to UK Brain Bank criteria, 2 out of 3 cardinal signs positive; response to levodopa (except de novo patients)
population: 9,827 713/105
not stated
Kis et al. [27] South Tyrol, Northern Italy
questionnaire, neurological examination; screening personnel: GP and neurologist
parkinsonism: ≥2 out of 4 cardinal signs present in individuals not receiving antiparkinsonian drugs or if ≥1 cardinal sign improved by medical treatment (diagnosis of IPD according to Europarkinson study)
750/12
60–64: 500/105 65–69: 1,000/105 70–74: 600/105 75–79: 6,500/105 80–85: 1,100/105
drug tracer methodology was applied in this study
Prevalence of Parkinson’s Disease in Assiut, Egypt
Neuroepidemiology 2012;38:154–163
not stated (adjusted to the 1991 European census population: 1,500/105)
Age-specific prevalence/100,000
159
Table 5 (continued) Report/ country
Screening procedure
Diagnostic criteria
Total population/ Crude number of cases prevalence
Age-specific prevalence/100,000
Kleinhenz et al. [28] West Germany
questionnaire, levodopa consumption statistics of health insurance; screening personnel: physicians, neurologists
standardized questionnaires with appropriate items regarding symptoms, diagnosis and treatment for the disease were distributed
556 506 1,018
Lübeck 188/105 not stated Stormann 206/105 Lauenburg 147/105 Total: 183/105
Zhang and Roman [29] greater Beijing, China
3 or more cardinal signs; alternatively, 2 cardinal signs were accepted as sufficient, provided all additional conditions were met
follow-up a few months later to confirm the diagnosis of 3 or more cardinal signs; alternatively, 2 cardinal signs were accepted as sufficient, provided all additional conditions were met
5,743/64
1,100/105
55–64: 300/105 65–74: 1,200/105 75–84: 3,500/105 85–94: 3,700/105 95+: 0
Mehta et al. [30] screened participants who took Australia PD medications
PD diagnosis was confirmed by contacting the participant’s medical/ general practitioners
3,509/16
460/105